Register
Process Type
Graphical expression
Mind Type
Structured expression
Note Type
Efficient expression

Iceberg Chart Online Drawing Tool

Free to use
Iceberg Chart Online Drawing Tool
What is Iceberg Diagram

The iceberg chart originates from the field of psychology, first proposed by Freud and later systematized by American psychologist McClelland in 1973, used to analyze human behavior and psychological structure. It divides things into two main parts in an intuitive graphical way: the visible part above the sea surface and the hidden part below the sea surface. The part above the sea surface usually represents those that are obvious, easily observed, or accessible, while the part below the sea surface encompasses those that are not easily perceived and require deep exploration and analysis of underlying factors.
ProcessOn supports online creation of iceberg charts and offers a large number of iceberg chart templates and examples for easy drawing of professional and beautiful iceberg charts.

Free to use

ProcessOn Iceberg Diagram Key Features

Online Collaboration

Supports real-time multi-user co-creation with shareable links for instant information transfer

Online Collaboration
One-Click AI Generation

Automatically generates graphics from text input and applies style enhancements

One-Click AI Generation
Personalized Style Customization

Prebuilt themes with full customization for personalized designs

Personalized Style Customization
Multiple Component Types

Supports icons, images, labels, LaTeX formulas, code blocks, links, attachments and more

Multiple Component Types
Multi-Format Compatibility

Export: PNG, VISIO, PDF, SVG | Import: VISIO, Mermaid

Multi-Format Compatibility
Cross-Device Sync

Real-time cloud storage, multi-device sync, version history, and secure data protection

Cross-Device Sync
Six Core Elements of the Iceberg Model

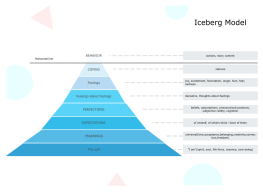
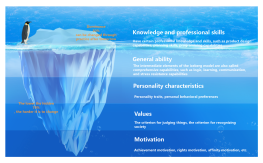
1. Knowledge: Factual and experiential information accumulated by an individual in a specific field, such as professional skills and industry knowledge.
2. Skills: The ability to use knowledge in a structured way to complete specific tasks, such as communication skills and project management skills.
3. Abilities: Potential behavioral qualities, such as learning ability, stress resistance, and innovative thinking.
4. Values: Fundamental cognition and beliefs about value orientation (e.g., integrity, innovation, family priority).
5. Personality: Stable personality response patterns, such as extroversion or caution, affecting long-term work performance.
6. Motivation: Deep-seated drives of behavior, including achievement motivation, power motivation, and affiliation motivation. These elements are often difficult to detect but play a decisive role in long-term behavior.

Create Charts Online
Six
Three Levels of the Iceberg Model

1. Surface: Behavior and Results (Visible Behavior)
Directly observable external manifestations, such as language, actions, and data results (e.g., sales figures, number of tardies). Acts as an entry point to problems, guiding further analysis.
2. Middle: Coping Patterns and Abilities (Underlying Patterns)
Hidden behavioral logic and ability shortcomings, including emotional reactions (e.g., anxiety, anger), coping strategies (e.g., avoidance, appeasement), and skill deficiencies (e.g., lack of communication skills). Connects the surface and deep layers, explaining "why such behavior occurs."
3. Deep: Motivation and Values (Core Drivers)
Fundamental drivers of behavior, including intrinsic needs (e.g., sense of achievement, sense of security), core values (e.g., integrity, innovation), and subconscious beliefs (e.g., "I don't deserve success"). The deep level is where the root causes of problems are found, allowing for the formulation of long-term effective solutions.

Create Charts Online
Three
Applications of the Iceberg Chart

1. Career Development
Individual: Analyze career bottlenecks, identify skill gaps (e.g., communication) and deep motivations (e.g., pursuit of achievement), and match more suitable positions.
Team: Diagnose reasons for inefficiency, distinguish surface conflicts (e.g., task delays) from value conflicts (e.g., innovation priority vs. risk avoidance), and optimize collaboration models.
2. Business Decision-Making
Market Insight: Explore deep needs behind consumer behavior (e.g., buying luxury goods for identity recognition, not just practicality).
Risk Management: Anticipate potential crises (e.g., employee turnover possibly stemming from a mismatch between corporate culture and personal values) and intervene early.
3. Educational Psychology
Family Education: Understand the emotional needs (e.g., desire for respect) behind children's rebellious behavior (e.g., contradicting parents), rather than simply punishing.

Create Charts Online
Applications
How to Analyze Problems with the Iceberg Chart

1. Identify Surface Phenomena: Clarify the most direct manifestations of the problem (e.g., performance decline, employee turnover) using data or behavior descriptions (e.g., "sales dropped 20% for three consecutive months").
2. Explore Middle Patterns: Ask "why" and deconstruct the logic behind behavior (e.g., "customer loss due to slow service response"), ability gaps (e.g., "customer service lacks problem-solving training"), or process defects (e.g., "chaotic order allocation").
3. Trace Deep Motivations: Find the fundamental drivers of the problem (e.g., "team silence due to a culture of fear of making mistakes," "user resistance due to a mismatch between product goals and needs"), which may involve values, organizational design, or implicit rules.

Create Charts Online
How
Iceberg Model and Competency Onion Model

The core difference between the Iceberg Model and the Competency Onion Model is that the Iceberg Model is a theoretical framework describing the stratified structure of individual qualities, while the Competency Onion Model is a capability assessment tool built on theories like the Iceberg Model, targeted at specific positions.
The Iceberg Model is mostly used for theoretical research and talent development guidance; the Competency Onion Model is directly used in practical aspects such as corporate talent selection and performance evaluation.

Create Charts Online
Iceberg

Iceberg Diagram How to Draw?

Iceberg DiagramHow to Draw?
1
Search for 'Iceberg Diagram' in the template community and select an appropriate template to clone.
2
Enter the flowchart editor and use rectangles or circles to layer and label 'Behavior', 'Coping Patterns', 'Motivations and Values', and connect them with lines.
3
Double-click the text section to fill in the core elements of the surface, middle, and deep layers.
4
Select the text box, and use the top toolbar to highlight the text in different colors.
5
Once the iceberg diagram is complete, you can download it or share it with others.
Free to use

Iceberg Diagram Drawing Guide

  • Learn five classic charts to make complex information clear in seconds

    Learn five classic charts to make complex information clear in seconds

    In an era of information explosion, efficiently communicating complex concepts has become a critical skill. Scatter plots , funnel plots, quadrant plots, matrix plots, and iceberg plots—five classic visualization tools—help people overcome cognitive limitations by presenting information in a structured manner. They transform abstract logic into intuitive graphics, revealing the inherent laws of a system while streamlining decision-making processes. They are widely used in fields such as business analysis, educational communication, and project management. The following systematically analyzes the core characteristics and application scenarios of each chart.
    ProcessOn-Skye
    2025-09-17
    148
  • How to make a pyramid chart? Tutorials and templates

    How to make a pyramid chart? Tutorials and templates

    In data visualization and information communication, the pyramid chart is a very effective tool. It displays information through a hierarchical structure, helping people quickly understand complex concepts or data distribution. This article will comprehensively introduce this powerful visualization tool through the concept, examples , drawing methods , templates, etc. of the pyramid chart .
    Skye
    2025-02-13
    1175
  • Comprehensive Guide to Radar Charts - Concepts, Examples, Templates

    Comprehensive Guide to Radar Charts - Concepts, Examples, Templates

    Radar chart, also known as spider chart or polar chart, is a type of chart used to display multivariate data , helping us understand and analyze complex data . It is widely used in business decision-making, financial investment, human resources and other fields. This article will give a comprehensive introduction to radar chart, including its definition, application scenarios, drawing tools, drawing methods , etc.
    Skye
    2025-02-17
    1224

Iceberg Diagram Template Recommendations

More Templates

Iceberg Diagram Frequently asked questions

Can the deep elements of the iceberg model be changed?

Some can be intervened (e.g., enhancing abilities through training, adjusting the environment to stimulate motivation), but core values (e.g., integrity) are usually stable and need to be matched rather than forcibly changed.

How can individuals use the iceberg diagram for self-improvement?

Draw a personal iceberg diagram, identify knowledge/skill gaps (surface), ability blind spots (middle layer), core career motivations (deep layer), and formulate a targeted growth plan.

What is the connection between the iceberg model and the '5 Why Analysis'?

Both pursue root cause analysis, but the iceberg model emphasizes layered structure (behavior-ability-motivation), while 5 Why reaches the essence through continuous questioning of 'why'.

What type of problems is the iceberg diagram suitable for analyzing?

It is more suitable for analyzing complex system issues (e.g., organizational effectiveness, personal development), and may overcomplicate simple problems (e.g., equipment failure). The choice of tool should be based on the scenario.

Are there templates or examples of iceberg diagrams available for reference?

You can visit the ProcessOn template community, which offers a large number of iceberg diagram templates and examples for free cloning and use.

How to export the iceberg diagram as an image or PDF format?

Click the 'Download' button in the upper right corner to export the iceberg diagram in formats such as PNG, JPG, or PDF.

Related Diagrams