Register
Process Type
Graphical expression
Mind Type
Structured expression
Note Type
Efficient expression

Online Cycle Diagram Creation Tool

Free to use
Online Cycle Diagram Creation Tool
What is Cycle Diagram

A cycle diagram is a graphical representation method that uses a closed-loop structure to display the cyclical relationships in a process, system, or event. Its core is to showcase the periodicity, repetitiveness, and interactivity of events or processes, thereby revealing their inherent rules and mechanisms.
ProcessOn supports online creation of cycle diagrams and offers a large number of templates and examples available for replication, allowing you to easily draw professional and aesthetically pleasing cycle diagrams.

Free to use

ProcessOn Cycle Diagram Key Features

Online Collaboration

Supports real-time multi-user co-creation with shareable links for instant information transfer

Online Collaboration
One-Click AI Generation

Automatically generates graphics from text input and applies style enhancements

One-Click AI Generation
Personalized Style Customization

Prebuilt themes with full customization for personalized designs

Personalized Style Customization
Multiple Component Types

Supports icons, images, labels, LaTeX formulas, code blocks, links, attachments and more

Multiple Component Types
Multi-Format Compatibility

Export: PNG, VISIO, PDF, SVG | Import: VISIO, Mermaid

Multi-Format Compatibility
Cross-Device Sync

Real-time cloud storage, multi-device sync, version history, and secure data protection

Cross-Device Sync
Applications of Cycle Diagrams

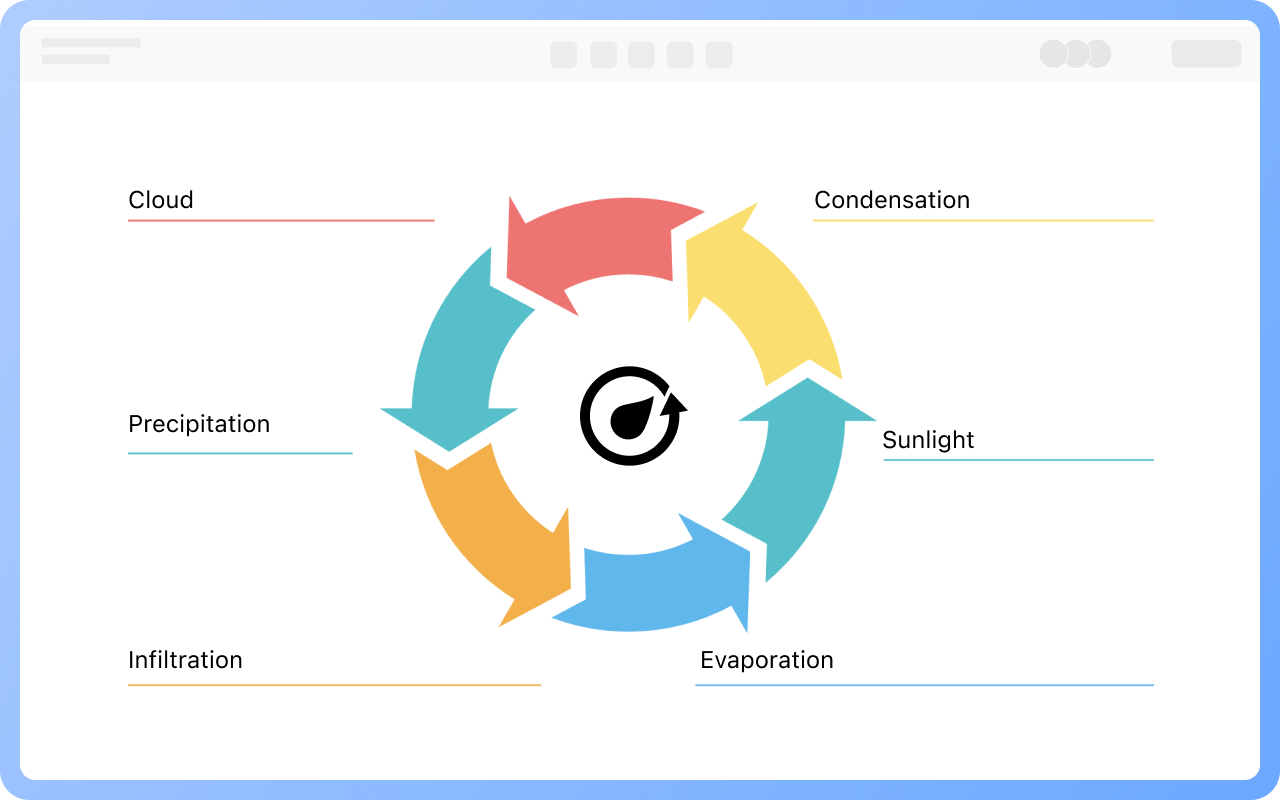
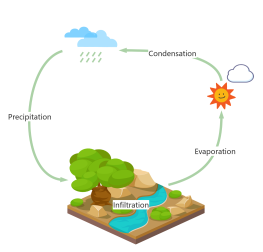
Natural Sciences: Used to describe natural phenomena like material cycles and energy flows in ecosystems, such as the water cycle, carbon cycle, and cell cycle.
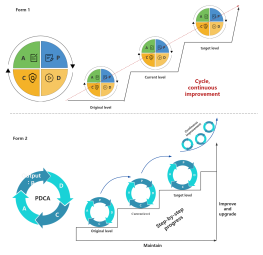
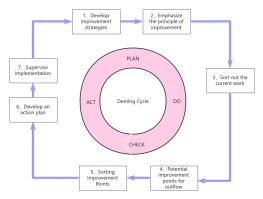
Engineering and Technology: Used to design and optimize production processes, improve resource utilization efficiency, such as lean production in manufacturing and intelligent scheduling in logistics.
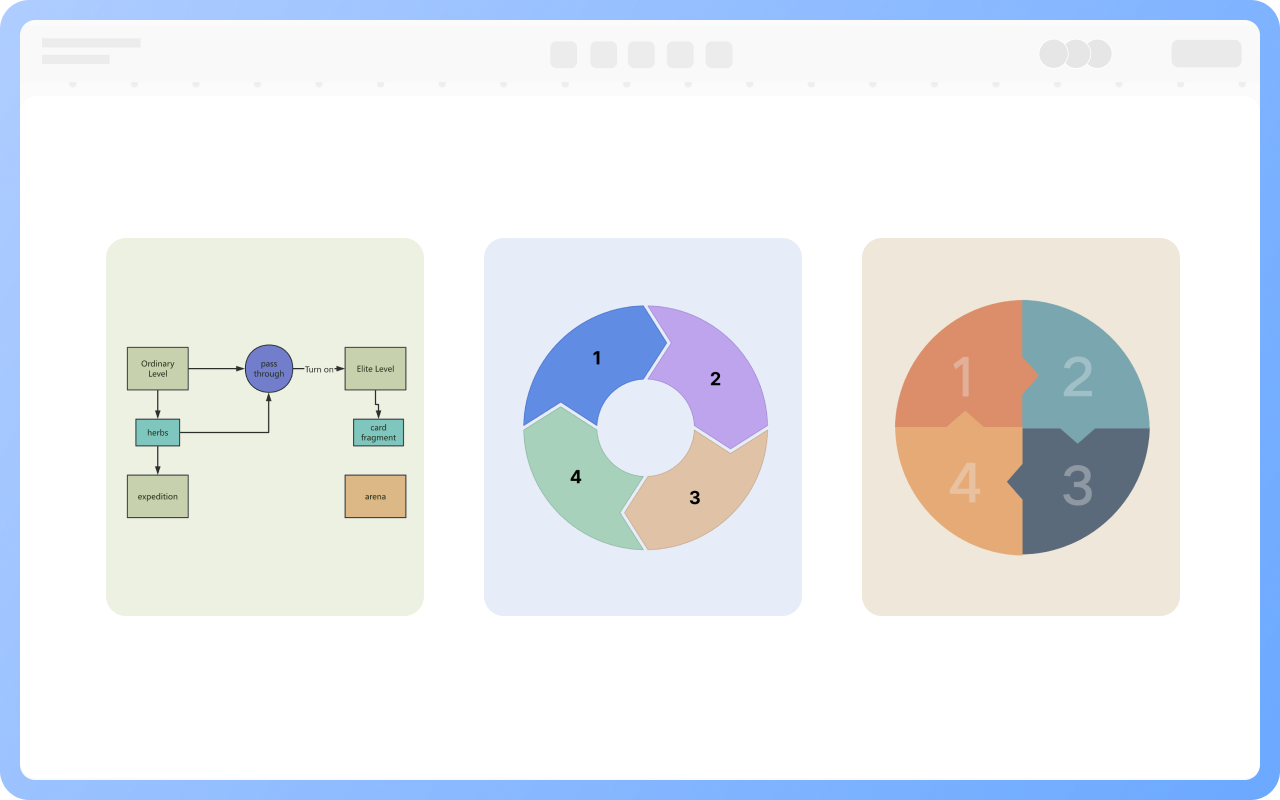
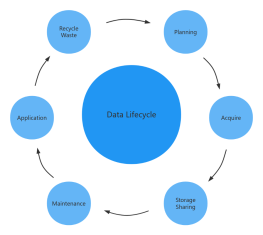
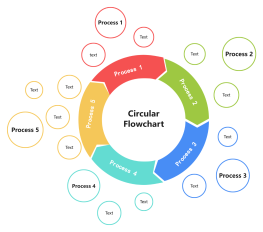
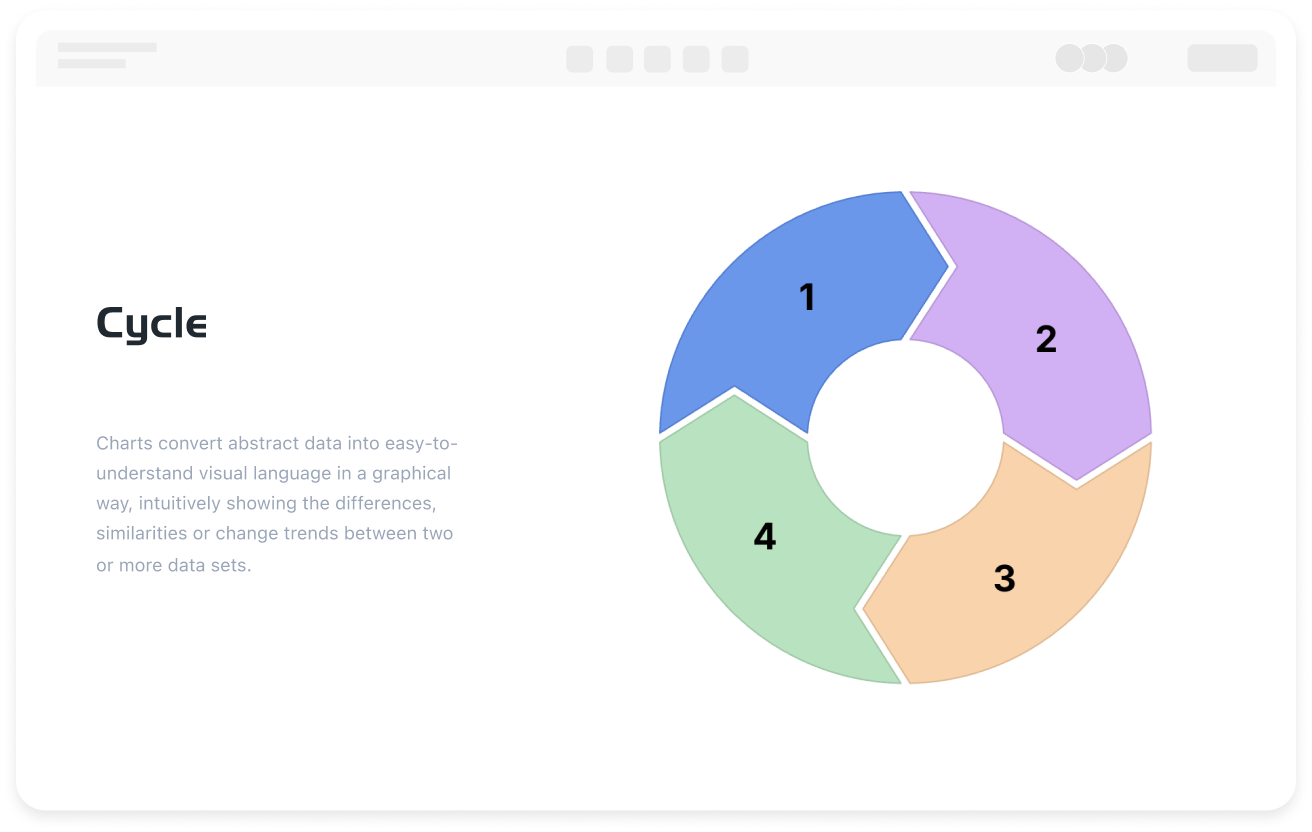
Create Charts Online
Applications
Classification of Cycle Diagrams

Cycle diagrams can be classified into three types based on their function:
Process Cycle Diagrams: Show cyclical tasks or operations, such as project management cycles (PDCA cycle);
Cause and Effect Cycle Diagrams: Reveal positive and negative feedback relationships between variables, such as the inflation spiral;
System Cycle Diagrams: Describe the dynamic balance of complex systems, such as ecosystem cycles.

Create Charts Online
Classification
Best Practices for Designing Cycle Diagrams

Define the purpose of the cycle diagram and list key variables;
The cycle diagram should have <=7 segments to avoid complex structures;
Unify arrow direction (clockwise/counterclockwise).

Create Charts Online
Best
How to Interpret Cycle Diagrams

When interpreting cycle diagrams, grasp the structure and meaning of the chart as a whole, understand the relationships and cycle paths between nodes. Pay attention to analyzing the feedback mechanisms and key segments in the cycle diagram, and consider their impact and role on the system.

Create Charts Online
How

Cycle Diagram How to Draw?

Cycle DiagramHow to Draw?
1
Create a new flowchart, and check the category of the required graphic symbols under 'More Shapes' to the graphics area.
2
Determine the starting point, process, and endpoint of the loop process to be displayed, drag elements such as rectangles from the left side of the graphics area to the canvas, and double-click to add text.
3
Click the '+' on the shape to create arrows to connect various events or links, forming a loop path.
4
Add annotations and explanations in the loop diagram for better understanding and interpretation of the loop process.
5
Select the shape, and adjust properties such as size, color, text font, and font size in the top toolbar.
6
Click the 'Download' button in the upper right corner to export the loop diagram in PNG, JPG, PDF, etc. formats.
Free to use

Cycle Diagram Drawing Guide

  • How to draw a cycle diagram? Tutorial, template

    How to draw a cycle diagram? Tutorial, template

    A cycle diagram is a graphical representation method used to visually display the cyclic relationship in a process, system or event. In the field of natural science, there are water cycles and carbon cycles; in the field of engineering technology, there is the PDCA cycle; in the field of the Internet, there are life cycle cycles of products, technologies, data, etc. The cycle diagram can clearly present the complex cycle process through simple and clear graphics and lines, helping people better understand and analyze the cycle phenomenon.
    Skye
    2025-01-17
    1771
  • How to make a pyramid chart? Tutorials and templates

    How to make a pyramid chart? Tutorials and templates

    In data visualization and information communication, the pyramid chart is a very effective tool. It displays information through a hierarchical structure, helping people quickly understand complex concepts or data distribution. This article will comprehensively introduce this powerful visualization tool through the concept, examples , drawing methods , templates, etc. of the pyramid chart .
    Skye
    2025-02-13
    1055
  • Comprehensive Guide to Radar Charts - Concepts, Examples, Templates

    Comprehensive Guide to Radar Charts - Concepts, Examples, Templates

    Radar chart, also known as spider chart or polar chart, is a type of chart used to display multivariate data , helping us understand and analyze complex data . It is widely used in business decision-making, financial investment, human resources and other fields. This article will give a comprehensive introduction to radar chart, including its definition, application scenarios, drawing tools, drawing methods , etc.
    Skye
    2025-02-17
    1063
  • How to create an onion diagram? Tutorials, templates

    How to create an onion diagram? Tutorials, templates

    Onion diagrams, in a layered way, show different stakeholders, influencing factors or research levels one by one, so as to help people understand the internal relationship of complex problems or systems more clearly. They are widely used in business analysis, social science research, project management and other fields. This article will introduce onion diagrams from the aspects of their functions, examples, and production tutorials, and share multiple onion diagram templates.
    Skye
    2025-01-22
    1539
  • What is the PDCA Cycle? How to use the PDCA model at work?

    What is the PDCA Cycle? How to use the PDCA model at work?

    Today, I will introduce a continuous improvement tool - the PDCA Deming Cycle Model. PDCA is the four stages of quality management, namely Plan, Do, Check and Act. In management activities, it is required to make plans, implement plans, check the implementation effects, and then incorporate successful ones into the standards, and leave unsuccessful ones to the next cycle. It can help you manage projects, keep your eyes on the goal, and optimize and correct them while working hard to execute until success.
    Skye
    2024-11-08
    824

Cycle Diagram Template Recommendations

More Templates

Cycle Diagram Frequently asked questions

Can images be added to a cycle diagram for explanation?

Yes. Click 'Insert Image' in the top toolbar to insert local or online images.

Can the direction of arrows between processes in a cycle diagram be changed?


Yes. Select the arrow and click 'Start Arrow/End Arrow' in the top toolbar to change the direction of the arrow.

How to set the color of graphic elements in a cycle diagram?


Select the graphic in the cycle diagram, use 'Color Fill' in the top toolbar to set the color of the graphic, and 'Line Color' to set the border color of the graphic.

Can the connecting lines between processes in a cycle diagram be set to curves?


Yes. Select the line, and in the top toolbar 'Line Type', you can set the connecting lines between processes to curves.

Are there templates or examples of cycle diagrams available for reference?


You can visit the ProcessOn template community, where there are numerous cycle diagram templates and examples available for free cloning and use.

Related Diagrams