Process Type
Graphical expression
Mind Type
Structured expression
Note Type
Efficient expression
Treemap
Bracket Diagram
Default Mode


A cycle diagram is a graphical representation method used to visually display the cyclic relationship in a process, system or event. It clearly presents the complex cycle process through concise and clear graphics and lines, helping people to better understand and analyze the cycle phenomenon. The core of the cycle diagram is to show the periodicity, repetitiveness and interactivity of an event or process, thereby revealing its internal laws and mechanisms.
Concept visualization: Cycle diagrams can present abstract concepts or complex processes in an intuitive way, making them easier to understand and remember.
Optimize the process: Through the cycle diagram, you can clearly see the relationship and dependency between each step or link, so as to optimize the process and improve efficiency.
Assist decision-making: The cycle diagram can show the overall framework and key nodes of an event or process, providing strong support for decision-making.
Natural science field: used to describe natural phenomena such as material circulation and energy flow in ecosystems.
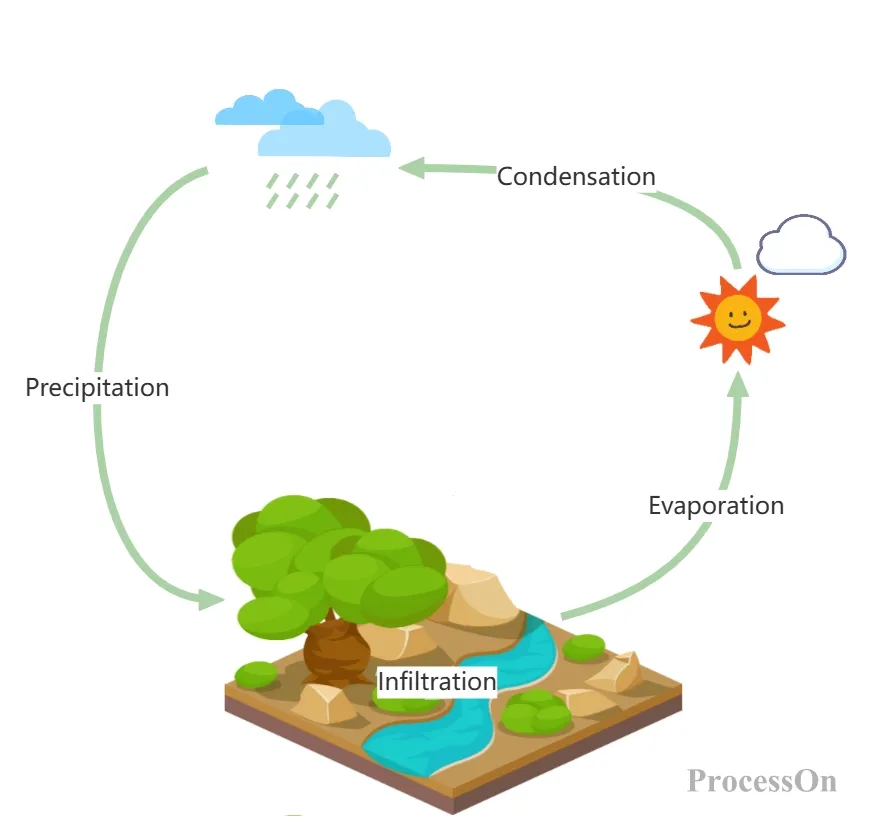
Example: Water Cycle
Water in various forms in nature, under the influence of solar radiation, the earth's gravity, etc., undergoes a continuous cycle of movement through evaporation, water vapor transport , condensation and precipitation, and infiltration.
Engineering technology field: used to design and optimize production processes and improve resource utilization efficiency, such as lean production in the manufacturing industry and intelligent scheduling in the logistics industry.
Example: PDCA cycle
The meaning of the PDCA cycle is to divide management into four stages: Plan, Do, Check and Act. Successful experiences are incorporated into the standards , and unsuccessful experiences are left to the next cycle. This working method is the basic method of management and the general rule of various management tasks of an enterprise.
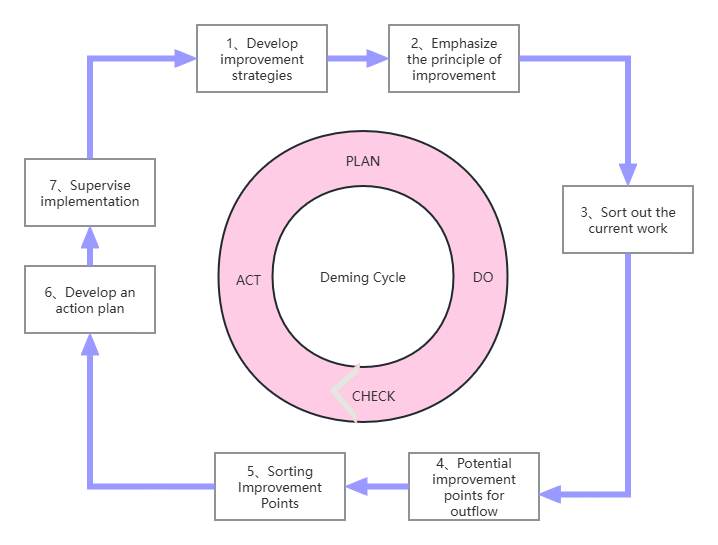
Continuous Improvement-Deming Cycle
Petrochemical field: It can clearly display the steps and products in the production process of the petrochemical industry. By recycling these resources, the resource utilization efficiency can be significantly improved and production costs can be reduced.
Example: Diesel Hydrogenation Hydrogen Cycle
This cycle shows the process in which hydrogen is produced into diesel through a series of processes such as compressors and reactors, while the remaining hydrogen is recycled again to maximize the use of resources.

Diesel Hydrogenation Hydrogen Cycle
There are many producers for drawing cycle diagrams, such as Word, PPT, Lucidchart, ProcessOn, etc. Here are the steps to draw a cycle diagram using ProcessOn:
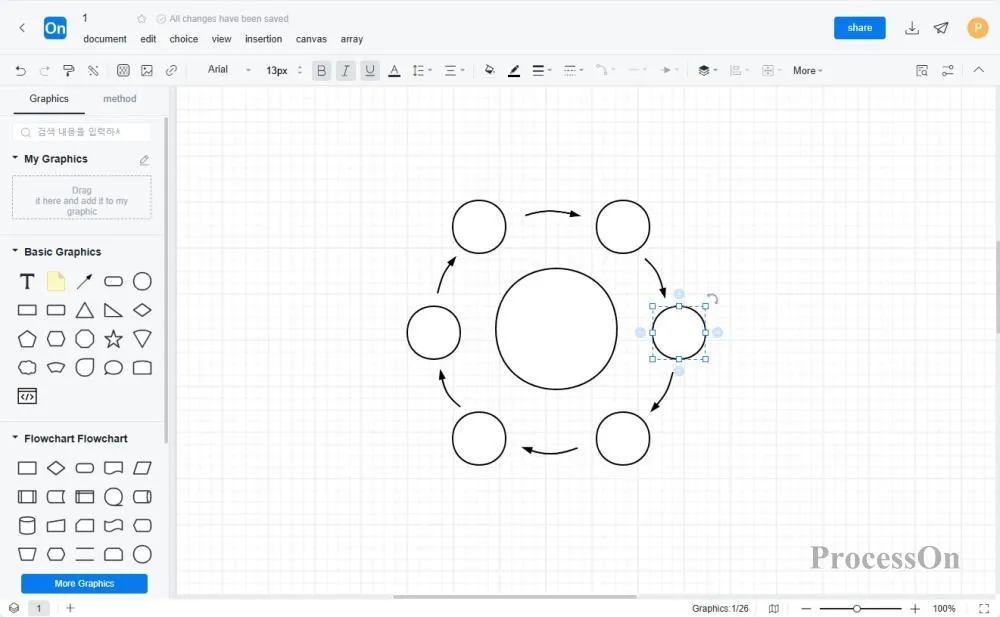
1. Open the official ProcessOn website, enter the personal file page, and click New to create a flow chart .
2. Clearly identify the starting and ending points of the cycle process to be displayed. According to the main events or links of the cycle process , drag the corresponding graphics from the graphics library on the left side of the flowchart maker to the canvas, and double-click the graphics to add text .
3. Import custom arrow shapes or click the "+" on the shape to create arrows to connect events or links to form a loop path. Note that the direction of the arrow should indicate the order in which the events or links occur.
4. As needed, add comments and explanations to the cycle diagram to better understand and explain the cycle process.
5. Select the graph and use the top toolbar to adjust the graph's size , color, text font, font size and other properties to make the cycle graph more beautiful and easier to understand.

The ProcessOn template community contains a variety of flowchart templates for reference in multiple industries, and supports cloning to improve drawing efficiency. The following are some templates for sharing.
The life cycle diagram can be used to describe the entire process of an object or entity from birth to death. The life cycle diagram emphasizes the cyclical and repetitive nature of this process. This object or entity can be an organism, product, project, technology, data, user, and many other entities.
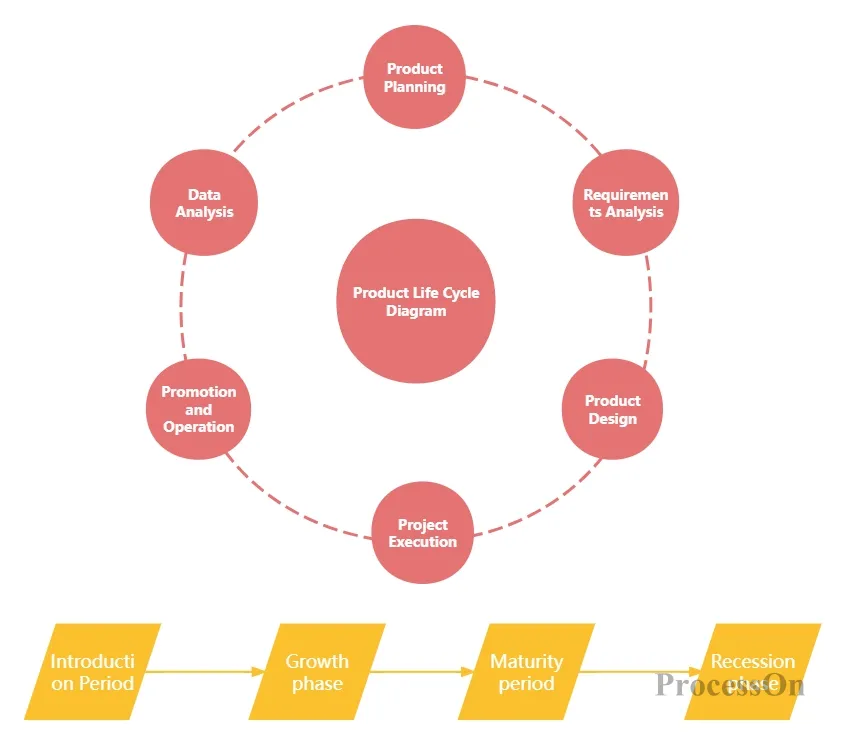
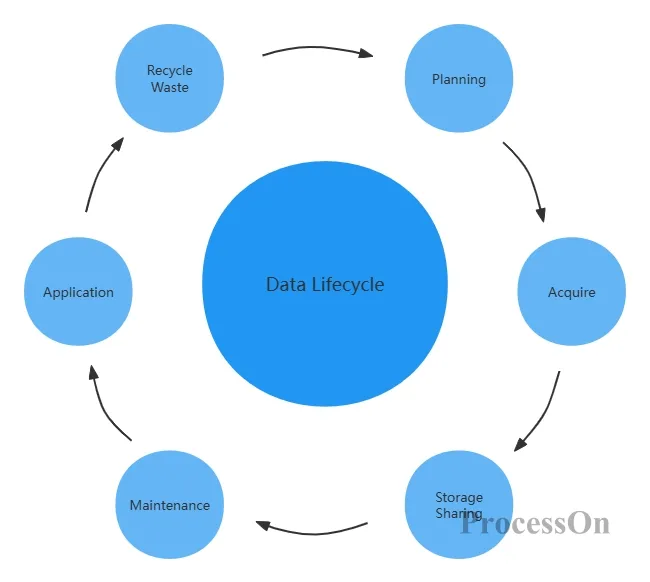
Below is a sharing of creative cycle diagram templates that can describe the cycle process of any thing.
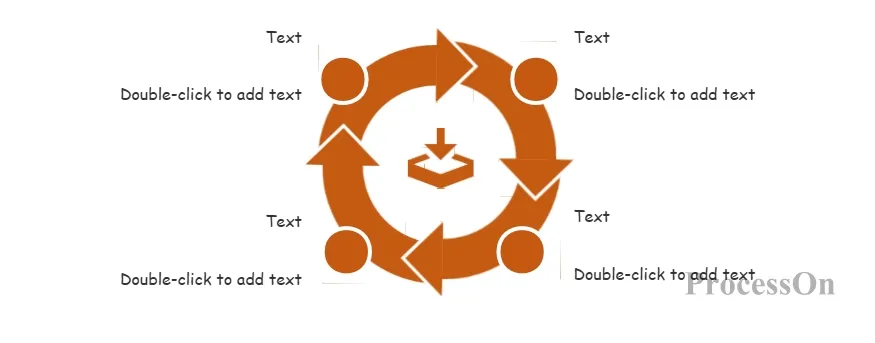
Creative timeline, cycle diagram
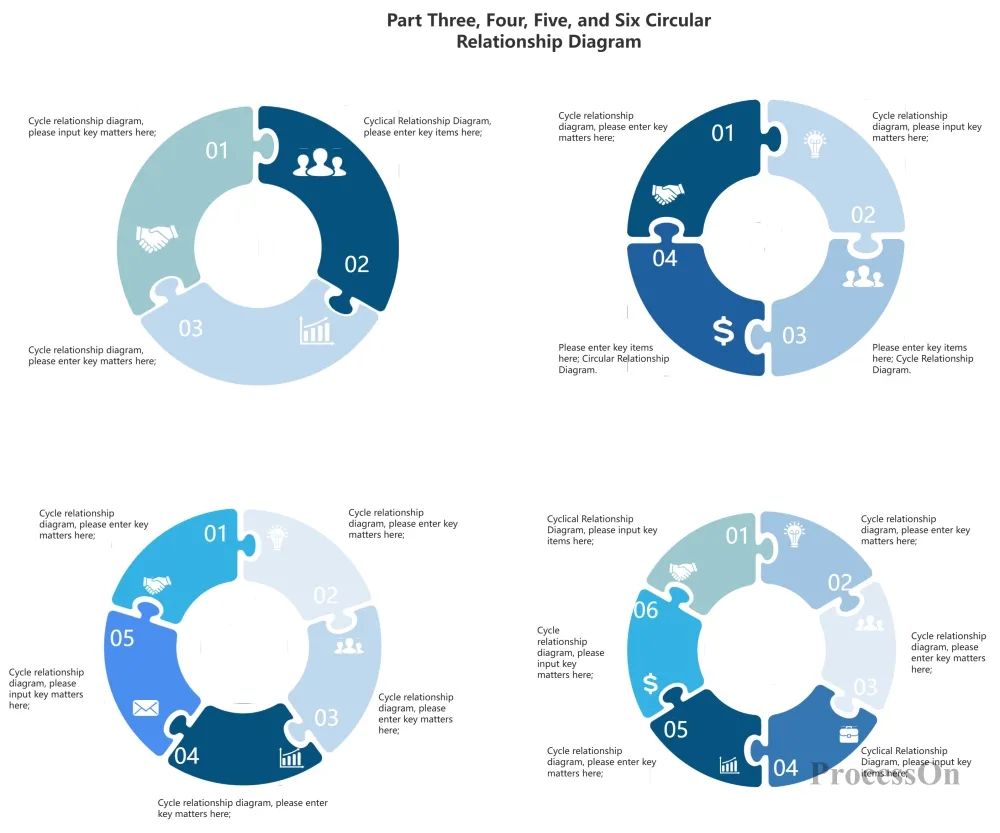
Circular relationship diagram template
As a powerful graphical representation tool, the cycle diagram has the advantages of being intuitive, concise, and easy to understand. I believe that through the sharing of the above content , we can better use the cycle diagram to display and analyze complex processes and systems . I hope this article can provide you with useful reference and inspiration for understanding and using the cycle diagram.