Process Type
Graphical expression
Mind Type
Structured expression
Note Type
Efficient expression
Treemap
Bracket Diagram

Default Mode





Every HR professional has experienced this scenario: They spend a whole week writing a recruitment and training plan spanning dozens of pages, send it to the business unit manager, and the manager replies, "It's too much, I don't have time to read it. Just tell me when you're going to give me the people and when you're going to give me the training." The boss, after reading it, also says, "The content is very detailed, but what I need is a clear roadmap, not a collection of documents."
Where does the problem lie? Traditional planning is "professional reports written for insiders," while what bosses and business departments need is a "battle map to drive joint action." The former piles up text and tables, while the latter uses charts to speak.
Truly high-level HR professionals have long since mastered the art of using charts for planning—using mind maps to break down the big picture, flowcharts to streamline processes, Gantt charts to manage progress, and funnel charts to track data. This article will guide you step-by-step on how to use these four types of charts to create clear, professional, and actionable HR recruitment and training plans.
Recruitment is a major focus of HR's annual work. From confirming needs to onboarding, it involves multiple stages and roles, which is difficult to explain clearly in words alone. The following three diagrams will help you manage the recruitment process with clarity.
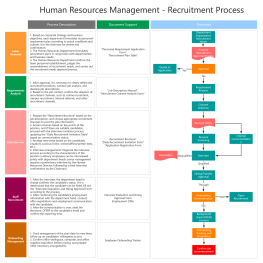
The recruitment process involves multiple roles, including the hiring department, HR, interviewers, and candidates. The responsibilities and handover points at each stage need to be clearly defined. A swimlane diagram (cross-functional process diagram) can perfectly solve this problem.
Drawing method: Horizontally, multiple swimlanes are set up, corresponding to roles such as "Hiring Department," "HR," "Interviewer," and "Candidate." Vertically, the recruitment steps are arranged chronologically: requirement confirmation, job posting, resume screening, initial interview, second interview, offer approval, and onboarding. Arrows are used to indicate the handover relationships between each step, and diamond boxes are used to mark decision points (e.g., "Did the interview go well?").
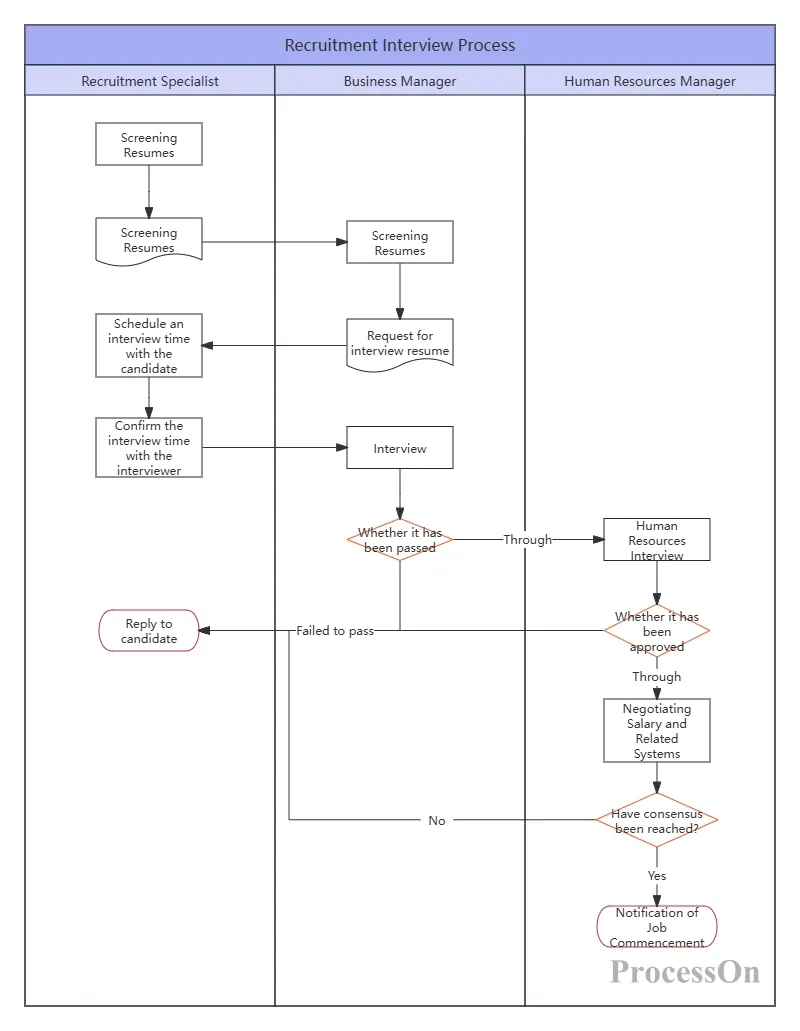
A recruitment flowchart helps everyone clearly understand their role and tasks in the recruitment process, reducing buck-passing and disputes. A newly hired HR specialist can grasp the complete recruitment process in just 5 minutes with this flowchart.
With the process clear, the next step is to address the timeline: How will the recruitment needs be distributed throughout the year? When will the recruitment process begin for each position? When will it be completed?
Use a Gantt chart to lay out the recruitment tasks along a timeline. The horizontal axis represents dates , and the vertical axis represents various recruitment tasks—personnel budget preparation, campus recruitment plans , and external recruitment for core positions , etc. Each task is marked with a start and end time using horizontal bars, and different colors are used to distinguish priority and progress status.
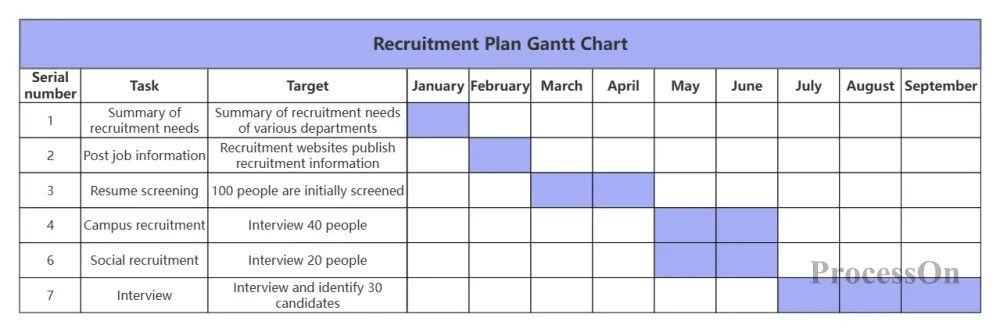
The most important thing for bosses and business departments is "when will the people be in place?" Gantt charts make the recruitment process clear at a glance and also help HR to anticipate resource conflicts in advance—for example , whether there are enough people when recruitment and annual salary adjustments are carried out at the same time.
With the process in place and the timeline set, a tool is needed to monitor the results during execution. This is where a recruitment funnel chart comes in.
The recruitment funnel visually represents each stage of the recruitment process—resume submission, resume screening, initial interview, follow-up interview, offer issuance, and onboarding. The width of each layer represents the number of candidates at that stage, and the variation in width between layers intuitively reflects the conversion rate.
Method: List each stage from top to bottom, using the width of the trapezoid to represent the number of people or conversion rate . For example: 500 job exposures → 50% of job views → 10% of applications → 40% of initial resume screening → 70% of business department interviews → 33% of final interviews .
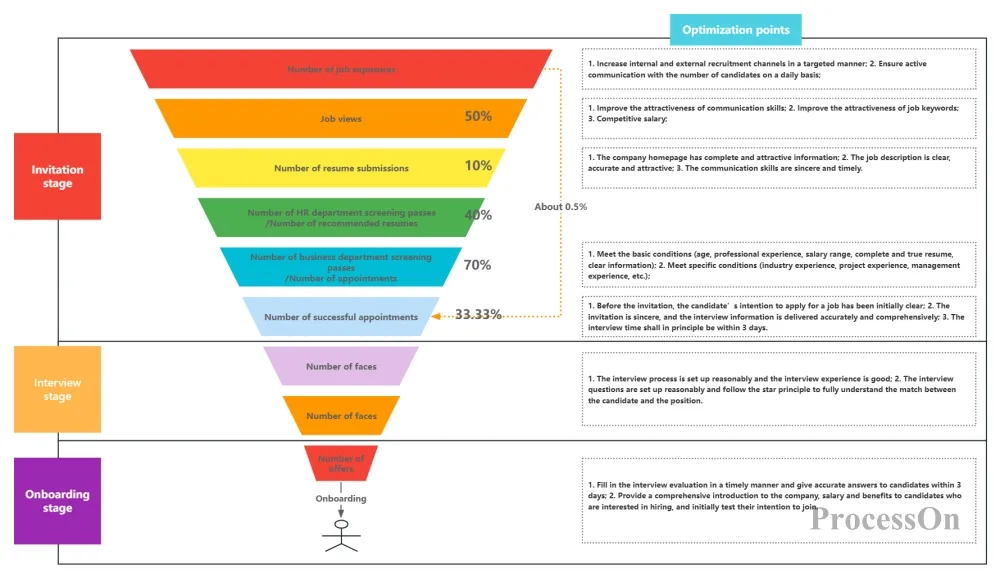
The point where the conversion rate is unusually low indicates where the problem lies—it could be overly strict interview standards or an inaccurate job description. Funnel charts make recruitment results "visible," helping HR pinpoint bottlenecks rather than relying on intuition.
Training planning is more difficult than recruitment because its output is not as easily quantifiable as "how many people were recruited." Many HR professionals write training plans with detailed content and complete course lists, but after reviewing them, bosses still don't know "what are the key training initiatives to achieve this year?" The following two diagrams can help you upgrade your training plan from a "course list" to a "battle map."
The biggest problem with training work is that it's often done "when you feel like it, you do it; when you get busy, you stop." Using a Gantt chart to arrange the year's training programs along a timeline can effectively avoid this situation.
Chart format: The horizontal axis represents months, and the vertical axis represents various training programs—new employee onboarding training, management pipeline development, professional skills training, company-wide cultural training, etc. Each program is marked with a horizontal bar indicating the start and end dates, and key milestones (such as "course development completed" and "training effectiveness evaluation") are marked with diamonds.
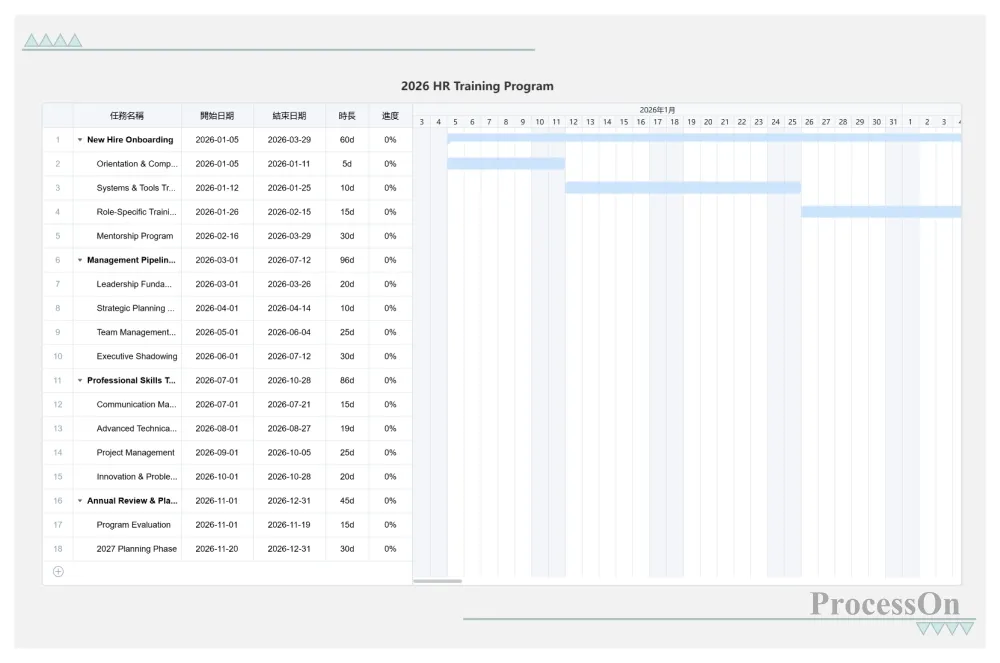
HR Annual Training Plan Gantt Chart
Gantt charts provide a clear overview of the year's training schedule—preventing situations where there's no activity in the first half of the year and a rush of training sessions in the second half. They also help HR coordinate resources such as instructors, venues, and budgets in advance, avoiding last-minute scrambling.
Training, from needs assessment to effectiveness evaluation, is a complete closed-loop process. Drawing a flowchart of it ensures that no key steps are missed.
Methodology: Begin with "Training Needs Survey," then connect the following steps sequentially: "Needs Analysis → Training Plan Development → Course Development/Procurement → Instructor Selection → Training Implementation → Effectiveness Evaluation → Improvement Plan," forming a complete PDCA cycle. Mark the responsible person and time requirements at each key node.
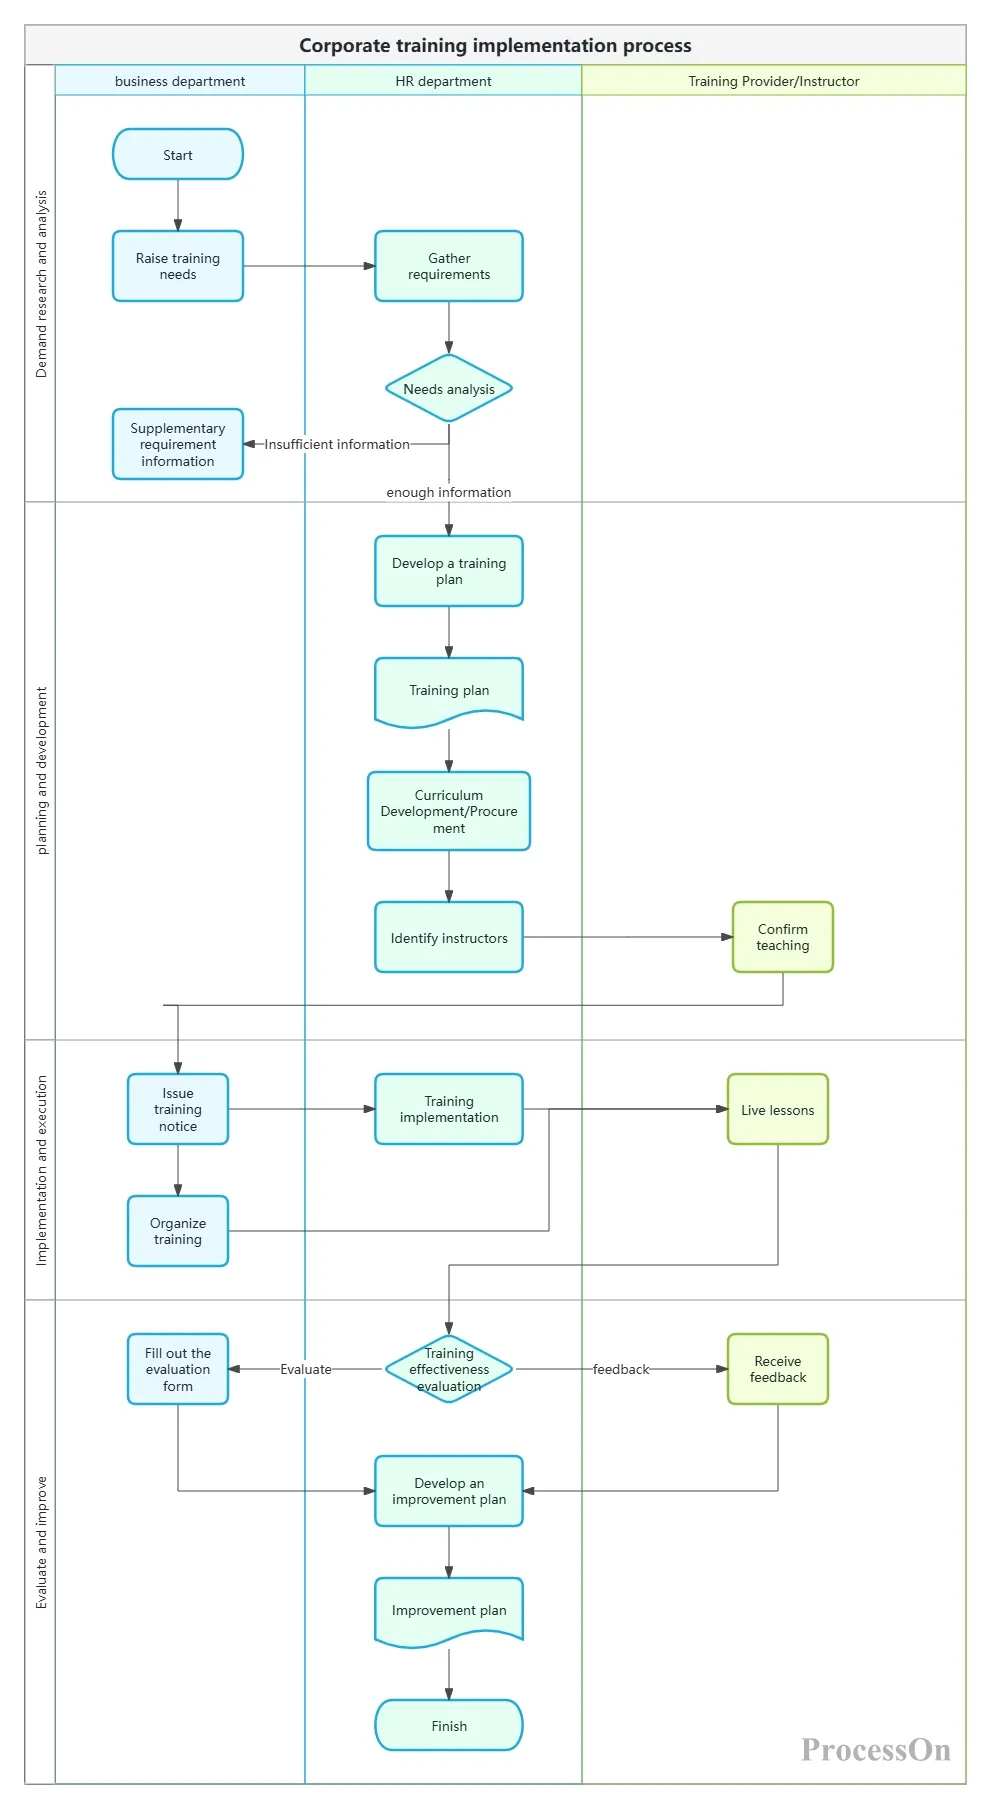
With this diagram, the training manager has a clear understanding of what needs to be done at each step and who to hand it over to, avoiding the awkward situation of "finding that the instructor hasn't been booked after the course is developed."
Recruitment and training are planned separately, but annual HR work involves much more than just these two areas—there are also performance management, compensation, employee relations, organizational development, and so on. If each module requires a separate plan, the boss won't be able to keep track, and you yourself may easily overlook some aspects.
Mind mapping is a powerful tool for solving this problem. Put all the modules of HR's annual work on one map, radiating outwards from the center.
Methodology: The central theme is "2026 HR Work Plan." The first level of branches consists of major modules: Recruitment and Staffing, Training and Development, Performance Management, Compensation and Benefits, Employee Relations, and Organizational Development. Each module is further broken down into specific projects and key tasks. Each task is labeled with its responsible person and deadline, and priority is distinguished by color.
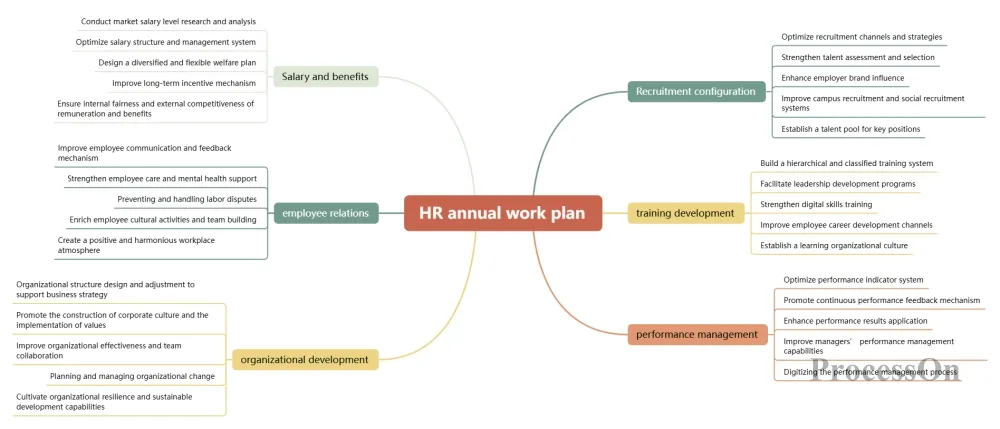
This diagram helps HR professionals see the overall picture of their work throughout the year, avoiding the pitfall of neglecting training while focusing on recruitment. More importantly, when reporting to the boss, a single diagram can clearly explain the overall structure of HR's work for the year, making it more persuasive than dozens of PowerPoint slides.
All the charts mentioned above—flowcharts, Gantt charts, funnel charts, and mind maps—can be efficiently created using the professional online charting tool ProcessOn .
Massive HR template library: Search for "recruitment flowchart", "annual training Gantt chart", or "HR work planning mind map" to find ready-made templates that can be reused directly, saving you the time of drawing from scratch.
Drag-and-drop operation: No drawing skills required. Simply drag and drop shapes from the left-hand library onto the canvas, and the connecting lines will automatically snap and align.
Multi-person collaboration: Multiple HR team members can edit the same planning map simultaneously, comment and communicate in real time, eliminating the need to repeatedly send files.
Multi-format export: Supports exporting to PNG, PDF, SVG and other formats, which can be directly inserted into annual planning PPTs or reporting materials.
Cloud storage: All files are automatically saved, can be modified and updated at any time, and historical versions can be traced.
The annual recruitment and training plan is not essentially about "writing documents," but about "designing an executable system." Text is suitable for recording details, tables are suitable for organizing data, while charts are suitable for presenting the overall picture, clarifying logic, and controlling progress.
Mind maps break down the overall picture, flowcharts organize processes, Gantt charts manage progress, and funnel charts track data—these four types of charts each serve their own purpose and together constitute a complete HR annual planning system.
Next time you make your annual plan, don't write dozens of pages of rambling details. Open a charting tool and start with a mind map to "draw" out your work for the whole year. You'll find that what was originally a chaotic annual plan has turned into a clear battle map—understandable to your boss, keep up with your team, and manageable by yourself.