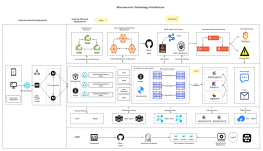
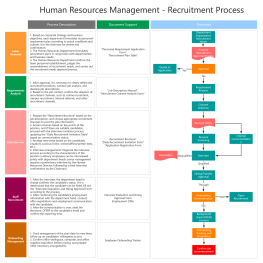
Process Type
Graphical expression
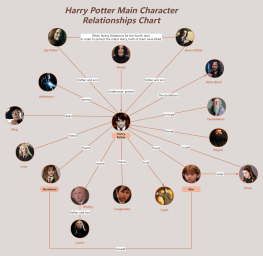
Mind Type
Structured expression
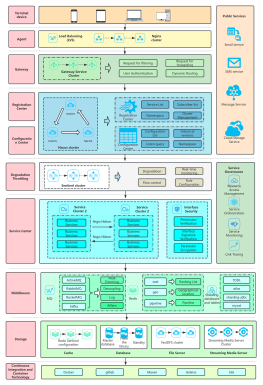
Note Type
Efficient expression
Treemap
Bracket Diagram

Default Mode





Have you ever had this experience: writing down your annual plan with great confidence at the beginning of the year, only to find that you've completed less than 30% by the end of the year; or saying you'll finish a project at the beginning of the month, only to find it's still "in progress" by the end of the month; or even finding that half of the to-do list you write down every Monday hasn't been touched at all when you review it on Friday?
Many people confuse "writing a plan" with "making a plan"—the former involves creating a wish list, while the latter involves designing an actionable system. This article presents a combination of six charts to take goal management to a new level.
Don't rush to blame yourself for poor execution. There are often four underlying reasons why plans fail to materialize:
"I need to improve performance this year," "I need to optimize user experience this quarter," "I need to strengthen team management next month"—these goals all sound right, but none of them can be directly translated into "What should I do at 9 a.m. tomorrow?" If a goal cannot be broken down into specific action instructions, it will forever remain at the level of aspiration. A goal without development is like a destination without navigation—you know where you want to go, but you don't know how to get there.
Having goals and a task list is one thing, but many people overlook the most crucial element: the logical relationships between tasks. Which tasks must be done first? Which can be done in parallel? Which are prerequisites? Which are alternatives? Without a clear path, execution becomes "based on mood"—doing whatever comes to mind today, or doing whatever comes up tomorrow. While seemingly busy every day, there's a lack of coherence and direction.
During execution, you will inevitably encounter choices: both options are feasible, which one to choose? If the schedule is behind schedule, should you work overtime to catch up or adjust the scope? If the client raises new requirements, should you accept or reject them? Many people hesitate in the face of these decisions, or act on gut feeling, often resulting in "choosing the wrong direction and working in vain." This isn't because you can't think, but because you lack a structured decision-making framework.
The most terrifying thing about executing a plan isn't encountering difficulties, but going astray without anyone noticing. You work diligently for two weeks, then look up and realize that what you've done has strayed a million miles from the initial goal. The reason is simple: you didn't set up "checkpoints." A plan without monitoring is like a car without a dashboard—you'll never know if you're speeding or stalling.
Different charts are good at solving different problems. Combining six different charts can cover every aspect of goal management.
Before executing a plan, stop and ask yourself: "Why haven't I achieved this goal before? What are the real obstacles?" A fishbone diagram is a tool used to answer this question. By systematically analyzing all possible reasons behind a problem, it helps you find the true "root cause" and avoid wasting effort in the wrong direction.
Usage: Write "Goal Not Achieved" or "Plan Not Performed Effectively" at the head of the fish, then customize dimensions according to the actual situation to investigate possible causes one by one. Continue to ask "why" under each dimension until you find the root cause that can be acted upon.
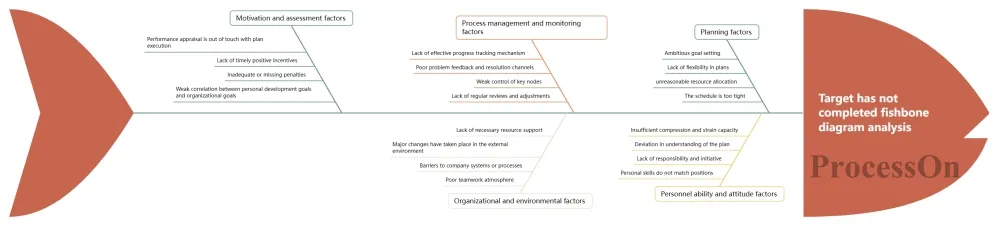
Why it works: Many plans fail to execute not because the tasks weren't broken down enough, but because the real bottlenecks weren't identified. The fishbone diagram forces you to examine problems from multiple dimensions, avoiding the trap of "only looking at the surface." Only after finding the root cause can targeted measures be developed, making the plan a viable option.
Once the root cause is identified, the next step is to break down the goal. The radial structure of mind maps naturally matches the brain's associative patterns, allowing you to start from the central goal and gradually expand outwards to stages, tasks, and sub-tasks.
Usage: Write your annual goals in the center. The first level of branches are the four quarters, the second level is the core tasks of each quarter, and the third level is the person responsible for each task, the resource requirements, and the expected results.
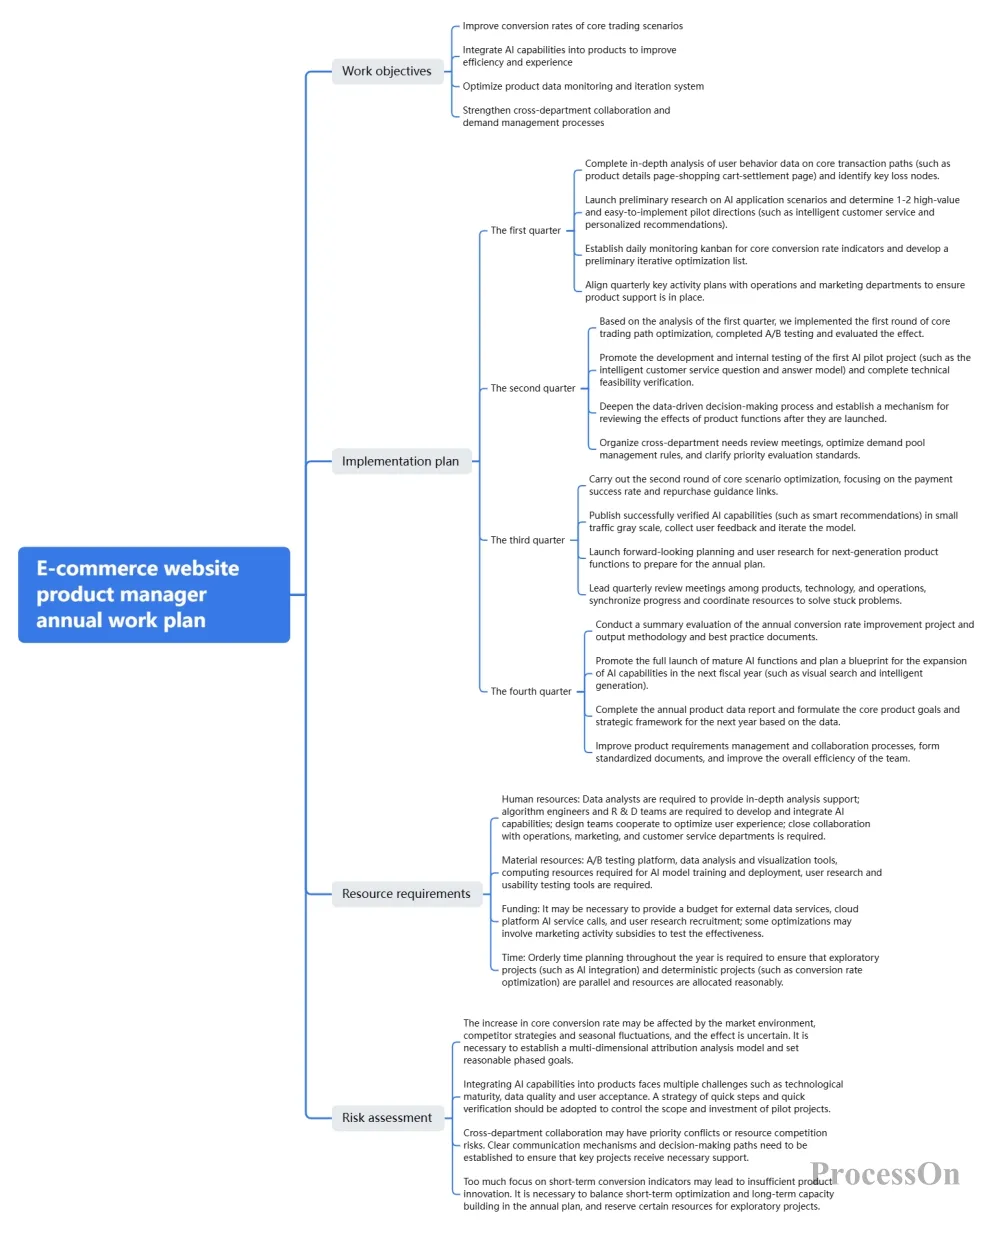
Why it works: Mind mapping forces you to answer "What are the components of this goal?", turning vague desires into a structured task list. It breaks things down to the level of "I can start doing it immediately tomorrow morning."
With the task list in place, the next step is to clarify what to do first, what to do next, what can be done simultaneously, and what needs to wait for others to finish before it can be done. A flowchart lays out all the logical relationships between tasks on paper, allowing you to see the overall path.
Usage: Use rectangles to represent task nodes, arrows to connect them in sequence, and diamonds to represent decision nodes. Parallel tasks are represented by parallel branches, and prerequisites are marked with dashed lines.
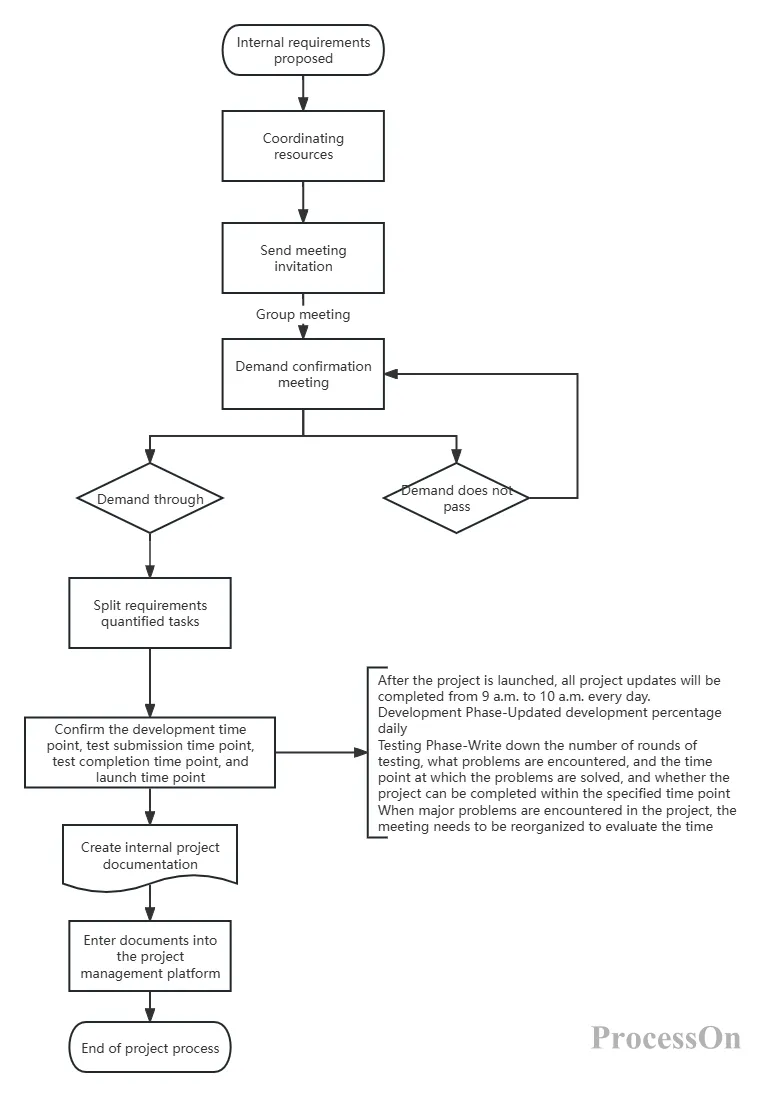
Why it works: You don't need to mentally rehearse "Can I do that only after this is done?" All the logical relationships are immediately clear. More importantly, flowcharts allow you to identify the "critical path" in advance—which tasks, if delayed, will cripple the entire project.
Mind maps tell you "what to do," and flowcharts tell you "what to do first and what to do next," but there's still a crucial question unanswered: How long does each task take? When to start? When to finish? This is the question that Gantt charts are needed to answer.
Usage: The horizontal axis represents time (week/month), and the vertical axis represents the task list. Each task is represented by a horizontal colored bar indicating the start and end times and duration. Use color to distinguish task status (in progress/completed/pending start/delayed), and use diamonds to mark milestone nodes.
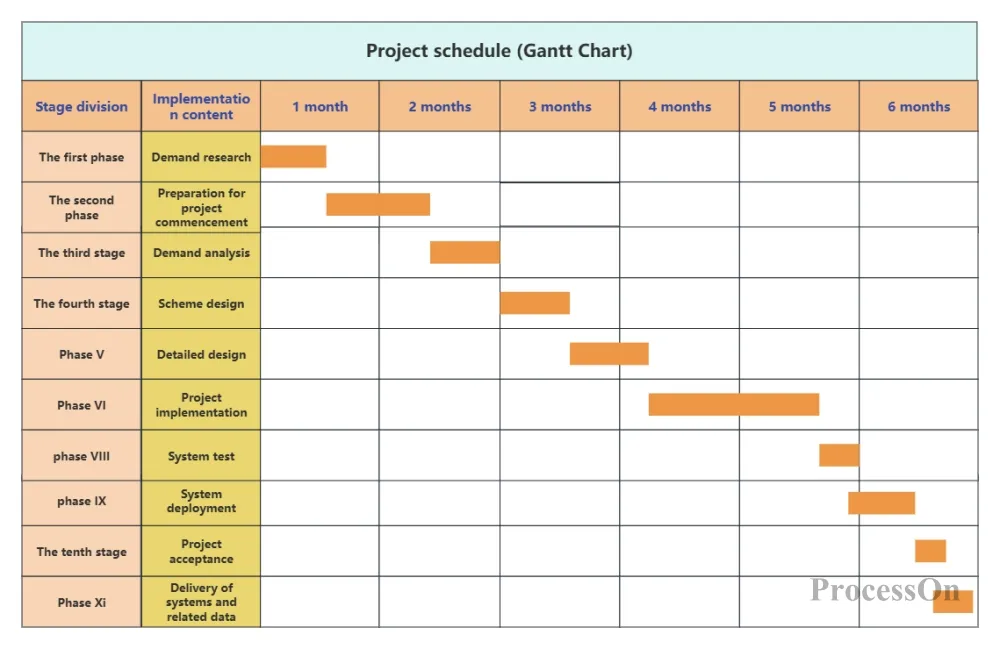
Why it works: Gantt charts allow you to see at a glance "how many things I'm doing simultaneously during this period," "which tasks have overlapping timelines," and "whether the overall progress is ahead or behind." When a task is delayed, you can quickly determine which subsequent tasks it will affect.
One of the most easily overlooked aspects of plan execution is the visualization of progress. Tasks are assigned, but there's a lack of a unified view of where each person is and where they're stuck. Kanban boards are precisely the tool to solve this problem.
Usage: Divide the canvas into three columns—To Do, In Progress, and Completed. Tasks move between columns as cards, each labeled with the responsible person and deadline. You can also add a "Blocked" column to mark tasks that are blocked and cannot be progressed.
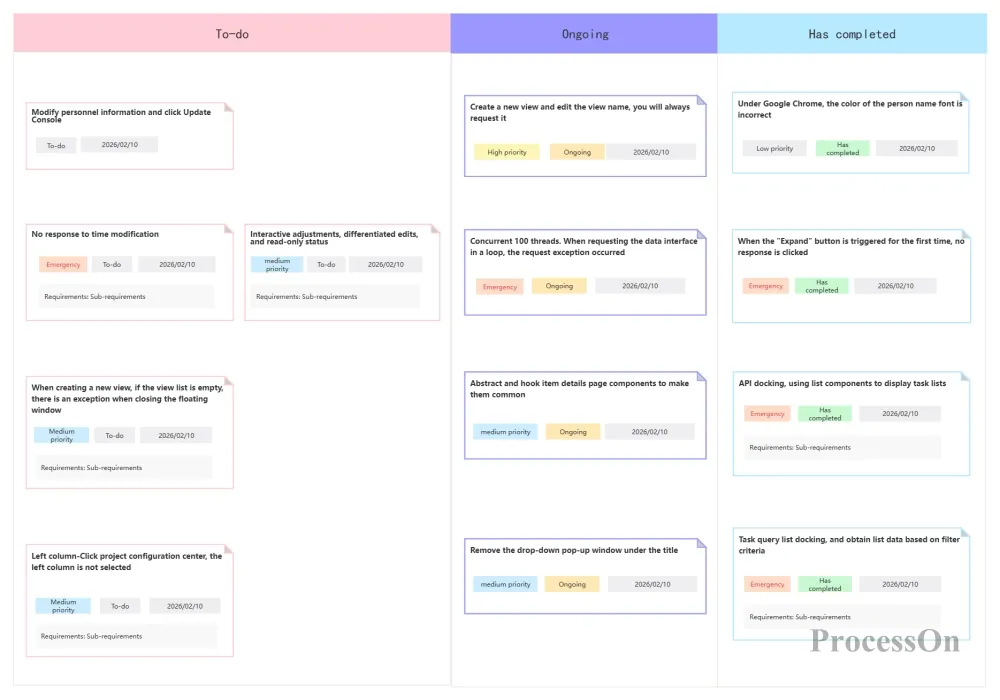
Why it works: Kanban boards transform progress from being "hidden in everyone's minds" to being "laid out in front of everyone." During weekly stand-up meetings, a quick review of the Kanban boards reveals who's stuck, who needs support, and whether the overall pace is on track—problems can be identified in just three seconds.
During the execution process, you will inevitably encounter forks in the road. At this time, a decision tree diagram can help you transform "gut feeling" into "condition-based rational judgment".
Usage: Starting from the decision node, draw all feasible option branches, labeling each branch with the conditions that the option must meet, the expected resource input, and the possible outcome. If the outcome of a branch is still uncertain, continue expanding to the next level of decision nodes until each path ends with a clear conclusion.
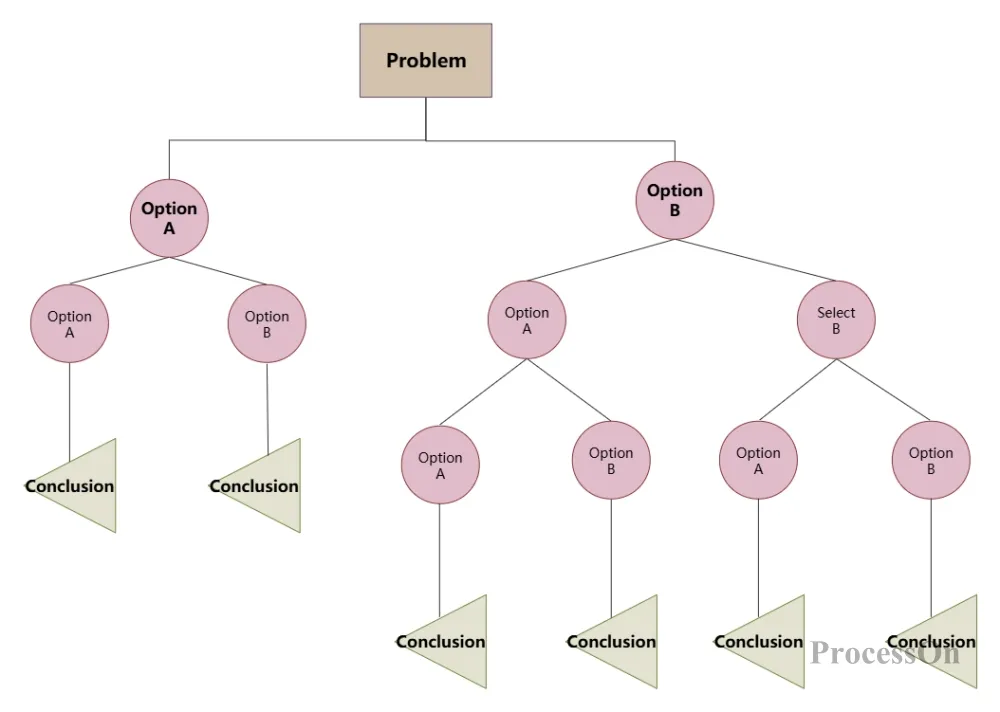
Decision Tree Diagram Template
Why it works: Decision trees help you think ahead about "when to take path A and when to take path B," instead of struggling with a decision when a problem occurs. When external conditions change, you can quickly determine "whether the previous choice still holds true, or whether it is necessary to switch branches."
Traditionally, drawing these diagrams requires you to repeatedly think about the structure, adjust the layout, and align the nodes—just "turning an idea into a diagram" can take half an hour or even longer. But the emergence of AI has shortened this process to just a dozen seconds.
You can directly describe your goals in natural language within ProcessOn— "Draw a fishbone diagram to analyze the main reasons for project delays last quarter"—and the AI will automatically generate the analytical framework. Then, tell the AI to "arrange the tasks into a flowchart and label the dependencies," and then ask it to "generate a Gantt chart schedule." The AI will generate a timeline view based on the same task data.
This means that you no longer need to spend a lot of time "drawing diagrams," but can instead focus your energy on the more fundamental issue of "clarifying your goals."
If your plans fail to materialize, it's not because you're not working hard enough, but because you're using the wrong tools. Text is suitable for recording ideas, tables are suitable for organizing data, and combining different charts is suitable for managing the entire lifecycle of goals—from root cause analysis to goal breakdown, from path planning to time scheduling, from progress tracking to decision-making and response, with each step interconnected and leaving no blind spots.
 Following the tutorial to try
Free to use ProcessOn
Following the tutorial to try
Free to use ProcessOn