Process Type
Graphical expression
Mind Type
Structured expression
Note Type
Efficient expression
Treemap
Bracket Diagram
Default Mode


As an intuitive and efficient visual communication tool, flow charts are widely used in many fields such as project management, business process optimization, education and training, etc. A well-designed flowchart can not only significantly improve work efficiency, but also help team members quickly understand complex processes. This article will guide you on how to design a flow chart that is both practical and beautiful from three aspects : in-depth design ideas, pitfalls to avoid, and detailed drawing steps.
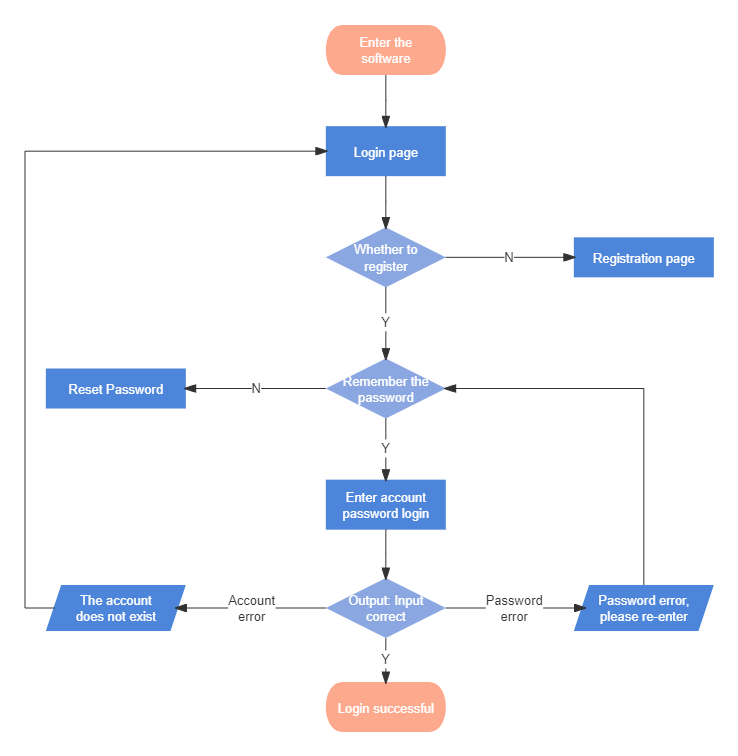

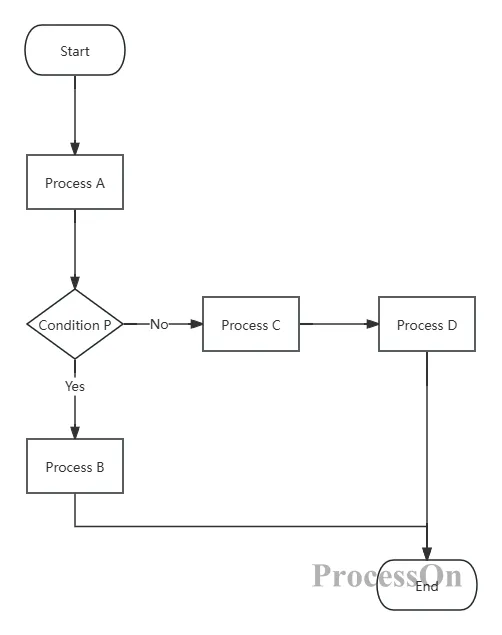
Product Login (Basic) Flowchart
1. Clarify purpose and scope
Refine the goal: At the beginning of the design, it is necessary not only to clarify the overall goal of the flowchart, but also to refine the specific effect that each step hopes to achieve. This will help maintain direction in subsequent designs and avoid deviation from the theme.
Define scope: Determine the breadth and depth of the flowchart, whether to show the entire project life cycle or focus on a specific stage or functional module . Clear scope definition helps to streamline and focus the process .
2. Identify key steps and decision points
Comprehensive review: Through team discussions, meeting minutes, document review, etc., comprehensively review all key steps and decision points to ensure that nothing is missed, especially those that have a significant impact on the process results.
Prioritization: Prioritize key steps according to their importance and urgency. This helps to highlight the key points in subsequent design and makes the flowchart more intuitive and easy to understand.
3. Determine flow direction and sequence
Logical analysis: In-depth analysis of the logical relationship between steps to ensure the coherence and rationality of the process. Avoid logical jumps or loops and ensure that each step has clear preconditions and postconditions.
Path optimization: Consider the bottlenecks and redundant links in the process, optimize the process path by merging, simplifying or reordering, and improve overall efficiency.
4. Consider the user perspective
Role analysis: Identify the target audience of the flowchart, including their background, skills, and needs. This helps design a flowchart that meets the user's cognitive habits and expectations.
Design for usability: Use standardized symbols, concise language, and clear layout to ensure that the flowchart is easy to understand. Consider adding comments, tips, or help documents to help users get started quickly.
5. Feedback and iteration
During the design process, team members or target users are encouraged to provide comments and suggestions. Through continuous iteration and optimization, the flowchart can be closer to actual needs.
1. Avoid making the flowchart too complex. Too many branches and details will confuse the reader. Show the core path first, and provide details in the form of appendices or notes .
2. Lack of consistency
Maintaining consistency in symbol usage, color coding, font size, etc. will enhance the readability and professionalism of your chart.
3. design
is completed, invite team members or target users to review it, collect feedback and make necessary adjustments accordingly. Flowchart is an iterative optimization process.
4. Ignoring details:
Important steps’ prerequisites, responsible persons, expected time and other details should not be omitted, as these details are crucial for the executors.
There are many tools for drawing flowcharts. You can choose hand-drawing, which is suitable for quick and simple prototyping. It can be completed with pencils, paper and colored pens . However, the hand-drawn version is not suitable for colleagues and customers to view. It is recommended to use the computer to draw. You can choose desktop software, such as Visio, which is powerful and suitable for complex flowcharts. You can also choose some online flowchart makers, such as Lucidchart, Draw.io, ProcessOn, etc., which are convenient for team collaboration and version control.
Here we mainly introduce how to use ProcessOn to design a flowchart.
1. Create a flowchart
First, open the ProcessOn official website, enter the personal file page, and click New to create a flowchart .
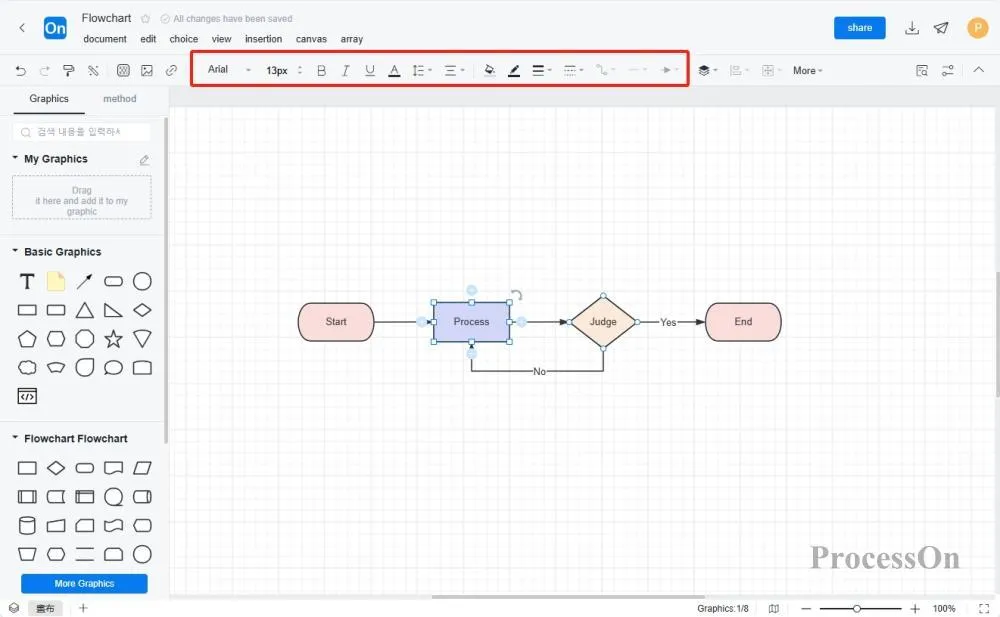
2. Create a basic framework Drag
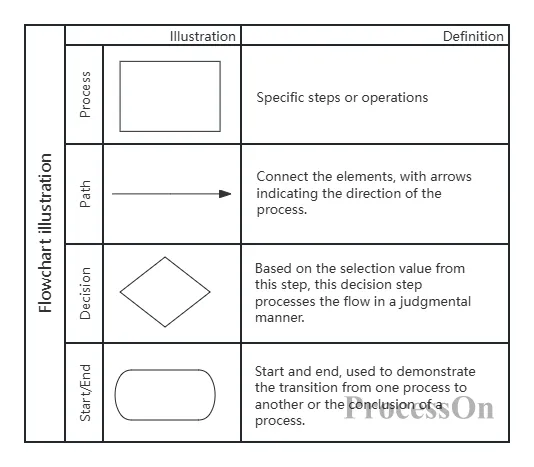
a graphic from the graphic library on the left side of the flowchart maker to the canvas, double-click the graphic to add text, and click the "+" on the graphic to create lines to connect different processes. Use right-angled rectangles to represent start and end points, rounded rectangles to represent steps or decision points, parallelograms to represent judgments , and arrows to indicate the direction of the process.
3. Fill in the content
Double-click inside the shape to add a brief description, making sure each step or decision point is self-explanatory. Remember to use clear and concise language.
4. Add colors and icons
Select the graphic and the top toolbar supports adjusting the color, font and layout . Use colors to distinguish different types of steps or emphasize key paths, and use icons to increase visual appeal while maintaining an overall unified style.
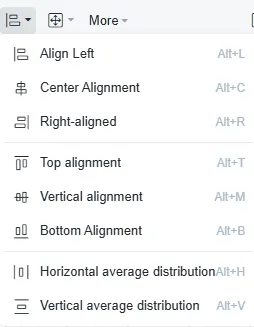
5. Typesetting and layout
After completing the content of the flowchart, you can typeset and layout it to make the flowchart more readable. Select multiple graphics and use the top toolbar or right-click the graphics to quickly distribute and align them.
6. After completing the first draft, check for logical errors, missing information, or redundant steps. Adjust the layout, color, text size, etc. based on the feedback until the best effect is achieved .
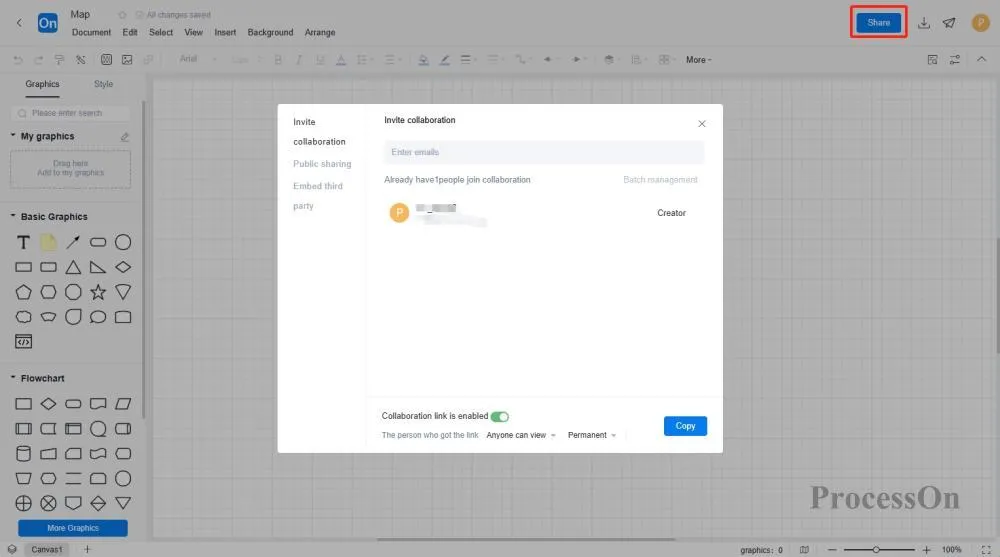
7. Export and share
Select the appropriate format (such as PDF, PNG) to export the flowchart as needed, which can be inserted into corporate documents and shared with team members. You can also share the flowchart directly with colleagues or customers for them to view or edit online.
The ProcessOn template community contains a variety of flowchart templates for reference in multiple industries, and supports cloning to improve drawing efficiency. The following are some templates for sharing.

Software development flow chart (Lane chart)
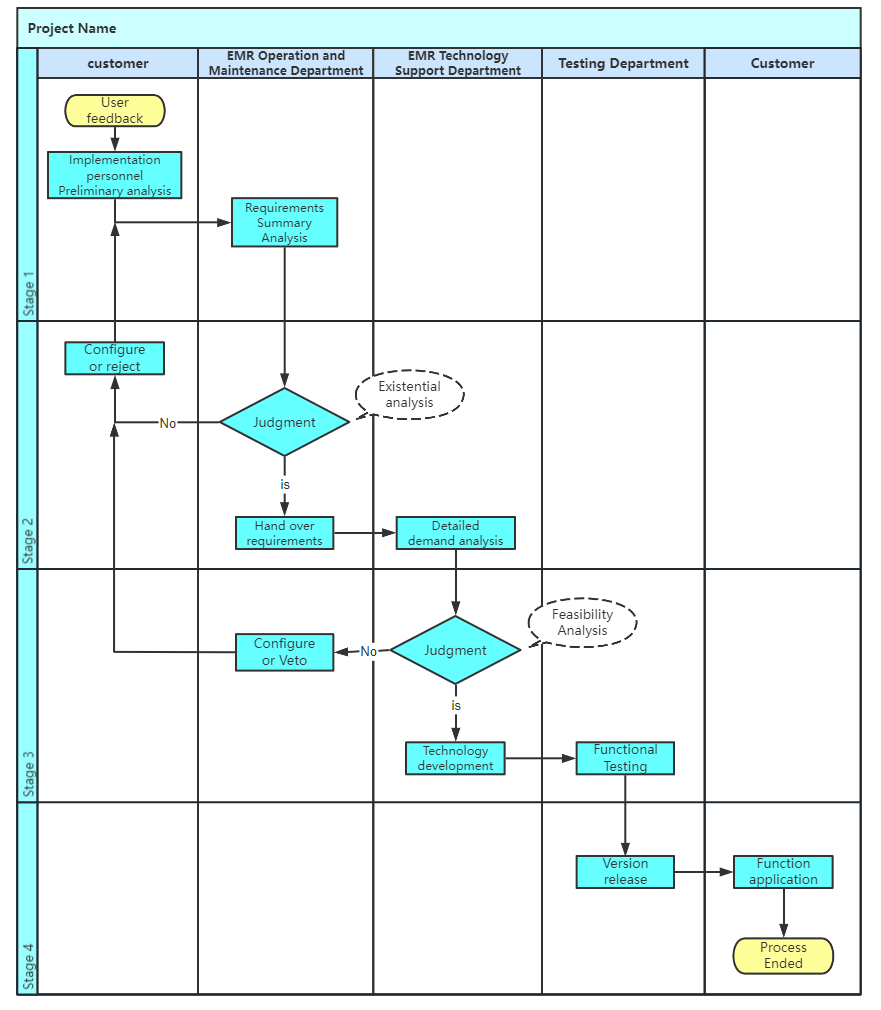
Cross-departmental requirement ments analysis process design diagram
By following the above steps, you will be able to design a flowchart that is both logical and easy to understand, effectively promoting communication and collaboration among teams and improving work efficiency.