Process Type
Graphical expression
Mind Type
Structured expression
Note Type
Efficient expression
Treemap
Bracket Diagram
Default Mode


In today's increasingly competitive legal services market, a lawyer's professional competence is reflected not only in their familiarity with legal provisions, but also in their ability to clearly and efficiently communicate complex case facts and logical relationships to judges, clients, and colleagues. Litigation visualization—presenting case facts, legal relationships, and legal procedures in graphical form—is becoming one of the core competencies of lawyers.
Legal services are highly logical and operational. Lawyers need to list and integrate the important elements of a case to determine the relationships between them, ultimately creating timeline diagrams, subject relationship diagrams, and legal relationship diagrams. Based on a comprehensive understanding of the case facts, these diagrams highlight the disputed facts and clarify the logical structure of the case. These seemingly insignificant diagrams can help lawyers quickly establish a consensus and narrow down the focus of contention when communicating with law enforcement agencies.
In legal practice, the four most commonly used visualizations are: case timelines, legal relationship diagrams, case flowcharts, and equity structure diagrams. Each of these four types of diagrams has its own focus, covering the entire case-handling chain from fact-finding to legal analysis, from procedural progression to business structure. We will break them down one by one below.
A case timeline is the most basic and commonly used chart tool for lawyers. It arranges key events in a case in chronological order, connecting scattered time points in the case file into a clear storyline.
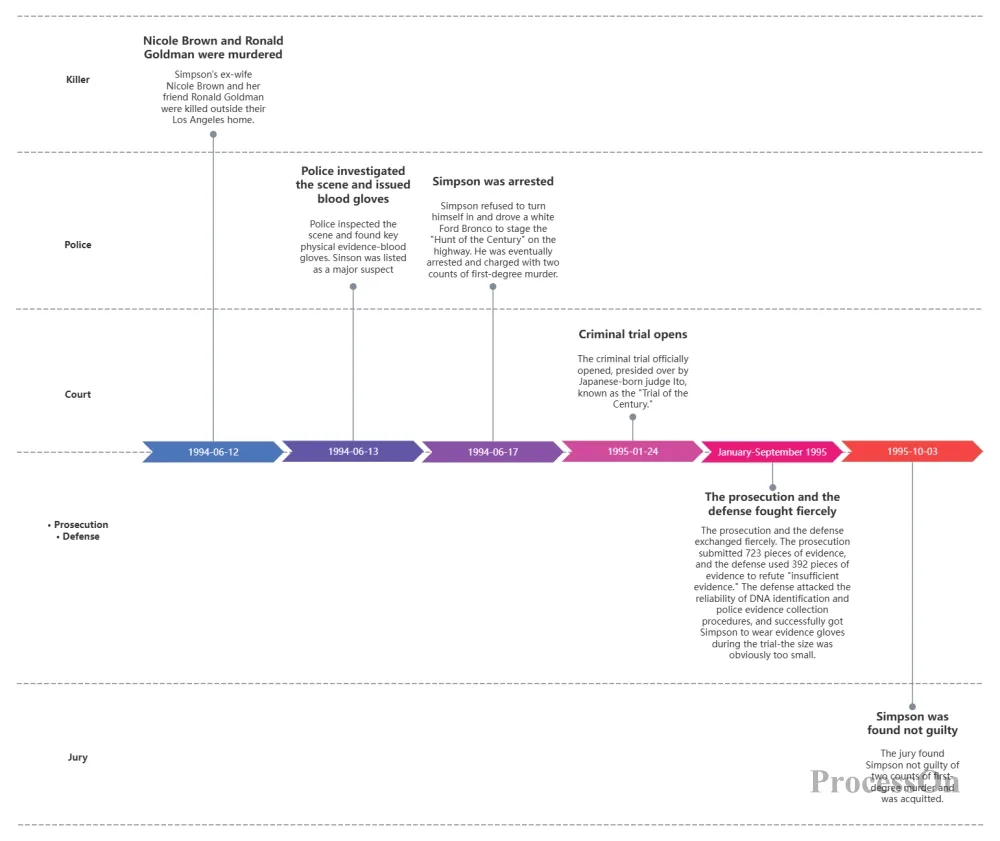
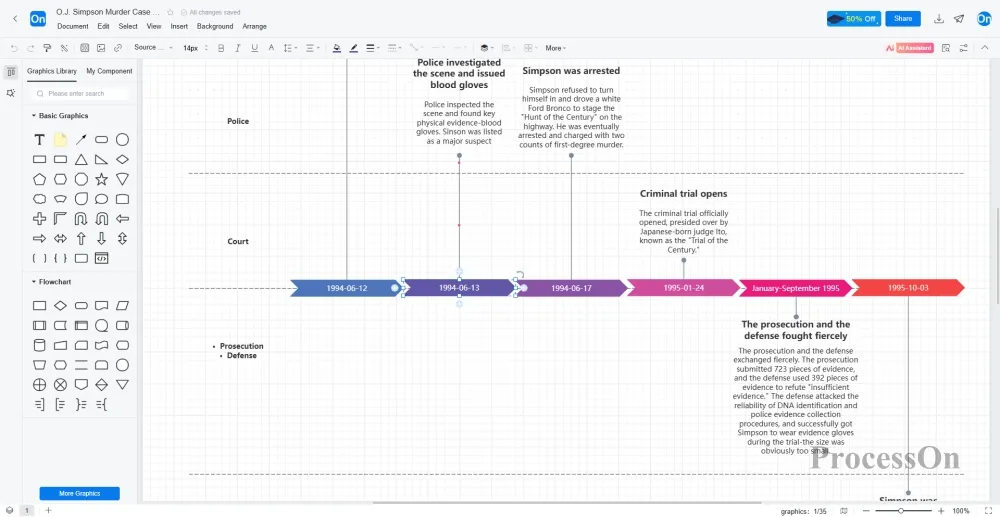
Timeline of the OJ Simpson murder case
For cases spanning a long period, simply presenting timelines and events in text is insufficient to create a complete picture in one's mind. This necessitates the creation of a visual timeline. The value of a timeline lies in three aspects:
First, reconstruct the full picture of the case. Mark the time and events on the upper and lower spaces of the timeline according to the chronological order of occurrence, list, classify and compare the facts of the case, and use different colored lines and frames to represent similar events, so that complex cases can be made clear at a glance.
Second, identify key milestones. A timeline helps lawyers clearly see the starting point and cause of a case, the sequence of events and background, the points of contention and breach of contract, and instances of interruption of the statute of limitations.
Third, organize supporting evidence. The timeline is in the middle, with the left and right ends representing the facts and evidence areas—the left side records one's own actions and evidence, and the right side records the opposing party's actions and evidence. During the process of organizing, promptly mark the evidence that needs to be collected and refuted to avoid omissions.
The core principle of drawing a timeline is to present it in layers, using time as the guiding thread. The specific steps are as follows:
Step 1: Organize all timelines. Extract all timelines related to the case from the case file, including key dates such as contract signing, performance, breach of contract, and interruption of the statute of limitations.
Step 2: Divide the timeline by subject. First, separate the different timelines by the subjects involved (such as the employer and contractor, or the contractor and the actual builder). Then, arrange the facts of the case on each timeline in chronological order. This will help to better clarify the legal relationships between the subjects.
Step 3: Vertical spatial division. Make reasonable use of the upper and lower sections of the timeline to arrange different case facts in a layered layout. For example, the plaintiff's actions can be labeled at the top, and the defendant's actions at the bottom; or the legal facts can be labeled at the top, and the corresponding evidence can be labeled at the bottom.
Step 4: Mark key information. Use different colors to distinguish between events involving different subjects or of different natures, and add brief explanations and legal basis next to key points.
If a timeline answers "when did something happen?", a legal relationship diagram answers "who and what is the relationship between them?"
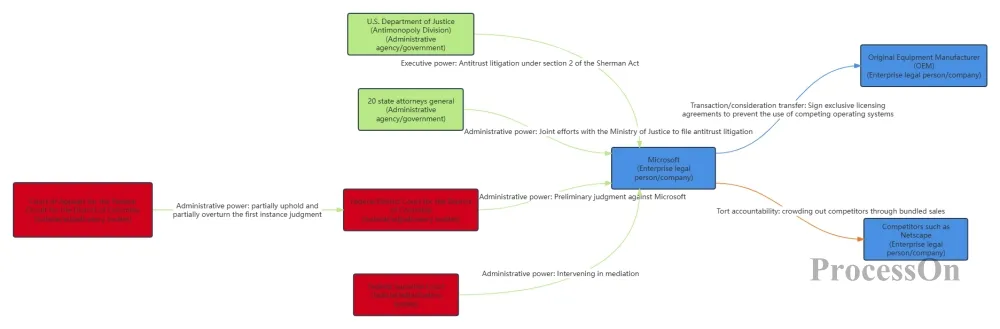
Microsoft Antitrust Legal Relationship Diagram
Legal relationships are the first thing a lawyer needs to determine after receiving case files. Only by starting with legal relationships can the related legal subjects and legal acts be accurately analyzed. The value of a legal relationship diagram lies in:
First, it penetrates complex inter-party relationships. When a case involves multiple parties (such as companies, banks, and individuals), a legal relationship diagram can clearly present the rights and obligations between the parties.
Second, accurately pinpoint the focus of the dispute. By drawing a legal relationship diagram, lawyers can quickly identify which pair of legal relationships is the core of the dispute, thus concentrating their efforts on offense and defense.
Third, it helps judges understand the case. When faced with complex cases, a clear diagram of relationships is often more persuasive than lengthy explanations.
The key to drawing a legal relationship diagram is to express the most accurate relationships using the simplest graphics. Specific suggestions are as follows:
First, use color to distinguish the main parties. In a legal relationship diagram with multiple parties, use color rather than shape to distinguish the different parties. The most basic shape—a rectangle or a rounded rectangle—is sufficient.
Second, indicate the nature of the relationship. Mark the type of legal relationship (such as "sales contract relationship", "guarantee relationship", "agency relationship") on the lines connecting the main parties, and indicate the legal basis when necessary.
Third, use a layered approach. For cases involving multiple layers of legal relationships (such as financing trade under the penetrating trial approach), a hierarchical diagram can be used to unfold the case layer by layer from top to bottom.
Fourth, keep it simple. The core purpose of charts is to "simplify"—to present complex and cumbersome facts and relationships in the most intuitive way .
The timeline focuses on "what happened," the legal relationship diagram focuses on "what the relationship is between the subjects," and the case flowchart focuses on "how the procedure proceeds."
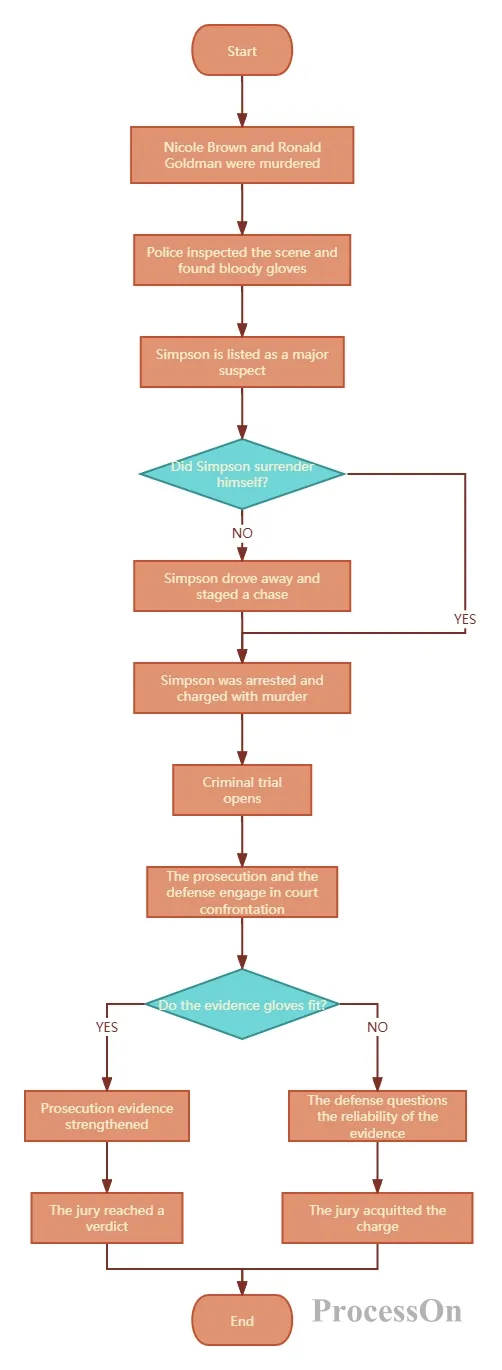
OJ Simpson murder case flowchart
In litigation and enforcement proceedings, procedural issues often determine the course and outcome of a case. The value of flowcharts lies in:
First, it clearly displays the procedural steps. Whether it's a litigation process, an enforcement process, or an administrative approval process, flowcharts can present complex procedural steps in a visual way.
Second, identify procedural vulnerabilities. By using flowcharts to outline the procedures stipulated in policy documents and the responsible persons for each step, lawyers can quickly pinpoint key nodes and potential risks in the process .
Third, charts can aid in pre-trial communication. Charts can help lawyers quickly define the scope of consensus and narrow down the points of contention during communication with law enforcement agencies .
The core of creating a flowchart is to recreate the actual process and mark key nodes. Taking a tax crime case as an example, the lawyer's approach is as follows: first, determine and solidify the process, responsible persons, and responsible units stipulated in the policy documents; then, analyze the defendant's role and status in the process; and finally, comprehensively consider other evidence to determine whether a crime has been committed .
When drawing the actual diagram, the following suggestions are made:
Step 1: Determine the start and end points of the process. Clarify which stage of the process you want to demonstrate (e.g., "from case filing to judgment" or "from contract signing to performance completion").
Step 2: Decompose the intermediate steps. Break down the process into several standard steps, each represented by a rectangle.
Step 3: Mark the decision nodes. Use diamond boxes to represent the branch points that need to be judged or selected.
Step 4: Identify the responsible person/unit. Next to each step, indicate who is responsible, what materials are needed, and what the time requirements are .
Step 5: Verify the completeness of the process. Compare the flowchart with relevant laws, regulations, and policy documents to ensure that each step is based on sound principles and that nothing is omitted .
Equity structure diagrams are an indispensable tool for lawyers in non-litigation matters (especially mergers and acquisitions, due diligence, and equity incentives). While the first three diagrams primarily serve litigation matters, equity structure diagrams play an irreplaceable role in commercial transactions.
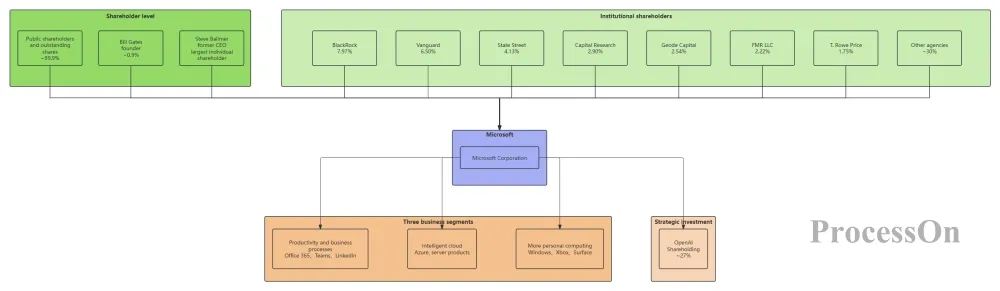
Microsoft's equity structure diagram
First, examine the equity structure to understand the control relationships. Lawyers should review business registration information, shareholder registers, equity agreements, and other documents to clarify the equity distribution of the target company and its subsidiaries, including the shareholding ratio of each shareholder, the time and method of equity acquisition , etc.
Second, identify related-party transactions and transfers of benefits. Shareholding structure diagrams can help lawyers uncover related-party relationships and potential conflicts of interest hidden behind multiple layers of shareholding.
Third, support the design of the transaction structure. To facilitate subsequent work, lawyers should draw up an equity structure diagram, clearly showing the hierarchical relationship between the target company and its subsidiaries and holding companies, as well as the relationships between the various shareholders, laying the foundation for subsequent transaction structure analysis .
Fourth, it assists in dispute resolution. In enforcement cases, organizing the equity structure of the judgment debtor's shareholders and creating an equity structure diagram is an important step in reconstructing the flow of funds and uncovering the facts to be proven.
The key to drawing a shareholding structure diagram is to unfold it layer by layer according to the shareholding levels:
Step 1: Identify the target company. Use the target company as the core node in the chart.
Step 2: Going upwards. Identify the target company's direct and indirect shareholders layer by layer, down to the ultimate natural persons or state-owned entities.
Step 3: Expand downwards. If the target company has subsidiaries, sub-subsidiaries, or affiliated companies, these should also be shown in the diagram, indicating the shareholding percentages .
Step 4: Label key information. Label key information such as shareholding ratio, investment method, and acquisition time next to each shareholder node .
Step 5: Differentiate control relationships. Use different colors or lines to distinguish different relationship types such as "controlling stake", "shareholding", and "contractual control".
All four types of charts can be created using the ProcessOn charting tool.
Open the ProcessOn website, go to your personal file page, and create a flowchart;
Drag and drop graphics from the left-hand graphics library onto the right-hand canvas to fill the chart content. Select a graphic, and you can adjust the chart content, layout, style, etc. in the top toolbar.
Once completed, the drawing can be shared with colleagues or clients for real-time viewing or modification. It can also be exported in various formats such as high-definition images, PDFs, and SVGs, and inserted into legal documents, court hearing PPTs, or printed and submitted to judges.
The key to litigation visualization lies not in what software you use, but in clearly presenting elements such as the parties involved, legal relationships, and timeline by exploring legal facts and clarifying legal relationships. Even if you don't know any software, drawing on paper is sufficient as long as the diagram accurately and persuasively expresses the facts.
Of course, specialized tools can make this process much more efficient. Timelines help you reconstruct the facts, legal relationship diagrams help you clarify rights and obligations, flowcharts help you control procedural nodes, and equity structure diagrams help you understand the business structure. Each of these four diagrams serves a specific purpose, together forming a complete analytical framework for lawyers, from facts to law, from procedure to business.
Whether you are a young lawyer just starting out or a seasoned veteran, mastering these four charting tools will make your case-handling ideas clearer, your communication more powerful, and your professional image more trustworthy.