Process Type
Graphical expression
Mind Type
Structured expression
Note Type
Efficient expression
Treemap
Bracket Diagram

Default Mode





One of the biggest changes in the restaurant industry over the past decade has been the shift in customer acquisition methods. Initially, it relied on location; later, on platforms; and now, it increasingly relies on content. Content has brought more hidden gems to the forefront, and it has also significantly reduced the cost for customers to discover a new restaurant. However, this change has also brought a fatal problem—more and more people are treating three things as one: gaining attention, generating transactions, and achieving repeat purchases.
Traffic is not business. At most, traffic is the door you push open before you enter the world of business.
So here's the question: In a shrinking market where everyone is fighting for survival, what can restaurant owners rely on to win?
The answer might be simpler than you think—rely on a system, not intuition. Visualize marketing through charts, transforming strategies from guesswork into a structured, executable, and retrospective system.
Many restaurant owners rush to launch events, promotions, and invite online influencers to visit their restaurants, but they neglect the most basic step—understanding their own position.
SWOT analysis is the most basic and practical diagnostic tool. Draw a 2x2 matrix diagram, clearly filling in the four quadrants:
Strengths: What makes your restaurant stand out from the competition? Is it consistent quality, fresh ingredients, or a good location? Don't just write empty phrases like "good service"—be specific, such as "table turnover rate is 20% higher than other restaurants in the same business district" or "signature dishes have a 65% repurchase rate."
Weaknesses: Where are your weaknesses? Is it low brand awareness, weak online operation capabilities, or awkward average pricing per user? Honestly facing your shortcomings is a prerequisite for developing effective strategies.
Opportunities: What opportunities are there in the external environment? The demand for community catering is growing, new office buildings in the surrounding area are being leased, and food delivery platforms have introduced new policies to support new brands—these are all opportunities.
Threats: What's threatening you from the outside? A new restaurant of the same type has opened nearby, ingredient costs are rising, and platform commissions are getting higher and higher.
After completing this diagram, you will have a clear understanding of your position. The most crucial step in SWOT analysis is cross-matching—using strengths to seize opportunities (SO strategy), using strengths to defend against threats (ST strategy), improving weaknesses to seize opportunities (WO strategy), and improving weaknesses to avoid threats (WT strategy).
In ProcessOn , you can directly use the "SWOT analysis" template to generate four quadrants with one click. Each quadrant is distinguished by a different color, and you can also add comments online during team collaboration, allowing everyone to participate in the discussion.
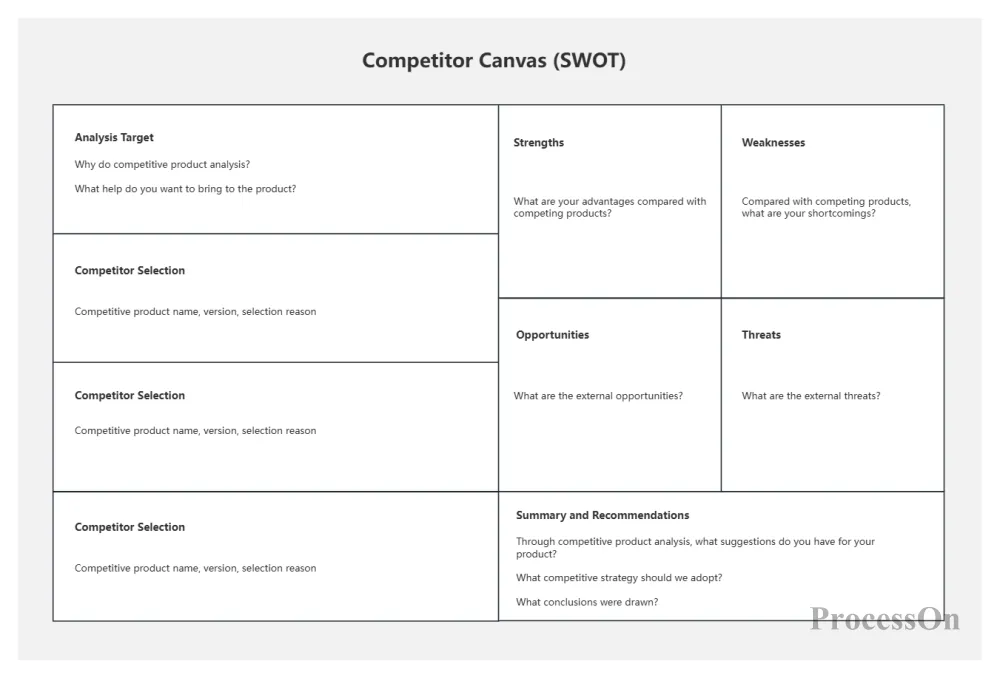
Competitive Analysis - SWOT Analysis
Once you understand yourself, you also need to understand what the "battlefield" is like.
Porter's Five Forces model is a classic tool for analyzing the competitive landscape of an industry, breaking down competitive forces into five dimensions. A Five Forces diagram can help restaurant owners systematically understand their competitive environment:
Industry competition: Who are your direct competitors? How many stores selling the same products are there on the same street? What are their respective positioning strategies?
Threat of potential entrants: The food and beverage industry has low barriers to entry, making it easy for new players to flood in. Is your product category easily replicable? A new brand can quickly enter the market with initial capital; where is your competitive advantage?
Threat of substitutes: Prepared meals, frozen foods, and food delivery platforms are all diverting demand from dine-in services. If customers don't choose you, what else can they choose?
Supplier bargaining power: Do food suppliers have the initiative in pricing? Can your purchasing scale support price negotiation?
Buyer bargaining power: Consumers can quickly compare ratings and prices of different restaurants through online platforms . Can your pricing withstand scrutiny from a "price detective"?
By plotting the analysis results from the five dimensions on the same graph, you can clearly see your true position in this industry—whether you are in a relatively less competitive niche or already fiercely competing in a red ocean.
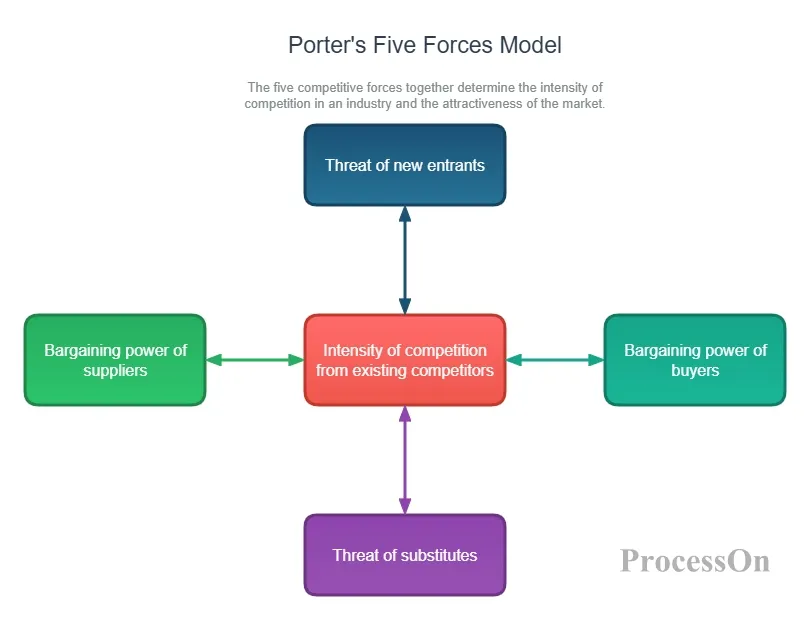
Porter's Five Forces Analysis Model
In ProcessOn , Porter's Five Forces can be quickly presented using a "matrix diagram" or "Five Forces Analysis" template. Each dimension is displayed in an independent block, accompanied by specific data and case studies, making the analysis results clear at a glance.
Once the diagnosis is clear and the battlefield is understood, the next step is to formulate a strategy.
Many restaurant owners create marketing plans by "doing whatever comes to mind"—organizing a group-buying event today, releasing a short video tomorrow, and holding a members' day the day after. They take many actions, but lack a clear focus, their resources are scattered, and the results are significantly diminished.
The correct approach is to first use a mind map to build the systematic framework of the marketing plan.
Take a fast-food chain that emphasizes speed and health as an example, positioning itself as a "daily meal" for urban commuters. A marketing mind map can be developed from the following dimensions:
Brand positioning: What exactly is your restaurant selling? Is it "freshly made" or "highly nutritious"? Positioning determines all subsequent marketing actions.
Product strategy: What are the signature products? What are the traffic-driving products? What are the profit-generating products? The product structure determines the average order value and repurchase rate.
Pricing Strategy: The current market trend is towards more rational average order values. The core competitiveness of fast food lies in "value for money"—offering competitive prices while ensuring quality. Does your pricing align with this trend?
Channel strategy: Offline stores , food delivery, digital channels , partner channels —a multi-channel revenue structure is no longer a bonus, but a survival necessity. What are the goals for each channel? How should resources be allocated?
Promotion strategy: Content creation is now the most crucial way to attract customers. Should we focus on short video platforms or social media? Should we create restaurant review content or brand-specific content? How should we allocate our budget?
Membership and repeat purchases: Traffic is just the first step. Without repeat purchases, traffic retains no value. How should you design your membership system? How do you reactivate existing customers?
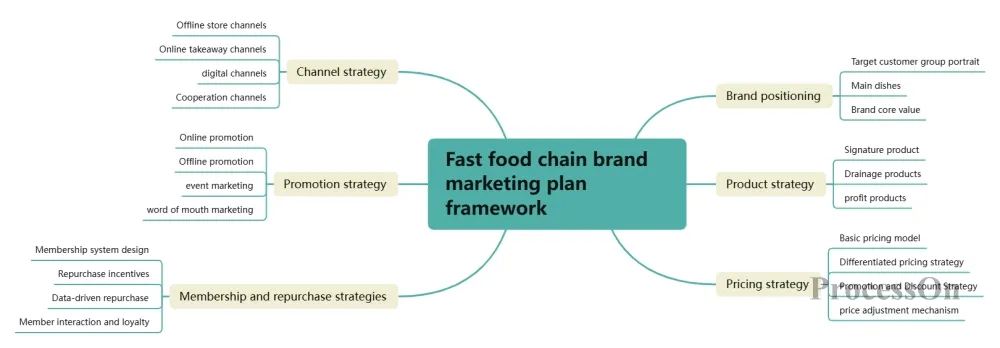
Fast food chain brand marketing plan framework
Once you've drawn this mind map, you'll have a complete marketing framework. The next step is to implement the content of each branch one by one—instead of doing whatever comes to mind today.
In ProcessOn , mind mapping is a natural tool for strategic planning. It expands outwards from a central theme, layer by layer, with each branch further refined into specific action items. Different colors can be used to distinguish different modules, making the entire map clearly structured.
With strategies in place, many restaurant owners are facing a new problem: the strategies are on paper but cannot be put into practice.
No matter how well-written the plan is, it will still be a mess when it is executed—who is responsible for what, when to complete it, and how to deal with problems all depend on improvisation.
What's needed at this point is a flowchart .
Take "a TikTok store visit event" as an example:
Step 1: Event Planning – Determine the objectives (customer acquisition or user activation?), budget, key opinion leaders (KOLs), and content direction.
Step 2: Content creation – Influencer filming, script communication, video editing, review and release.
Step 3: Launch the event – Video release, comment section guidance, group buying link listing, customer service preparation.
Step 4: Conversion and Implementation – In-store verification process, peak-hour traffic diversion plan, and customer experience management.
Step 5: Data review – exposure, click-through rate, redemption rate, repurchase rate, return on investment.
Draw a flowchart of these five steps, label each step with the person in charge and the deadline, and set decision boxes for key nodes—"Has the redemption rate met the target?" "Have the negative reviews exceeded the threshold?"—and the execution of the entire activity will have a clear path.
The same method can be applied to any marketing campaign: member day events, new product launches, holiday promotions... Once the flowchart is drawn up, the execution will not go astray.
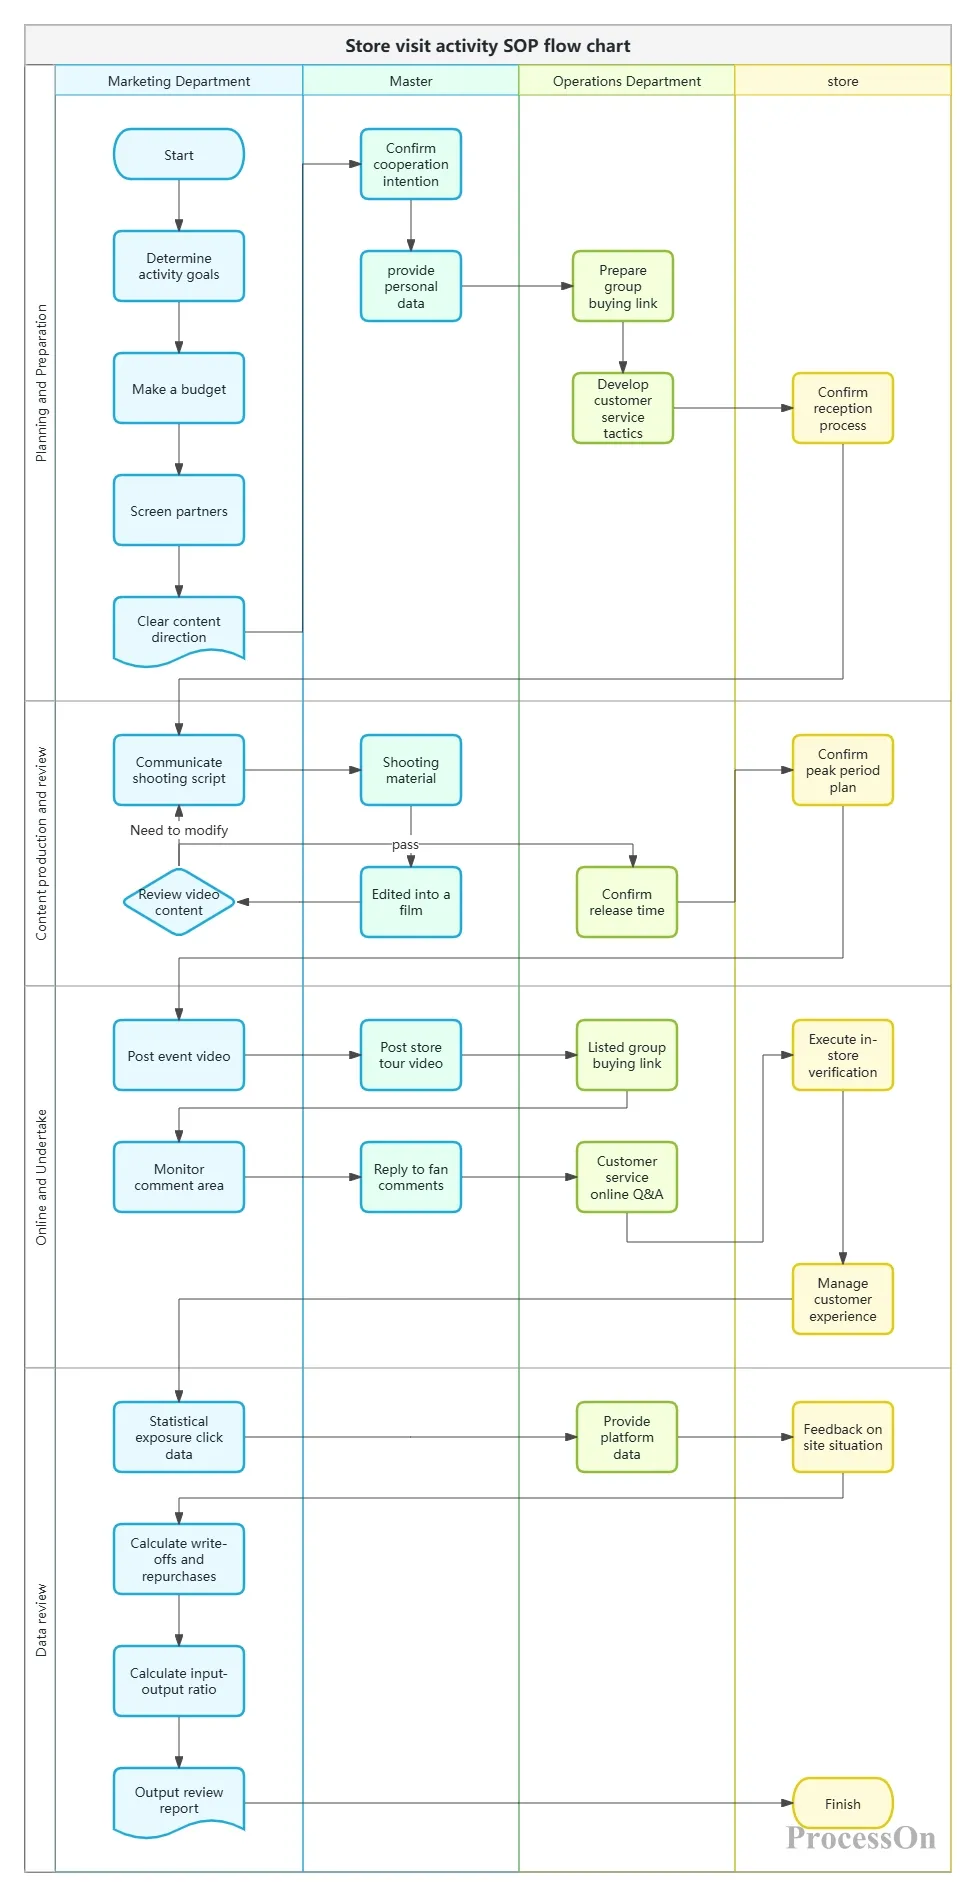
TikTok Store Visit Activity SOP Flowchart
In ProcessOn , flowcharts support drag-and-drop operation, with nodes automatically snapping together. You can add notes to each node—labeling the responsible person, timeline, and important notes. Completed flowcharts can be exported as PNG or PDF and shared directly with the team, ensuring everyone has a consistent understanding of the execution path.
The marketing campaign is over, but that doesn't mean the work is done. An campaign without a post-campaign review is essentially a waste of time.
Many restaurant owners operate on a "whatever happens, happens" logic, relying entirely on gut feeling for the success of their promotions—if it goes well, they'll continue; if not, they'll try a different approach. This "gut feeling" approach might work in an era of rapid growth, but in a market where competition is fierce, it's suicidal.
The correct approach is to let the data speak for itself.
Set up a simple marketing data dashboard to track the following key metrics:
New customer acquisition metrics: percentage of new customers, customer acquisition cost, and distribution of customer acquisition channels.
Conversion metrics: in-store redemption rate, average order value, and cross-selling rate.
Retention metrics: repurchase rate, member activity, churn rate.
Efficiency metrics : return on investment, marketing expense ratio, and cost per customer.
By visualizing this data using charts such as bar charts, line charts, and funnel charts, you can clearly see which channels are most effective, which types of activities have the highest ROI, and which aspects need the most optimization.
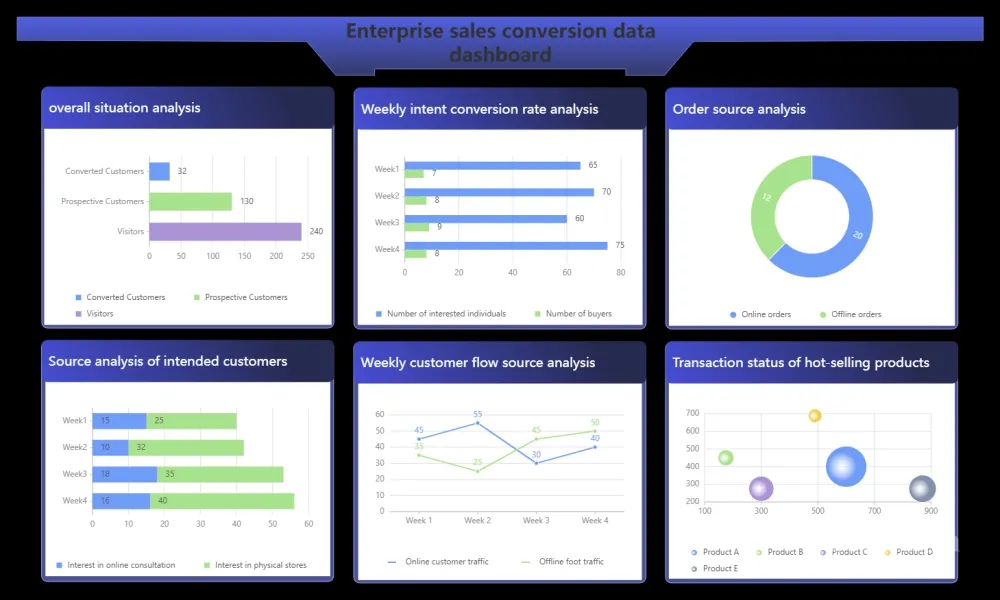
Marketing decisions without data support are essentially gambling. Data-driven decisions, even if wrong, allow you to quickly identify "where you went wrong," enabling you to do better next time.
The catering industry is undergoing a profound transformation. The old methods of achieving scale growth through store expansion, leveraging customer traffic, and low-price promotions are no longer effective. The industry's growth logic, competitive logic, and survival logic are being systematically restructured.
Under this new logic, restaurant marketing is no longer about who shouts the loudest, but about who has the more complete system.
From SWOT analysis to Porter's Five Forces, from mind maps to flowcharts, from data dashboards to debriefing mechanisms—these charts may seem simple, but they constitute a complete marketing decision-making system. They help you transform "vague feelings" into "clear paths" and "gut feeling decisions" into "evidence-based judgments."
In this era of "fast birth and fast death," the ability to think systematically may be the key variable for a restaurant to survive the average 15-month lifespan.
So next time you're creating a marketing plan, don't rely solely on "gut feeling." Open ProcessOn , first draw a SWOT analysis to understand your position, then draw a Porter's Five Forces diagram to understand the battlefield, then use a mind map to systematically list your strategies, and finally use a flowchart to clearly illustrate the execution path.
When you "draw out" marketing, you'll find that your previously chaotic thoughts suddenly become clear.
Yes. ProcessOn has a built-in AI function; simply enter "Generate a restaurant marketing SWOT analysis" and it will automatically generate a draft. A vast library of templates are available for direct use, requiring no drawing skills.
Yes. You can find ready-made templates by searching for "restaurant marketing," "SWOT," or "Porter's Five Forces" in template communities. You can directly clone and use them, saving you the time of building from scratch.
No. It supports multiple users editing online simultaneously, the cursor position is visible in real time, all changes are synchronized in real time, and it saves automatically, eliminating the need to repeatedly transfer files.
Yes. It supports exporting to PNG, JPG, PDF, SVG and other formats, and can be directly inserted into PPT, Word and other document tools for seamless integration into reporting scenarios.
Simply generate a shareable link; the recipient can view it without registration. Viewing and editing permissions can be set, ensuring security and control.