Process Type
Graphical expression
Mind Type
Structured expression
Note Type
Efficient expression
Treemap
Bracket Diagram

Default Mode





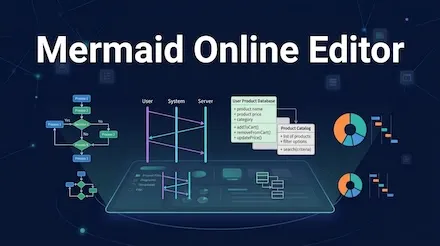
Mermaid is a tool that generates diagrams from text-based syntax. By writing simple Mermaid code, you can create flowcharts, sequence diagrams, class diagrams, state diagrams, ER diagrams, Gantt charts, mind maps, architecture diagrams, and many other diagram types.
Unlike traditional drag-and-drop drawing tools, Mermaid describes the nodes, relationships, chronological order, and data structures in a diagram mainly through code. When you change the code, the diagram is regenerated automatically, which makes Mermaid especially well suited to technical documentation, product design, project management, software development, and knowledge organization.
This article introduces Mermaid's basic syntax and rounds up the Mermaid diagram types that the editor can render, together with their declaration syntax, code examples, and use cases. If you want to write and preview Mermaid code online, you can try the free ProcessOn Mermaid Online Editor.
Mermaid is a tool that generates diagrams using text syntax. The code below generates a simple Mermaid flowchart:
flowchart TD
A[Start] --> B[Enter information]
B --> C{ Completed?}
C -->|Yes| D[End]
C -->|No| B
The rendering result is as follows:
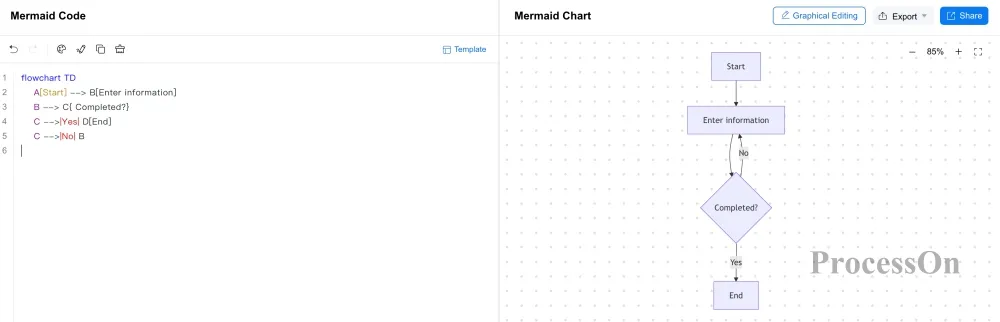
Here: flowchart TD declares a flowchart arranged from top to bottom.
Mermaid's operating logic can be summarized as:
Write Mermaid code → parse the code → render the diagram → modify the code → the diagram updates in real time
So one of the keys to learning Mermaid is understanding the declaration syntax used by each diagram type.
Different diagram types use different Mermaid declaration syntax, and the most common Mermaid diagrams include:
| Diagram type | Mermaid declaration syntax | Common uses |
| Flowchart | flowchart | Business processes, algorithms, workflows |
| Sequence diagram | sequenceDiagram | System interactions, API calls |
| Class diagram | classDiagram | Software structure, object-oriented modeling |
| State diagram | stateDiagram-v2 | State transitions, state machines |
| ER diagram | erDiagram | Database entity relationships |
| Gantt chart | gantt | Project planning, task progress |
| User journey diagram | journey | User experience, customer journeys |
| Mind map | mindmap | Knowledge organization, brainstorming |
| Timeline | timeline | Timelines, historical events |
| Pie chart | pie | Proportions, composition analysis |
| Quadrant chart | quadrantChart | Classification, prioritization, positioning analysis |
| Git graph | gitGraph | Git branches, commits, merges |
| Sankey diagram | sankey-beta | Data, resource, and traffic flows |
| XY chart | xychart-beta | Data trends, value comparisons |
| Radar chart | radar | Multi-dimensional metric comparison |
| C4 diagram | C4Context, etc. | Software architecture modeling |
| Architecture diagram | architecture-beta | System, service, and resource architecture |
| Kanban diagram | kanban | Task and work status management |
| Block diagram | block-beta | Module, structural, and system relationships |
| Packet diagram | packet-beta | Network packet structure |
| Requirement diagram | requirementDiagram | Requirements analysis and requirement relationships |
Different Mermaid editor versions may support different syntax and features for diagrams, so in practice you should go by the syntax that your editor supports.
Basic syntax
Mermaid uses the flowchart declaration to create a flowchart. The simplest form is:
flowchart TD
A[Start] --> B[Arrange]
B --> C[End]
render Result
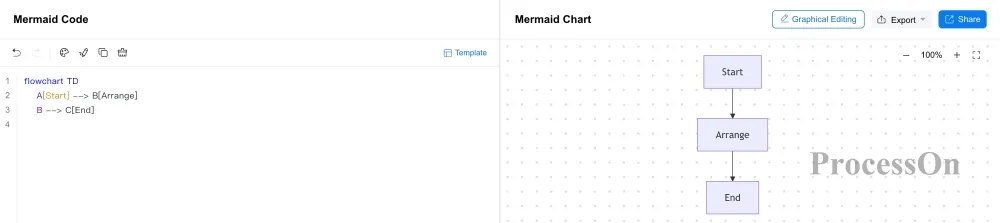
Where:
Mermaid flowcharts can also use LR (left to right), RL (right to left), BT (bottom to top) and other direction settings. For example:
flowchart LR
A[Start] --> B[Arrange] --> C[End]
means Flowchart it is laid out from left to right.
Common syntax
| Syntax | diagrams | Meaning |
| (text) | Rounded rectangle | Represents the start, end, or a general operation of a process |
| [text] | Rectangle | Represents a specific step, task, or processing operation |
| {text} | Diamond | Represents a decision or conditional branch |
| ((text)) | Circle | Represents a connection point or event |
| [[text]] | Double rectangle | Represents a call to a subprocess or submodule |
| [(text)] | Cylinder | Represents a database node |
| >text] | Asymmetric shape | Represents input/output |
| [/text/] | Parallelogram | Represents input or output data |
| --> | Arrow | Represents the direction of the process |
| --- | Line without an arrow | Represents an association relationship |
| -.-> | Dashed arrow | Represents an optional flow or a reference relationship |
| ==> | Thick arrow | Represents a key flow or a strong association |
For the detailed syntax for generating flowcharts with Mermaid, see the page below: https://www.processon.io/mermaid/flowchart
Flowcharts are well suited to business processes, workflows, algorithm flows, system flows, and decision flows, and you can try Mermaid Online Flowchart Editor.
Basic syntax
Mermaid uses the sequenceDiagram declaration to create a sequence diagram. The simplest example is:
sequenceDiagram
Alice->>John: Hello John
John-->>Alice: Hello Alice
Rendering result
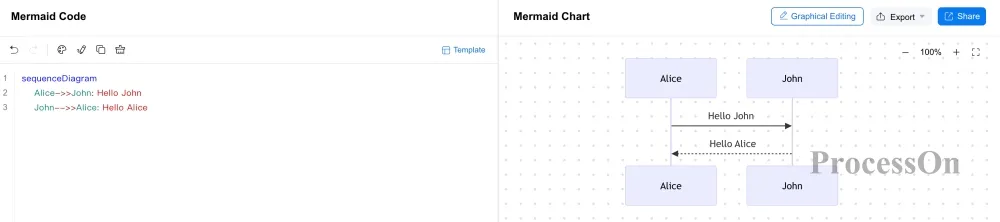
Where:
Common syntax
| Syntax | diagrams | Meaning |
| sequenceDiagram | Sequence diagram | Create a sequence diagram |
| A->B: message | Solid line | Represents a synchronous message call or an ordinary interaction |
| A-->B: message | Dashed line | Represents a return message or a weakly associated interaction |
| A->>B: message | Solid arrow | represents an asynchronous message call |
| A-->>B: message | Dashed arrow | represents an asynchronous response or return message |
| participant A | Participant | Defines the objects, roles, or systems involved in the interaction |
| actor A | Actor | Represents an active participant such as a user or an external system |
| activate A | Activation box | Represents an object starting to process a request |
| deactivate A | End activation | Represents an object finishing its current processing |
| loop text | Loop box | Represents a repeatedly executed interaction |
| alt text | Conditional branch | Represents interaction paths under different conditions |
| opt text | Optional flow | Represents an interaction that may be executed |
| par text | Parallel box | Represents multiple operations executing at the same time |
For the detailed syntax for generating sequence diagrams with Mermaid, see the page below: https://www.processon.io/mermaid/sequence-diagram
Sequence diagrams are well suited to describing interactions that take place in chronological order between users and systems, between systems, or between services, and you can try Mermaid sequence diagram online editor.
Basic syntax
Mermaid uses the classDiagram declaration to create a class diagram.
classDiagram
Animal <|-- Duck
Animal <|-- Fish
class Animal {
+String name
+eat()
}
class Duck {
+swim()
}
Rendering result
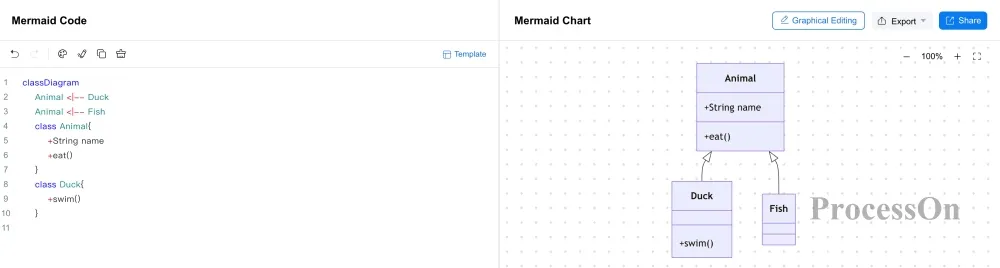
Where:
Common syntax
| Syntax | diagrams | Meaning |
| classDiagram | Class diagram | Create a class diagram |
| class ClassName | Class | Defines a class object |
| ClassName : attribute | Attribute | Represents a member variable of a class |
| ClassName : method() | Method | Defines a class method |
| <|-- | Hollow triangle+ Solid line | Represents an inheritance relationship |
| <|.. | Hollow triangle+ Dashed line | Represents an implementation relationship |
| *-- | Filled diamond+ Solid line | Represents a composition relationship |
| o-- | Hollow diamond+ Solid line | Represents an aggregation relationship |
| --> | Solid arrow | Represents an association relationship |
| ..> | Dashed arrow | Represents a dependency relationship |
| -- | Solid line | Represents a plain connection relationship |
| +attribute | Plus sign | Represents a public attribute or method |
| -attribute | Minus sign | Represents a private attribute or method |
Symbols such as +, -, and # in front of class members indicate different levels of visibility.
For the detailed syntax for generating class diagrams with Mermaid, see the page below: https://www.processon.io/mermaid/class-diagram
Class diagrams are well suited to software design, object-oriented modeling, program structure analysis, and similar scenarios, and you can try Mermaid Class diagram the online editor.
Basic syntax
Mermaid uses the stateDiagram-v2 declaration to create a state diagram.
stateDiagram-v2
state "Pending Payment" as Pending
[*] --> Pending
Pending --> Paid
Paid --> Shipped
Shipped --> Completed
Completed--> [*]
Rendering result
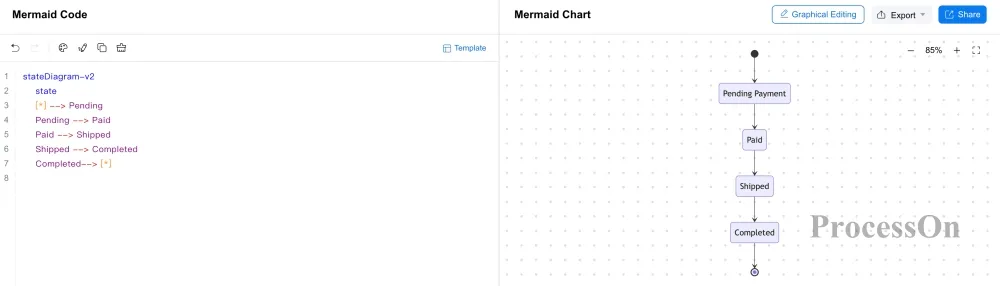
Where:
Common syntax
| Syntax | diagrams | Meaning |
| stateDiagram-v2 | State diagram | Create a state diagram |
| state StateName | Rounded rectangle | Defines a basic state node |
| state StateName : text | Rounded rectangle with text | Attaches descriptive text to a state |
| [*] | Filled dot or double circle | Represents the start or end of a state |
| [*] --> StateName | Start arrow | Represents entering the first state |
| StateName --> [*] | End arrow | Represents the end of the state flow |
| A --> B | Solid arrow | Represents a state transition |
| A --> B: event | Solid arrow with a label | A state transition with a triggering event |
| state StateName { ... } | Nested rounded rectangle | Defines a composite state |
| state Node <<choice>> | Diamond | Branch/decision selection node |
| state Fork <<fork>> | Thick horizontal divider | Represents the start of a parallel flow |
| state Join <<join>> | Thick horizontal divider | Represents the end and merge of a parallel flow |
For the detailed syntax for generating state diagrams with Mermaid, see the page below: https://www.processon.io/mermaid/state-diagram
State diagrams are well suited to representing order states, workflow states, user states, system states, and state machines, and you can try Mermaid State diagram the online editor.
Basic syntax
Mermaid uses the erDiagram declaration to create an entity relationship diagram, also known as an ER diagram.
erDiagram
USER ||--o{ ORDER : places
ORDER ||--|{ PRODUCT : contains
Rendering result
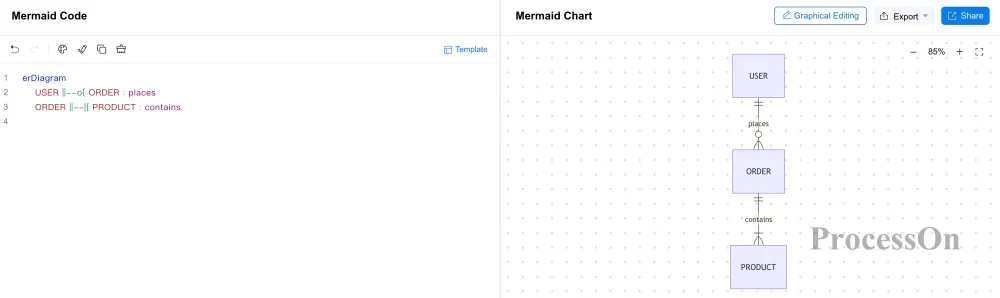
Where:
Common syntax
| Syntax | diagrams | Meaning |
| erDiagram | ER the diagram | Create a ER the diagram |
| ENTITY { } | Rectangle | Defines an entity |
| type field | Attribute marker | Defines an entity attribute |
| type field PK | Primary key | Defines an entity primary key |
| type field FK | Foreign key | Defines an entity foreign key |
| type field UK | Unique key | Defines a unique constraint field |
| || | One | Exactly one |
| o| | Zero or one | Zero or one |
| |{ | One or more | At least one |
| o{ | Zero, one, or more | Zero or more |
For the detailed syntax for generating ER diagrams with Mermaid, see the page below: https://www.processon.io/mermaid/er-diagram
ER diagrams can represent entities, attributes, and the relationships between entities, and are commonly used in database design, and you can try Mermaid online ER diagram editor.
Basic syntax
Mermaid uses the mindmap declaration to create a mind map.
mindmap
root((Mermaid))
Flowchart
Sequence diagram
Class diagram
Gantt chart
Mind map
Rendering result
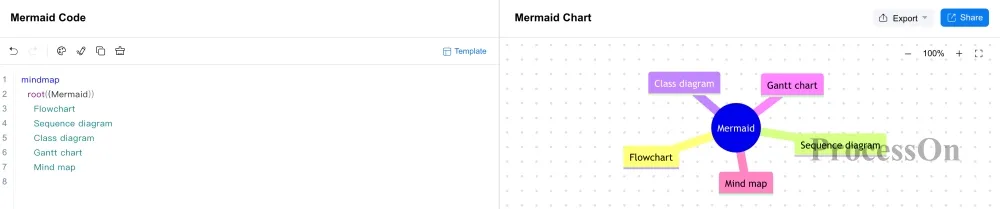
Where:
Common syntax
| Syntax | diagrams | Meaning |
| mindmap | Mind map | Create a mind map |
| root[text] | Rectangle | rectangle root topic |
| root(text) | Rounded rectangle | rounded rectangle root topic |
| root((text)) | Circle | circle root topic |
| root{{text}} | Hexagon | hexagon root topic |
| root)text( | Bubble | bubble root topic |
| [text] | Rectangle | Rectangle node |
| (text) | Rounded rectangle | Rounded rectangle node |
| ((text)) | Circle | Circle node |
| {{text}} | Hexagon | Hexagon node |
| )text( | Bubble | Bubble node |
For the detailed syntax for generating mind maps with Mermaid, see the page below: https://www.processon.io/mermaid/mindmap
Mind maps express hierarchy mainly through indentation, so they are ideal for knowledge organization, brainstorming, course notes, and information architecture, and you can try Mermaid online Mind map editor.
Basic syntax
Mermaid uses the gantt declaration to create a Gantt chart.
gantt
title Project Plan
dateFormat YYYY-MM-DD
section Design
Requirements Analysis:a1, 2026-01-01, 3d
UI Design:after a1, 2d
section Development
Front-end Development:2026-01-06, 4d
Back-end Development:2026-01-07, 4d
Rendering result
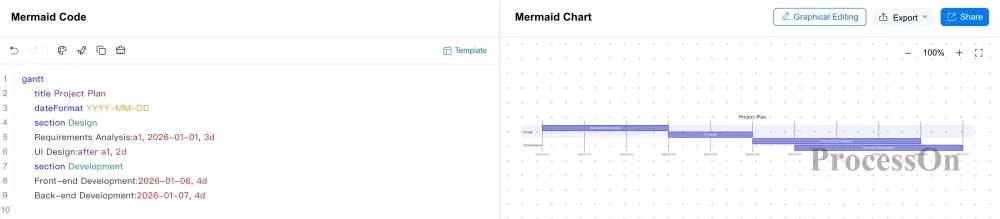
Where:
Common syntax
| Syntax | diagrams | Meaning |
| gantt | Gantt chart | Create a Gantt chart |
| title text | Title | Sets the Gantt chart title |
| dateFormat text | Date configuration identifier | Defines the date parsing format for the timeline |
| section text | Grouped color-block header row | Divides task groups |
| TaskName : id, startDate, endDate | Horizontal task bar | Defines the task's properties |
| startDate | Horizontal task bar | Defines the start time |
| endDate | Horizontal task bar | Defines the end time |
| duration | Horizontal task bar | Defines the task duration |
| id | Custom | Defines the task ID |
| after id | Horizontal task bar | Defines a task that starts after its predecessor |
| 16d, 2w | Horizontal task bar | Represents days or weeks |
| milestone, date | Filled diamond | Sets a milestone marker |
For the detailed syntax for generating Gantt charts with Mermaid, see the page below: https://www.processon.io/mermaid/gantt
Mermaid Gantt charts are well suited to project planning, task scheduling, development progress, and project management, and you can try Mermaid online Gantt chart editor.
Basic syntax
Mermaid uses the journey declaration to create a user journey diagram.
journey
title User purchases a product
section Browse
Search for products: 5: User
View details: 4: User
section Place order
Add to cart: 5: User
Complete payment: 3: User
Rendering result
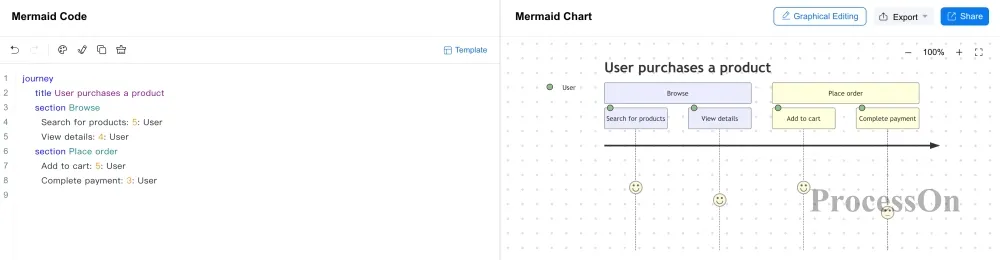
Where:
Common syntax
| Syntax | diagrams | Meaning |
| journey | User journey diagram | Create a user journey diagram |
| title text | Title | User journey diagram title |
| section text | Section block | Divides stage groups in the flow |
| TaskName:num:Actor | Journey node + satisfaction scale axis | Defines the interaction tasks, satisfaction scores, and participating actors within a stage |
| num (1~5) | Satisfaction score | 1 is the lowest, 5 is the best |
| Me, Cat | Actor | Defines the multiple actors involved in the task |
For the detailed syntax for generating user journey diagrams with Mermaid, see the page below: https://www.processon.io/mermaid/user-journey-diagram
User journey diagrams are well suited to analyzing the different steps and experiences a customer goes through from first contact with a product to achieving a goal, and you can try Mermaid online user journey diagram editor.
Basic syntax
Mermaid uses the timeline declaration to create a timeline.
timeline
title Mermaid Development History
2019 : Project Development
2020 : Feature Expansion
2021 : More Diagram Types
Rendering result
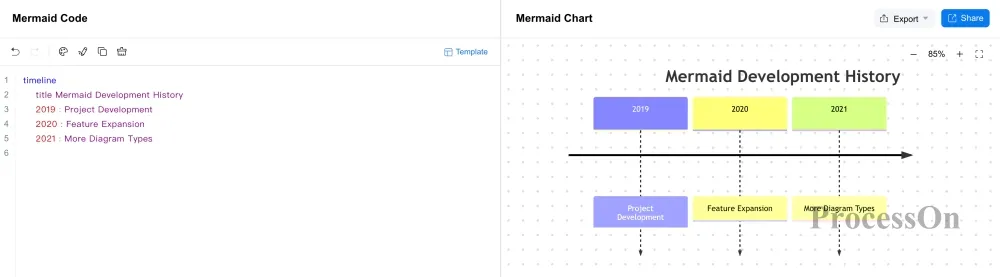
Where:
Common syntax
| Syntax | diagrams | Meaning |
| timeline | Timeline | Create a timeline |
| title text | Title | Sets the timeline title |
| section text | Section block | Divides time period groups |
| date : Event1 | Event | Defines the event for a point in time |
| : Event2 | Multiple events | Additional events at the same time |
| Space | Line break | Wraps overlong event descriptions |
For the detailed syntax for generating timelines with Mermaid, see the page below: https://www.processon.io/mermaid/timeline
Timelines are well suited to presenting historical events, project development, product iterations, and chronological information, and you can try Mermaid online timeline editor.
Basic syntax
Mermaid uses the quadrantChart declaration to create a quadrant chart.
quadrantChart
title Product Positioning
x-axis Low Price--> High Price
y-axis Low Quality--> High Quality
quadrant-1 High-end
quadrant-2 Quality-focused
quadrant-3 Basic
quadrant-4 Value-for-money
Product A: [0.8, 0.7]
Product B: [0.3, 0.8]
Rendering result
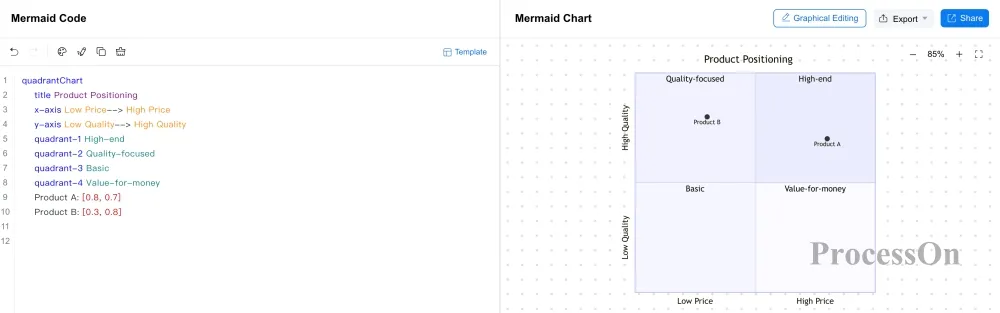
Where:
For the detailed syntax for generating quadrant charts with Mermaid, see the page below: https://www.processon.io/mermaid/quadrant-chart
Quadrant charts are well suited to product positioning, prioritization analysis, competitive analysis, and two-dimensional classification, and you can try Mermaid quadrant chart the online editor.
Basic syntax
Mermaid kanban diagrams organize work items by task status, such as To Do, In Progress, and Done. A typical structure looks like this:
kanban
Todo
Task A
Task B
Doing
Task C
Done
Task D
Rendering result
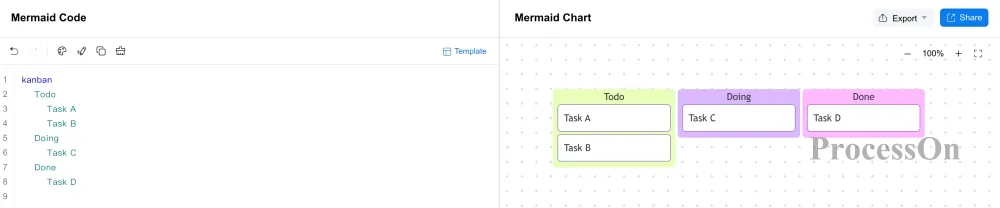
Where;
For the detailed syntax for generating kanban diagrams with Mermaid, see the page below: https://www.processon.io/mermaid/kanban
Kanban diagrams are well suited to project management, task tracking, development processes, and workflow management, and you can try Mermaid kanban diagram the online editor.
Basic syntax
Requirement diagrams can represent the relationships between requirements, functions, and system elements, Mermaid uses the requirementDiagram declaration to create a requirement diagram.
requirementDiagram
requirement userRequirement {
id: 1
text: Customers can purchase products
risk: low
verifymethod: test
}
Rendering result
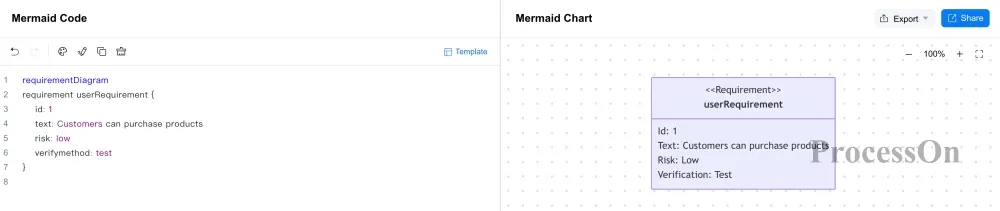
Where:
Common syntax
| Syntax | diagrams | Meaning |
| requirementDiagram | Requirement diagram | Create a requirement diagram |
| Requirement name { } | Requirement | Defines a basic requirement |
| functionalRequirement name { } | Function | Defines a functional requirement |
| interfaceRequirement name { } | Interface | Defines an interface requirement |
| performanceRequirement name { } | Performance | Defines a performance requirement |
| physicalRequirement name { } | Physical | Defines a physical requirement |
| element name {type: name docRef: name} | Element | Defines entity elements such as systems, components, and tests |
| X - satisfies -> Y | Dashed arrow | The entity satisfies the corresponding requirement |
| X - contains -> Y | Solid line with a cross-plus circular endpoint at the start | One requirement contains another requirement |
| X - derives -> Y | Dashed arrow | A requirement is derived from another requirement |
| X - copies -> Y | Dashed arrow | A requirement copies another requirement |
| X - traces -> Y | Dashed arrow | Bidirectional traceability between requirements |
For the detailed syntax for generating a requirement the diagram diagram with Mermaid, see the page below: https://www.processon.io/mermaid/requirement-diagram
Requirement diagrams are well suited to product requirements analysis, systems engineering, and requirements tracing, and you can try Mermaid requirement diagram the online editor.
Basic syntax
Mermaid uses the pie declaration to create a pie chart.
pie showData
title Population Share by Continent
"Asia" : 59.5
"Africa" : 18.0
"Europe" : 9.0
"North America" : 7.5
"South America" : 5.5
"Oceania" : 0.5
Rendering result
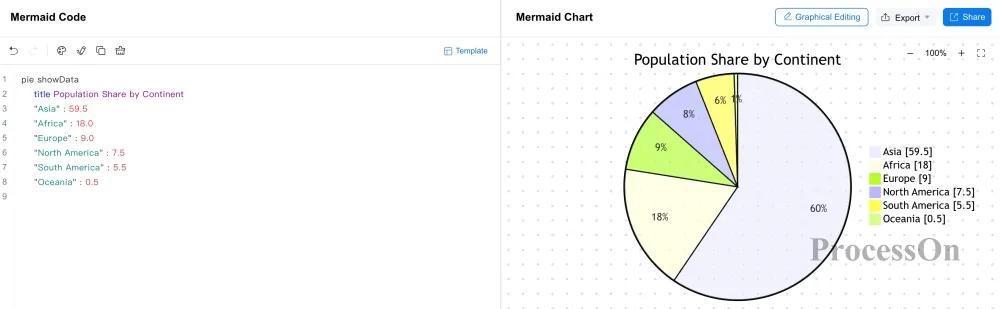
Where:
For the detailed syntax for generating pie charts with Mermaid, see the page below: https://www.processon.io/mermaid/pie-chart
Pie charts are well suited to showing proportions and composition, and you can try Mermaid pie chart the online editor.
Basic syntax
Sankey diagrams are mainly used to show the flow of traffic, resources, funds, or data between different nodes, Mermaid uses the sankey-beta declaration to create a Sankey diagram.
sankey-beta
A,B,50
A,C,30
B,D,20
C,D,30
Rendering result
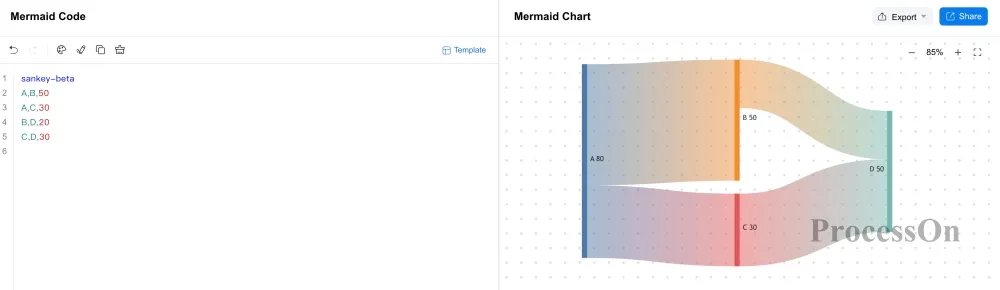
Where:
For the detailed syntax for generating Sankey diagrams with Mermaid, see the page below: https://www.processon.io/mermaid/sankey-diagram
A Sankey diagram is a visualization that shows the flow from one set of values to another, and you can try Mermaid Sankey diagram the online editor.
Basic syntax
Mermaid uses the xychart-beta declaration to create an XY chart.
xychart-beta
title "Monthly Sales Data"
x-axis "Month"["Jan", "Feb", "Mar", "Apr", "May", "Jun"]
y-axis " Sales (million)" 0 --> 100
line [20, 30, 40, 35, 50, 60]
bar [30, 50, 35, 20, 45, 40]
Rendering result
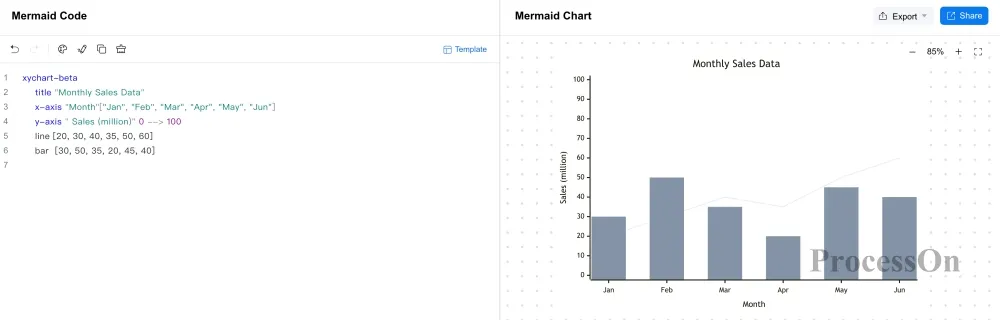
Where:
Common syntax
| Syntax | diagrams | Meaning |
| xychart-beta | XY coordinate chart | Create an XY coordinate chart |
| xychart-beta horizontal | Horizontal XY coordinate chart | Create a horizontal XY coordinate chart |
| title "name" | Title | Defines the XY chart title |
| x-axis "axisTitle" [a,b,c] | X-axis | Defines the x-axis categories and title |
| y-axis "axisTitle" min --> max | Y-axis | Defines the y-axis range and title |
| y-axis "axisTitle" | Y-axis with title only | Sets only the y-axis name; the value range is adjusted automatically |
| bar [num1, num2, num3] | Column chart | Defines the bar chart data series |
| line [num1, num2, num3] | Line chart | Defines the line chart data series |
For the detailed syntax for generating XY charts with Mermaid, see the page below: https://www.processon.io/mermaid/xy-chart
XY charts are well suited to showing data changes, value comparisons, and simple data visualization, and you can try Mermaid XY chart the online editor.
Basic syntax
Radar charts are well suited to comparing how multiple objects perform across multiple dimensions, such as skill assessments, product metrics, and option comparisons. Mermaid uses radar-beta to create a radar chart.
radar-beta
title "Competency Assessment Radar Chart"
axis a["Communication Skills"], b["Logical Thinking"], c["Team Collaboration"], d["Technical Skills"]
curve A["Chenlaoda"] {80, 90, 70, 85}
curve B["Wangxiaoer"] {60, 70, 90, 80}
Rendering result
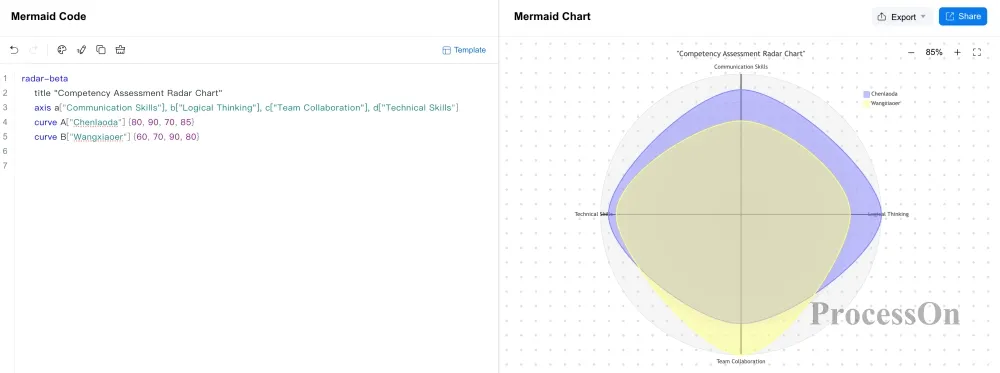
Where:
Common syntax
| Syntax | diagrams | Meaning |
| radar-beta | Radar chart | Create a radar chart |
| title "name" | Title | Defines the radar chart title, placed immediately after radar-beta |
| title "name" | Title | Defines the radar chart title, placed before radar-beta, with 3 dashes added both above and below |
| axis id ["axisTitle"] | Dimension axis | Defines the radar chart dimensions and their names |
| curve id ["name"]{[values]} | Data curve | defines the data series names and the values for each dimension |
| max value | Maximum | Sets the maximum value of the radar chart's value range |
| min value | Minimum | Sets the minimum value of the radar chart's value range |
For the detailed syntax for generating radar charts with Mermaid, see the page below: https://www.processon.io/mermaid/radar-chart
Radar charts are especially useful for developers, data scientists, and engineers who need to present data clearly and concisely in a circular format, and you can try Mermaid radar chart the online editor.
Basic syntax
Mermaid uses the gitGraph declaration to create a Git graph.
gitGraph
commit
branch develop
checkout develop
commit
checkout main
merge develop
Rendering result
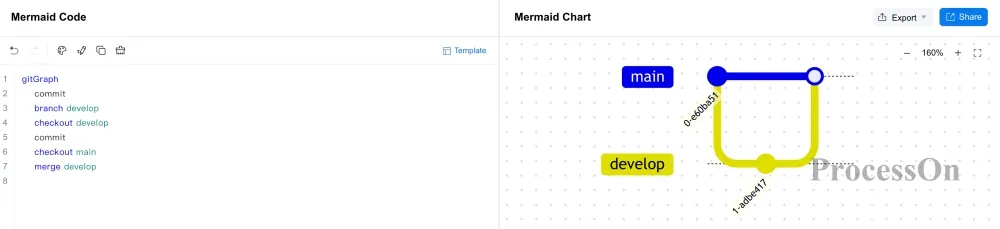
Where:
For the detailed syntax for generating Git graphs with Mermaid, see the page below: https://www.processon.io/mermaid/git-graph
Git graphs are well suited to representing version control processes such as Git commits, branch creation, branch switching, and merging, and you can try Mermaid Git graph the online editor.
Basic syntax
Mermaid C4 diagrams are used for software architecture modeling and can describe software systems, containers, components, and their relationships at different levels.
C4Context
title C4 Diagram of the Business System
Person(user, " User", " System user")
System(system, " Business System", " Core business system")
Rel(user, system, "Uses")
Rendering result
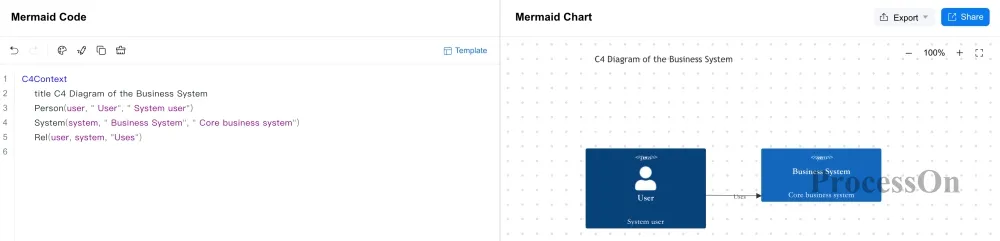
Where:
Common syntax
| Syntax | diagrams | Meaning |
| C4Context | System context diagram | Create a C4 system context diagram |
| C4Container | Container diagram | Create a C4 container diagram |
| C4Component | Component diagram | Create a C4 component diagram |
| C4Dynamic | Dynamic interaction diagram | Create a C4 dynamic interaction diagram |
| C4Deployment | Deployment diagram | Create a C4 deployment diagram |
| title | Title | Sets the C4 diagram title |
| Person(alias, "label", "description") | Person | Represents a user or role that uses the system |
| Person_Ext(alias, "label", "description") | External person | Represents a person or organizational role outside the system that participates in interactions |
| System(alias, "label", "description") | System node | Represents a software system that needs to be analyzed |
| System_Ext(alias, "label", "description") | External system node | Represents a third-party service or external software system that the system depends on |
| System_Boundary(alias, "label") | System boundary | Represents the system scope boundary |
| Container(alias, "label", "technology") | Container | Represents a software unit inside the system that can run independently |
| ContainerDb(alias,"label","technology") database | Represents a data storage component in the system | |
| Container_Boundary(alias, "label") | Container boundary | Represents the scope of a container or service |
For the detailed syntax for generating C4 diagrams with Mermaid, see the page below: https://www.processon.io/mermaid/c4-diagram
C4 diagrams are well suited to software architecture design, system analysis, and technical documentation, and you can try Mermaid C4 diagram the online editor.
Basic syntax
Mermaid uses the architecture-beta declaration to create an architecture diagram.
architecture-beta
group api(cloud)[API server]
service server(server)[server] in api
service database(database)[databasa] in api
server:R --> L:database
Rendering result

Where:
For the detailed syntax for generating architecture diagrams with Mermaid, see the page below: https://www.processon.io/mermaid/architecture-diagram
Architecture diagrams are well suited to representing the relationships between servers, databases, cloud services, application services, and different system components, and you can try Mermaid architecture diagram the online editor.
Basic syntax
Block diagrams mainly describe system structure through modules and their connections, Mermaid uses the block-beta declaration to create a block diagram.
block-beta
A space B
A["User"] --> B["Application"]
B space C
B --> C["Database"]
Rendering result

Where:
For the detailed syntax for generating block diagrams with Mermaid, see the page below: https://www.processon.io/mermaid/block-diagram
Block diagrams are well suited to system modules, functional structures, technical architecture, and component relationships, and you can try Mermaid block diagram the online editor.
Basic syntax
Packet diagrams are mainly used to represent the fields and lengths in network packets or protocol data structures, Mermaid uses the packet-beta declaration to create a packet diagram.
packet-beta
0-7: "Version"
8-15: "Type"
16-31: "Length"
Rendering result

Where:
Packet diagrams are well suited to network protocols, packet structures, and technical specification documents, and you can try Mermaid packet diagram the online editor.
Being unfamiliar with Mermaid syntax doesn't mean you can't use Mermaid to generate diagrams, and you can take the following approaches:
Free Mermaid templates
First pick the template closest to what you need, then edit its nodes, text, and relationships. This approach suits users who are using Mermaid for the first time.
Generate Mermaid code with AI
You can simply describe the diagram you need in natural language, for example:
Create an e-commerce order processing flow that includes placing an order, payment, inventory check, shipping, and order completion.
AI can generate Mermaid code from the description, and you can then modify it to fit your actual needs.
Check and fix code with AI
If your Mermaid code has a syntax error, you can have AI help locate the problem and fix the code.
Generate code from an image
For flowcharts, architecture diagrams, or other structured diagrams that already exist, you can try generating Mermaid code through image recognition and then continue editing.
A Mermaid online editor usually has to solve three core problems: writing code, previewing diagrams, and exporting results. On top of that, templates and AI can also lower the barrier to using Mermaid.
Take ProcessOn Mermaid the online editor as an example - in the browser you can directly:
So for those who need to create Mermaid diagrams diagrams frequently, ProcessOn Mermaid an online editor can bring Mermaid code writing, diagrams generation, re-editing and, export, and sharing together in one working environment.
From Mermaid flowcharts, sequence diagrams, and class diagrams to Gantt charts, mind maps, quadrant charts, Sankey diagrams, Git graphs, C4 diagrams, and architecture diagrams, all of them can be created with Mermaid syntax and edited.
Come and use the Mermaid online editor, write Mermaid code online and generate diagrams!
Is Mermaid syntax hard to learn?
Mermaid's basic syntax is relatively simple, and for most diagrams you only need to master the basic forms of a diagram declaration, nodes, lines, and text. For example, sequenceDiagram declares a sequence diagram and flowchart declares a flowchart. Syntax rules differ between diagram types, and complex diagrams require further study of the corresponding parameters and configuration.
Why can't Mermaid generate a diagram when the code is wrong?
Mermaid is fairly sensitive to syntax structure. Common causes include an incorrect diagram declaration, incomplete node or line syntax, incorrect handling of indentation or special characters, and use of syntax that the current Mermaid version does not support.
What is the difference between Mermaid and traditional drawing software?
Mermaid mainly describes diagrams through text code, whereas traditional drawing software usually creates diagrams by dragging shapes and lines and adjusting styles.
Can Mermaid diagrams be saved and reused?
Yes. The core content of a Mermaid diagram is text code, so you can save the code in Markdown, a code file, or another document that supports Mermaid, and render it again whenever needed.
This is also an important difference between Mermaid and diagrams that exist purely as images: An image stores the final result, whereas Mermaid code also stores the diagram's structural information.
How does Mermaid relate to Markdown?
Mermaid is often used together with Markdown, but the two are not the same syntax.
Markdown is mainly used to write structured text, while Mermaid is used to generate diagrams through code. In a Markdown editor that supports Mermaid, you can embed Mermaid code in a Markdown document, so that the diagram and the accompanying text are in the same document.