Process Type
Graphical expression
Mind Type
Structured expression
Note Type
Efficient expression
Treemap
Bracket Diagram
Default Mode


In today's fast-paced business environment, efficient project management is the key to success for both large enterprises and small teams. Faced with complex and ever-changing project tasks, intricate time arrangements, and the collaboration of many people, how to ensure that the project is carried out as planned, resources are reasonably allocated, and progress is controlled in real time has become a difficult problem that every project manager needs to solve. As a classic and powerful project management tool, the Gantt chart has become a powerful assistant for many project managers with its intuitive, clear and practical features.
The Gantt Chart was invented by Henry Laurence Gantt in the early 20th century. It displays the tasks in a project in chronological order in the form of an intuitive bar chart.
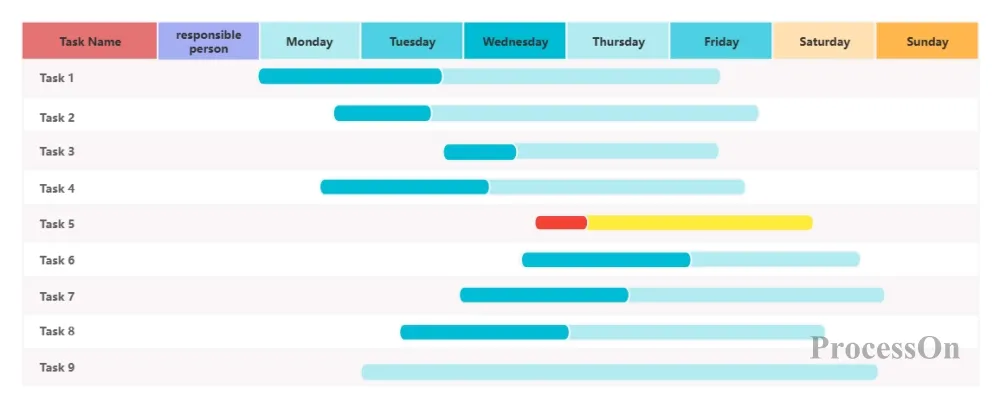
In the Gantt chart, the horizontal axis represents the time dimension, clearly marking the various stages of the project from start to end; the vertical axis lists all the tasks that need to be completed in the project, and each task corresponds to a horizontal bar chart. The starting point of the bar chart represents the start time of the task, and the end point represents the completion time of the task. The length of the bar chart intuitively reflects the time span required for the task. Through this concise and clear presentation method, project team members can understand the overall progress of the project, the sequence of tasks and the time arrangement at a glance, providing clear guidance for the smooth progress of the project.
Gantt charts can play a huge role in many project management scenarios. The following situations are particularly suitable for using Gantt charts:
1. Multi-tasking parallel projects
When there are multiple tasks in a project that need to be carried out simultaneously and there are complex dependencies between the tasks, the Gantt chart can help project managers clearly sort out the order of tasks, arrange resources reasonably, and avoid conflicts and delays between tasks. For example, in a construction project, multiple links such as civil construction, water and electricity installation, and decoration and renovation need to be carried out simultaneously, but they are interrelated. Through the Gantt chart, the start and end time of each construction link can be clearly defined to ensure smooth connection of various tasks.
2. Long-term project planning
For projects with a long cycle, such as new product development and large-scale infrastructure construction, Gantt charts can help team members grasp the overall progress of the project from a macro perspective, break down long-term goals into specific phased tasks, and set clear time nodes. This helps to promptly identify problems that may arise during the project process, formulate countermeasures in advance, and ensure that the project is delivered on time.
3. Team Collaboration Project
In projects involving multiple departments or team members, Gantt charts can be used as an important tool for information sharing and communication and collaboration. Each member can clearly understand their responsibilities and task schedule in the project, and can also see the work progress of other members, so as to better collaborate and improve the overall efficiency of the team.
With the development of technology, there are now many excellent Gantt chart creation tools to choose from, whether it is professional project management software or convenient online tools, which can meet the needs of different users.
Microsoft Project: As a classic software in the field of project management, it is powerful and comprehensive, supports the creation of complex Gantt charts, and has rich functions such as task management, resource allocation, and progress tracking. However, the software is relatively complex to operate and has a high learning cost, so it is suitable for large enterprises and professional project managers.
Primavera P6: It is widely used in large and complex project management in industries such as construction, engineering, and energy. It can handle large-scale tasks and resource data and provide refined project planning and control. However, its professionalism and complexity also determine that it is mainly aimed at professional users.
ProcessOn : This is an online tool designed to improve project management efficiency. It has a simple and intuitive interface and is easy to use. You can get started without complex training. It supports real-time collaborative editing of Gantt charts by multiple people. Team members can view and update project progress online anytime and anywhere, and share information conveniently and quickly. At the same time, it provides a rich template library covering various common project types, and users can quickly create personalized Gantt charts according to their needs.
Trello: It is loved by many teams for its simple Kanban-style management interface. It can also realize the Gantt chart function through plug-ins or integration with other tools. It is suitable for small teams or agile projects and can flexibly manage tasks and project progress.
Taking ProcessOn as an example, the following steps for making a Gantt chart are described in detail:
1. Open the ProcessOn official website, enter the personal file page, create a flowchart , click [More Graphics] in the lower left corner, and select Gantt chart.
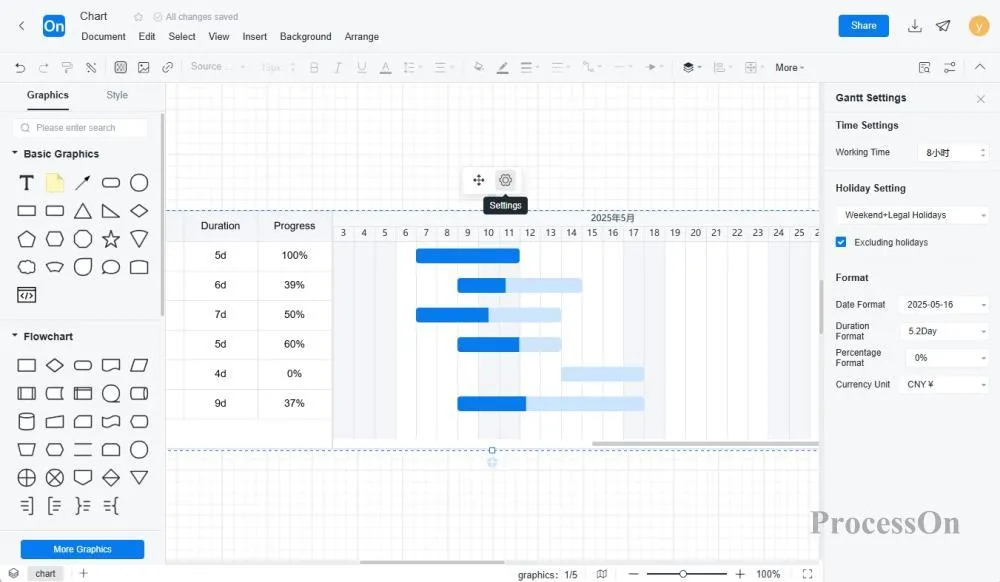
2. Drag the Gantt chart to the canvas, click [Settings], and use the toolbar on the right to set working hours, holidays, time/date and other formats.
3. In the Gantt chart project table, click the [ Add Task ] button and enter the names of each task in turn. At the same time, set the start time and estimated completion time of the task, and the tool will automatically generate the corresponding bar chart in the Gantt chart based on this information.
4. ProcessOn by simply dragging and dropping . Right-click the task list in the Gantt chart to add subtasks, convert to milestones, etc.
5. Assign each task to specific team members and clarify everyone's responsibilities. Right-click the Gantt chart header to add priority, responsible person and other columns to the Gantt chart list. Double-click the task cell under the responsible person list and select the corresponding responsible person, who will receive the task notification .
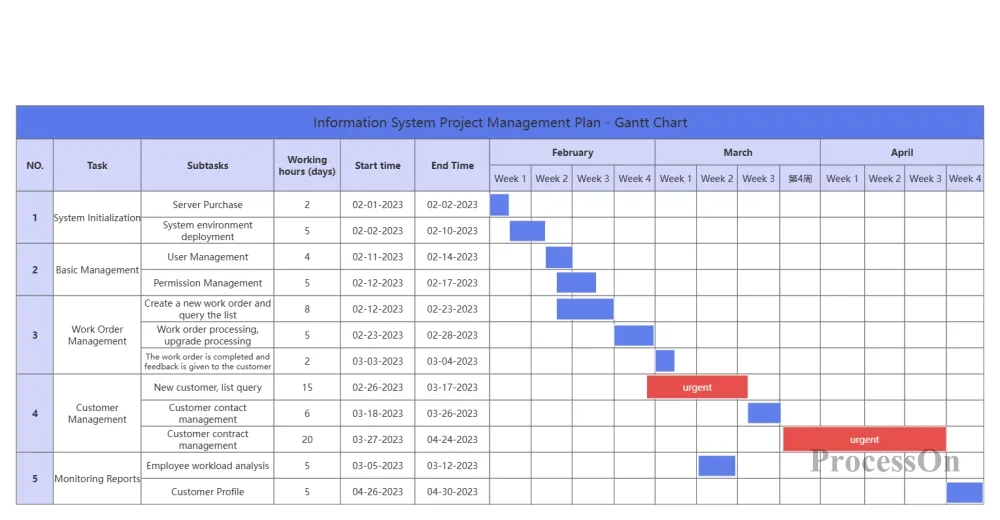
Assuming we are in charge of a new product launch project for an e-commerce website, here is an example of a Gantt chart made using ProcessOn :
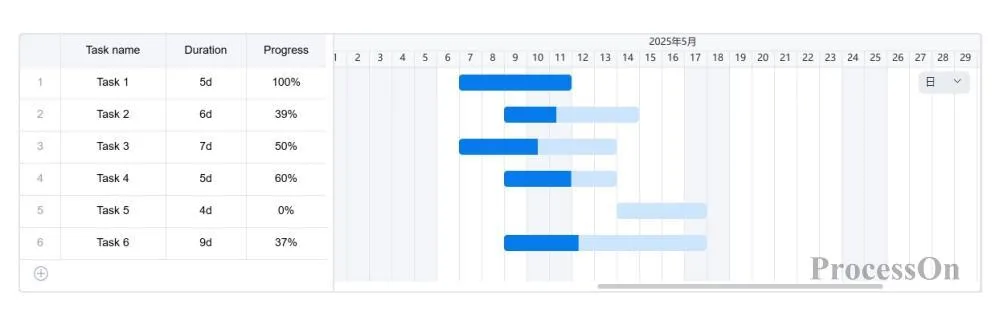
In the Gantt chart, we can clearly see the schedule and progress of each task. Task 1 has been completed, and the corresponding bar chart is dark blue ; Tasks 2/3/4/6 are in progress, and the bar chart is partially filled with color; and Task 5 has not yet started, and the bar chart is light blue . Through this intuitive display, team members can quickly understand the overall progress of the project, adjust work arrangements in time, and ensure that the project proceeds as planned.
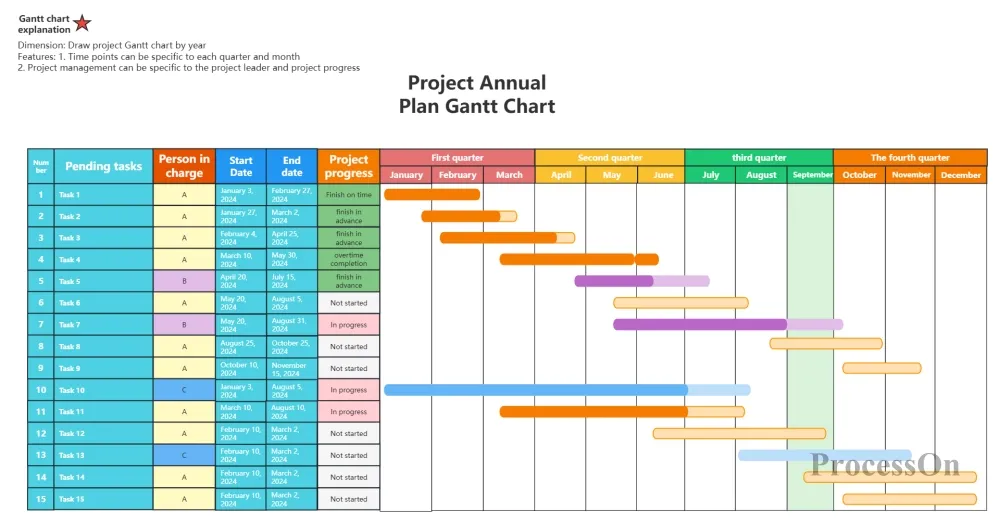
The ProcessOn template community contains a variety of Gantt chart templates for reference in multiple industries, and supports cloning to improve drawing efficiency. The following are some templates for sharing.
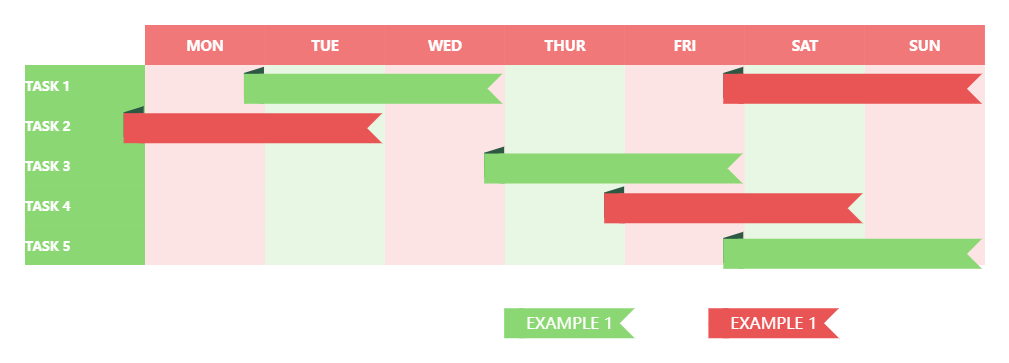
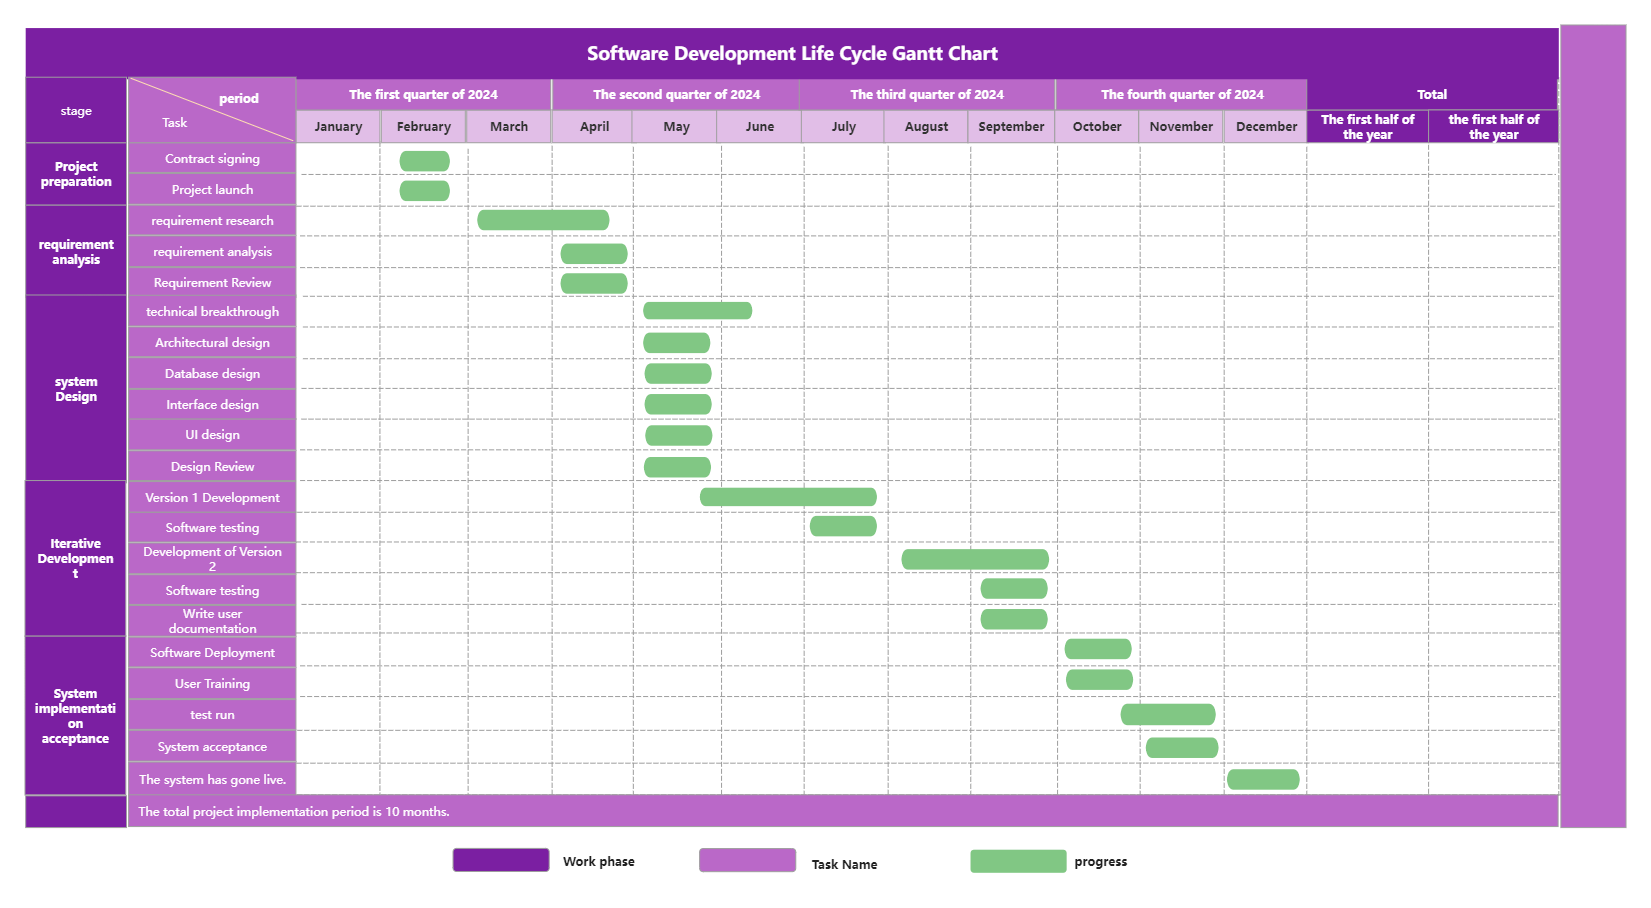
Software Development Lifecycle Gantt Chart
As a classic tool in the field of project management, the Gantt chart provides strong support for project teams with its intuitive and practical features. Whether you are an experienced project manager or a novice in the field of project management, mastering the use of the Gantt chart will greatly facilitate your work. Try using ProcessOn to create your own Gantt chart now !