Process Type
Graphical expression
Mind Type
Structured expression
Note Type
Efficient expression
Treemap
Bracket Diagram
Default Mode


Anyone who has done project management should know that Gantt charts look simple, but in reality, they are time-consuming and labor-intensive to draw .
Task breakdown, time scheduling, dependencies, milestone markers... every cell has to be manually dragged and aligned, not to mention the changes in the project plan midway through, which require the entire diagram to be redrawn.
However, project management cannot function without Gantt charts. They visually show when tasks start and end, who is responsible, which tasks run in parallel, and which have dependencies. They are a core tool that project managers, product managers, and even students writing graduation theses rely on.
Things are different now. ProcessOn AI supports one-click Gantt chart generation. You only need to describe your requirements, and AI can generate a well-structured, time-appropriate, and task-specific Gantt chart within 10 seconds.
A Gantt chart, also known as a bar chart or horizontal bar chart, is the most commonly used visualization tool in project management. It visually represents the sequence and duration of activities in a specific project using a list of activities and a time scale.
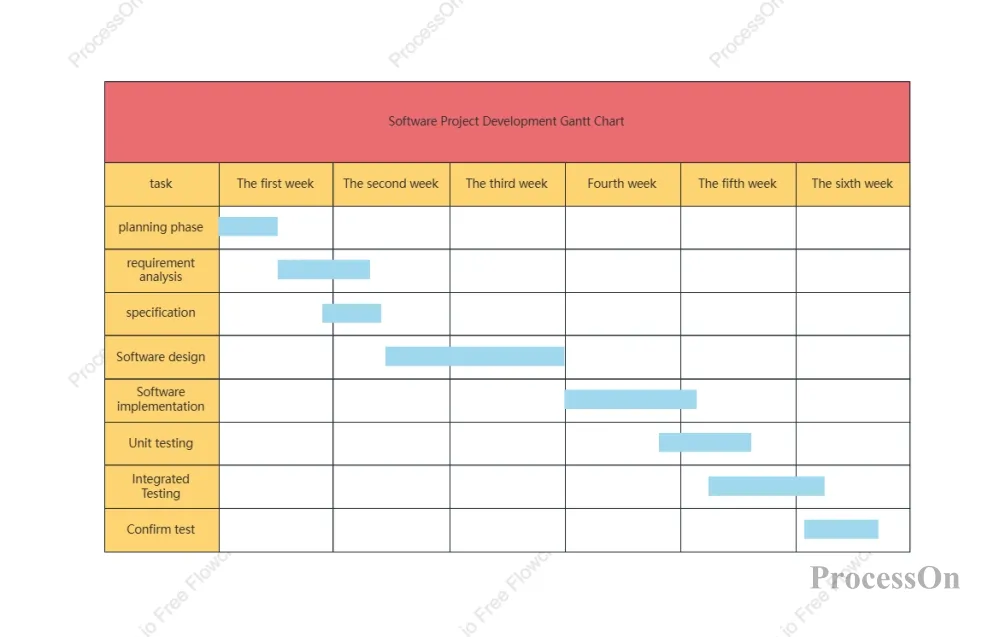
Horizontal axis: Time (day/week/month/quarter)
Vertical axis: Task list
The middle bar chart shows the start time, end time, and duration of each task.
Task: A clear breakdown and definition of tasks, including task name, task description, priority, and dependencies between tasks .
Time: Displays the start and end dates of tasks horizontally; milestone nodes can be marked with special symbols .
Resources: The person in charge or team for each task, helping to allocate human, material, and financial resources effectively.
Project planning: Define the start and end times of each task, as well as the dependencies between tasks.
Resource allocation: Rational allocation of personnel, funds, and equipment
Monitor progress: Identify project deviations promptly and take corrective measures.
Optimize processes: Identify efficiency bottlenecks through visual analysis.
There's no need to generate text descriptions within other large AI models and then manually draw them in a spreadsheet tool. The entire process of "requirements → generation → optimization → export" can be completed directly within a single tool.
ProcessOn AI is specially trained to generate Gantt charts with reasonable task structures, scientific time scheduling, and correct dependencies, which can be directly used for project reporting and progress tracking.
It supports exporting to PNG, JPG, PDF, Visio, SVG and other formats, seamlessly integrating with your document workflow.
ProcessOn's template community boasts nearly a million template resources, covering various scenarios such as Gantt charts for software projects, graduation thesis progress reports, and product development plans. You can generate templates using AI first, then optimize them based on the templates, doubling your efficiency.
All files are automatically saved to the cloud, supporting multi-device synchronization, allowing team members to collaborate and edit in real time. Version history is traceable, so you no longer need to worry about accidental deletion.
Create a new flowchart on the ProcessOn website, or open any existing canvas.
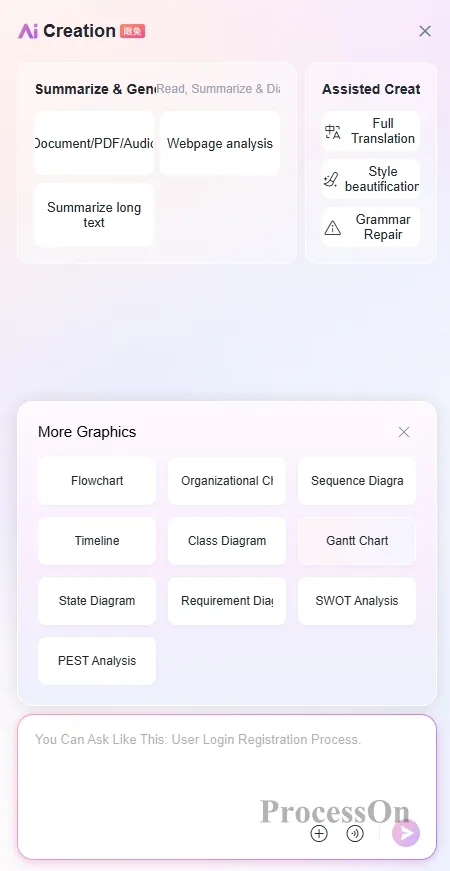
Click the [AI Assistant] button in the upper right corner of the canvas to enter AI creation mode.
In the recommended scenarios , select [Gantt Chart].
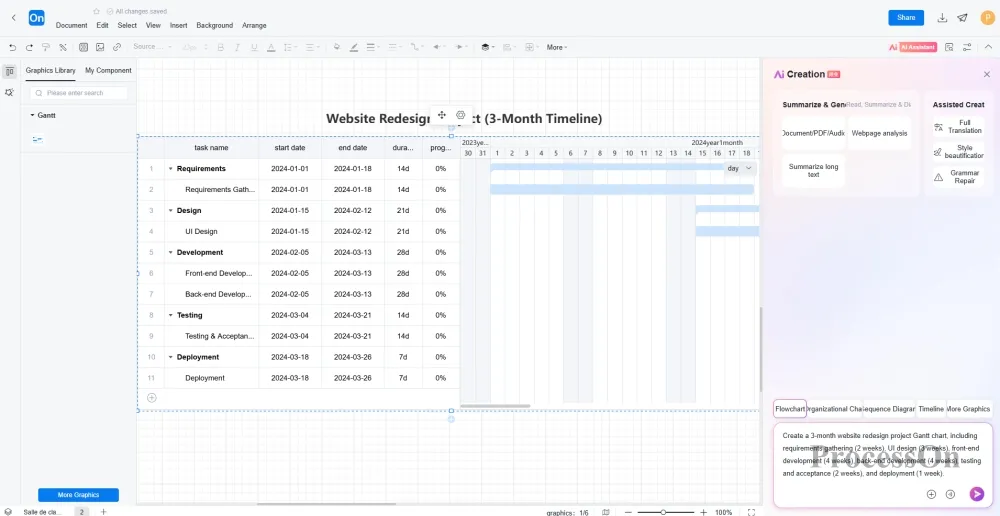
Then, in the input box, describe your project requirements clearly, as if you were communicating with a colleague. For example:
“Create a 3-month website redesign project Gantt chart, including requirements gathering (2 weeks), UI design (3 weeks), front-end development (4 weeks), back-end development (4 weeks), testing and acceptance (2 weeks), and deployment (1 week). Front-end development can only begin after UI design is completed, and testing will begin simultaneously after front-end and back-end development is completed.”
After receiving the instruction, the AI will generate a Gantt chart within 10 seconds that clearly shows the task, the time frame, and the dependencies.
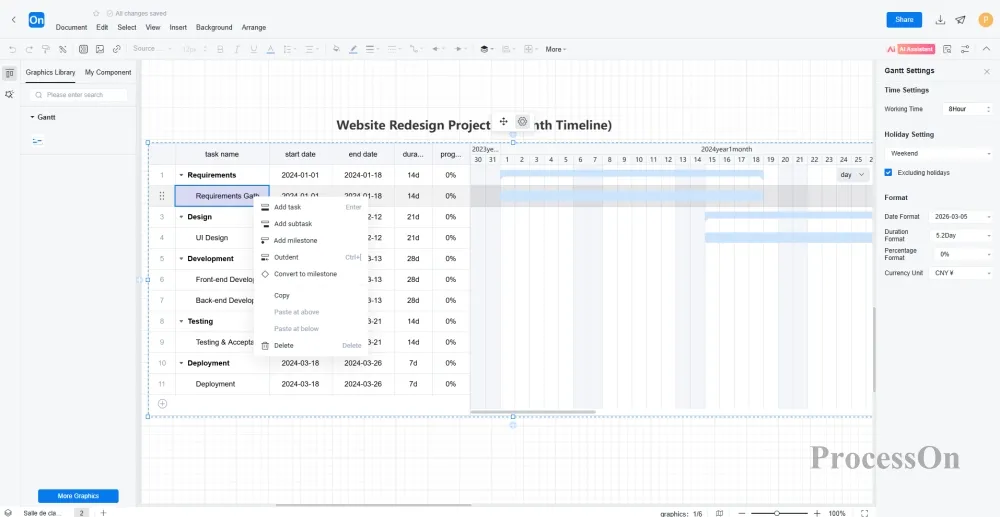
the content , you can make final adjustments to the details—adjust the task bar length, modify the percentage progress, add milestone markers, etc.
Finally, export the file in the format you need:
It can export high-definition PNG/JPG /SVG vector graphics for insertion into PPT or documents , print in PDF format or for formal presentations , and can also export in Visio format for colleagues who need further editing .
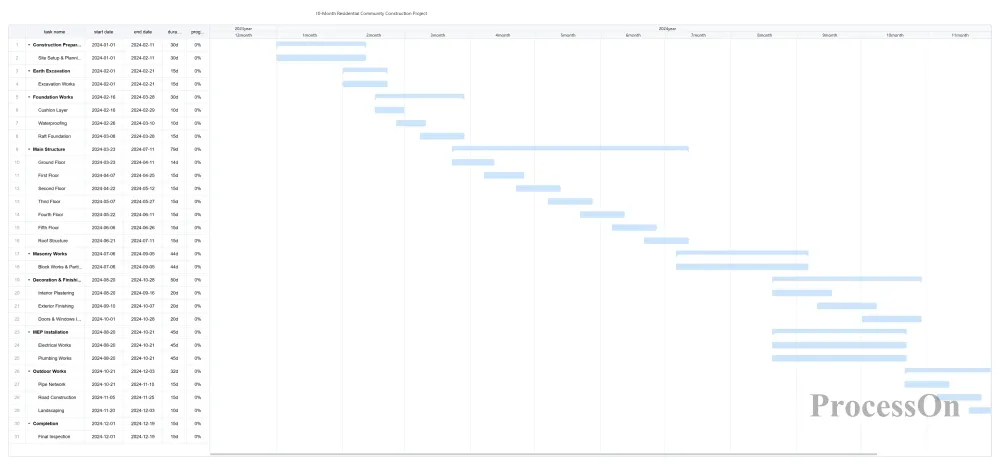
This is a real-world case study from an engineering management scenario. A construction company undertook a project to build a six-story residential complex. The project manager needed a 10-month Gantt chart of the construction schedule for approval and on-site management.
Enter the command:
“Create a 10-month Gantt chart for the construction schedule of a residential community project, including the following stages: construction preparation (1 month), earthwork excavation (0.5 months), foundation engineering (1.5 months, including subbase, waterproofing, and raft foundation), main structure (3 months, approximately 0.5 months per floor), masonry engineering (1.5 months, starting after the main structure is topped out), decoration and finishing (2 months, including interior and exterior wall plastering and door and window installation), water and electricity installation (1.5 months, concurrent with decoration and finishing), outdoor works (1 month, including pipelines, roads, and landscaping), and final acceptance (0.5 months).”
The AI-generated Gantt charts have clear task hierarchies, reasonable time arrangements, and clear dependencies between key processes, which project managers can directly use for construction organization design and progress control.
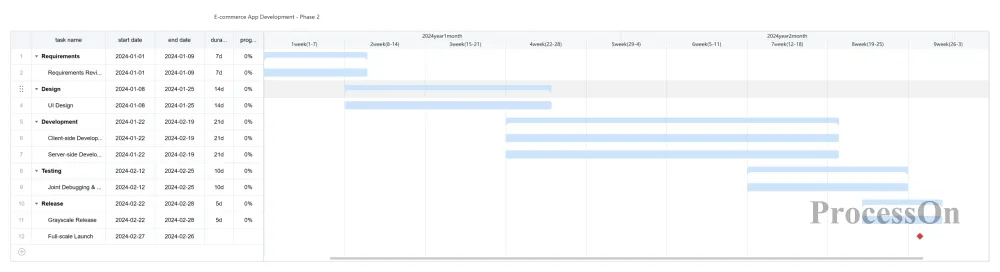
For software development teams, Gantt charts are a necessity. The ProcessOn template community offers a large number of Gantt chart templates for software projects, and now custom versions can be generated directly using AI.
Enter the command :
"Generate a Gantt chart for the second phase of e-commerce app development, with a cycle of 2 months, including requirements review, UI design, client-side development, server-side development, integration testing, canary release, and full launch, marking key milestones."
AI can intelligently identify typical stages of software development and automatically set reasonable dependencies and timelines.
Gantt charts are essentially communication and management tools used to plan projects, allocate resources, and track progress. Previously, we spent a lot of time dragging and dropping cells, aligning dates, and adjusting formatting. Now, with AI, you can truly focus your energy back on management itself—clarifying your project goals, task breakdown, resource allocation, and risk control, and then let the tool help you transform your ideas into a professional, clear, and efficient Gantt chart.