Process Type
Graphical expression
Mind Type
Structured expression
Note Type
Efficient expression
Treemap
Bracket Diagram

Default Mode





At the end of each quarter, the most common phrase heard in the office is: "We didn't meet our KPIs again this quarter."
Sales targets missed by 30%, user growth fell short of expectations, project delivery was delayed by two weeks, and the number of bugs exceeded the limit after product launch… Whenever these situations occur, most teams react by holding meetings, reviewing the situation, and finding the causes. But what happens after the meetings? Often, it's "Everyone worked very hard, but the market environment was bad," "Competitors were two months ahead of us," "We didn't have enough manpower"—a whole bunch of reasons are listed, but the problems persist into the next quarter.
Where did the problem lie? It wasn't that we didn't look for the reasons, but rather that we didn't find the root cause.
Most people habitually focus on the "superficial reasons": sales targets weren't met because of "poor lead quality," projects were delayed because of "too many requirement changes," and product bugs were due to "insufficient testing time." These are all true, but they are merely "symptoms," not the "root cause." If you only treat the symptoms and not the underlying problem, the same KPI issues will recur every quarter.
The fishbone diagram (also known as a cause-and-effect diagram or Ishikawa diagram) is a systematic tool used for root cause analysis. It unfolds all possible causes of a problem in a structured way until an actionable root cause is found. This article will systematically explain the theoretical methods, practical steps, and case studies of the fishbone diagram to help you truly solve the problem of failing to meet KPIs.
Before delving into the fishbone diagram, let's first diagnose the problem of "KPIs not being met".
There are four common reasons why KPIs are not met:
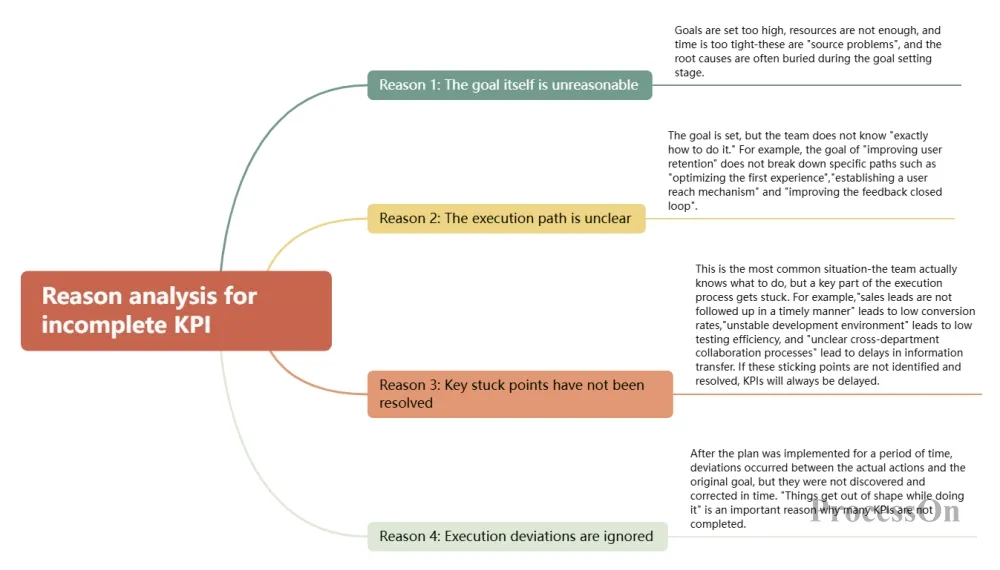
Analysis of Reasons for KPI Failure to Meet Requirements
The fishbone diagram, also known as the cause-and-effect diagram or the Ishikawa diagram, was invented by Japanese quality management expert Kaoru Ishikawa in the 1960s. It is an analytical tool used to systematically identify the root causes of problems.
The fishbone diagram is named as such because its shape resembles the skeleton of a fish.
Fish head: pointing to the right, representing the problem or result that needs to be analyzed (i.e., the fact that "KPIs were not achieved").
Fish spine: a main arrow pointing from left to right
Fish bone: The main branches branching off from the spine, representing the main categories of causes.
Fish bones: finer branches that continue to branch off from the main bone, representing specific causes.
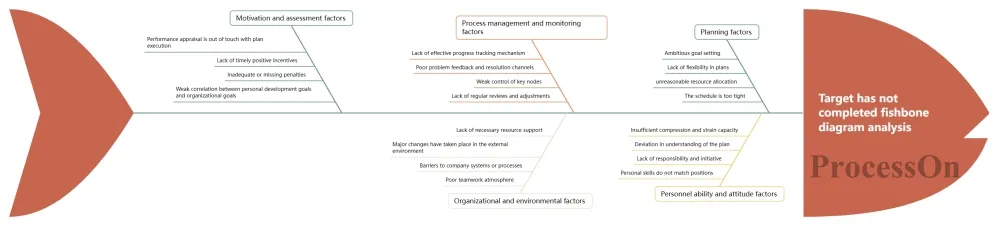
The core logic of the fishbone diagram is to break down a problem into multiple dimensions, and then ask "why" layer by layer in each dimension until an actionable root cause is found. It forces you to think systematically and from multiple dimensions, rather than just listing a few reasons based on intuition and drawing conclusions.
The first step in drawing a fishbone diagram is to determine the "big bones"—that is, the main categorization dimensions of the causes. The most classic categorization framework is the 5M1E method (Man, Machine, Material, Method, Environment, Measurement), which is widely applicable to manufacturing, project management, quality analysis, and other scenarios.
Man: Factors related to personnel, such as insufficient skills, inadequate training, unclear division of labor, poor communication, and low motivation.
Machine: Factors related to equipment and tools, such as equipment failure, software bugs, tool incompatibility, and insufficient performance.
Material: Factors related to materials and data, such as poor data quality, material supply delays, and inaccurate information.
Method: Factors related to methods and processes, such as unclear processes, lack of standards, inapplicable methods, and unreasonable systems.
Environment: Environmental factors such as market changes, increased competition, policy impacts, and office environment.
Measurement: Measures related factors, such as unclear KPI definitions, inconsistent data statistics, and inconsistent evaluation standards.
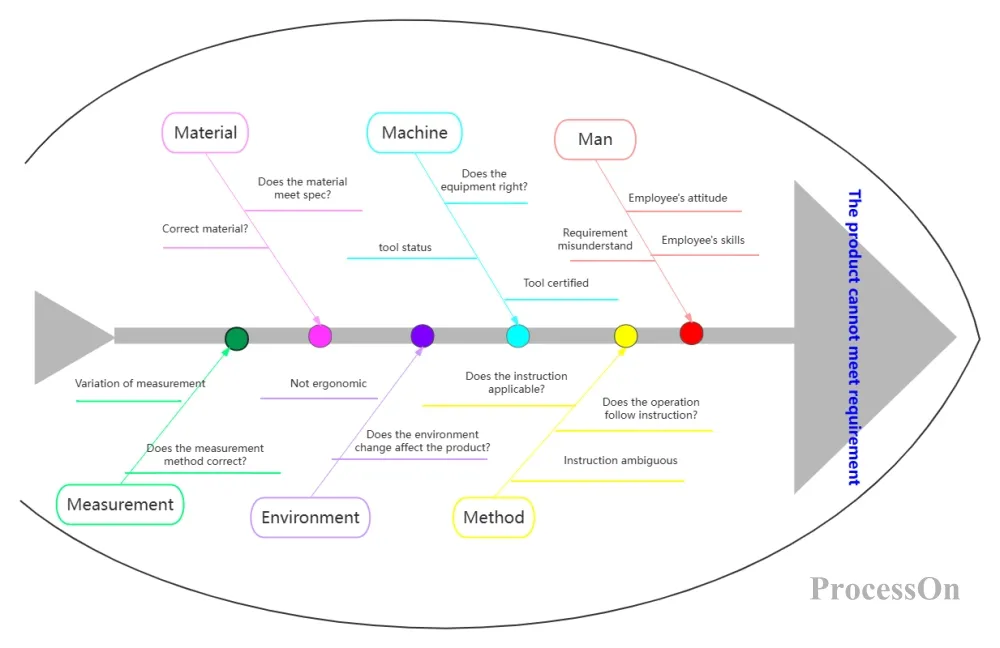
Man-Machine-Material-Method-Circle Fishbone Diagram
For non-manufacturing scenarios such as sales, marketing, product, and operations, more applicable classification frameworks can be used, such as the 4P method (product, price, place, promotion), the simplified version of 4M1E (people, materials, methods, environment), or custom dimensions.
ProcessOn is a professional fishbone diagram creation tool that supports online drawing of fishbone diagrams, mind maps, flowcharts, and other charts. The community offers a wide range of fishbone diagram templates for various fields, and also supports online sharing and collaboration.
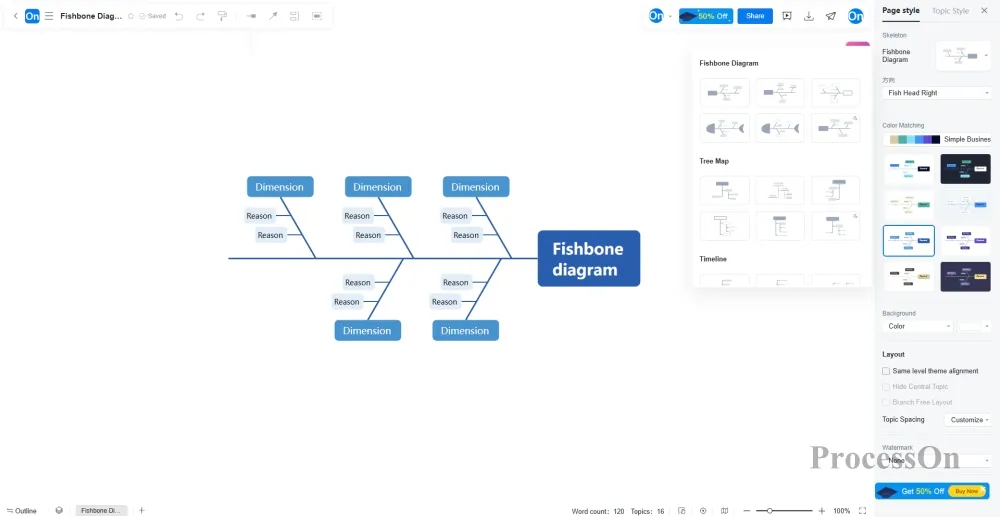
First, create a mind map on your ProcessOn profile page. In the right toolbar, go to [Style] -> [Canvas Style], select the fishbone pattern in the skeleton, and then adjust the direction of the fish head to the right.
Selecting the central theme in the canvas allows you to create branch themes, which can then be filled with the skeleton of the fishbone diagram.
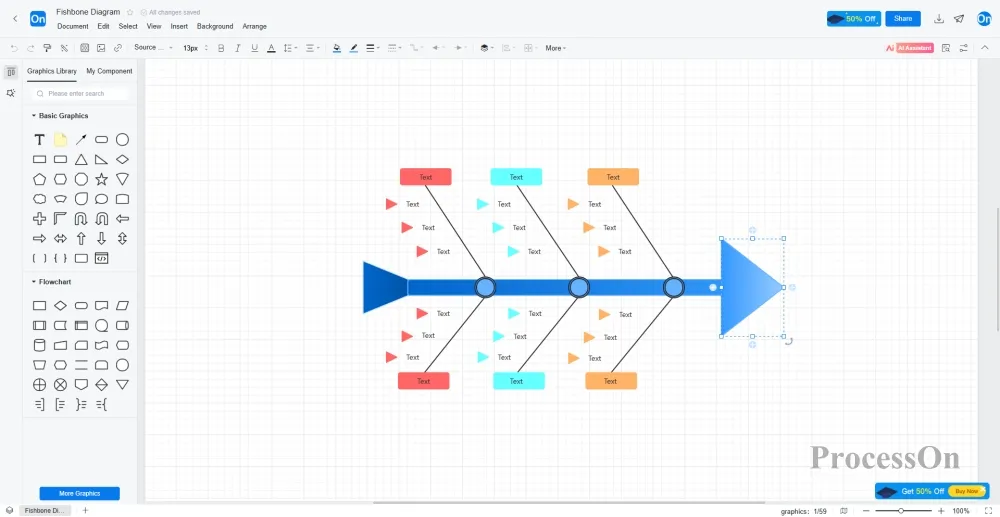
Create a flowchart on the ProcessOn profile page. Drag a rectangle or triangle from the graphics library onto the canvas as the fish head. Press the shortcut key L to create lines to form the skeleton of the fishbone diagram. Drag a rectangle from the graphics library to connect to the tail of the skeleton. Add the main bones, medium bones, and small bones of the fishbone diagram. Then fill the skeleton and graphics with text.
If fishbone diagram analysis requires teamwork, the system supports multiple users editing the same fishbone diagram online simultaneously. Members can add comments based on specific reasons, cross-departmental collaboration feedback is synchronized in real time, and the entire analysis process is documented.
also supports exporting high-definition PNG, PDF, SVG and other formats, which can be directly inserted into quarterly review PPTs or root cause analysis reports, making improvement suggestions well-founded.
Below is a complete fishbone chart breakdown of " Q3 sales KPI not met":
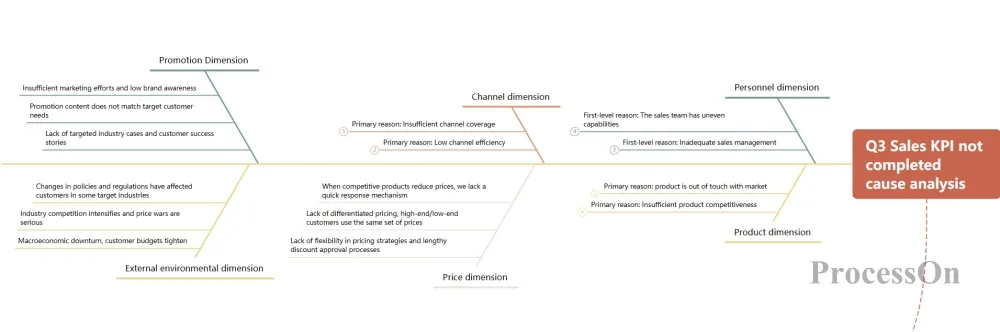
Analysis of the reasons for failing to meet the Q3 sales KPI (fishbone diagram)
The value of a fishbone diagram lies not in "drawing a pretty diagram," but in "finding areas for actionable improvement." From these root causes, a clear list of improvements can be generated:
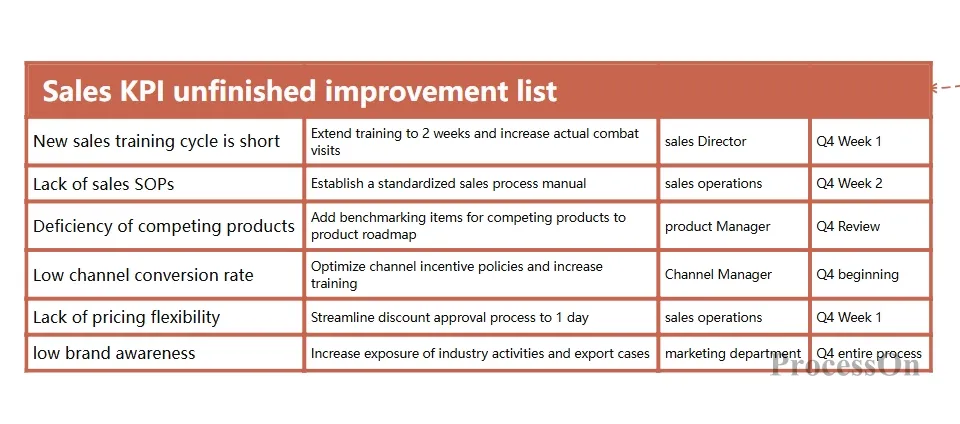
List of areas for improvement if sales KPIs are not met
1. Mistaking appearance for root cause: Stopping at the first level of "poor cue quality". The correct approach is to continue asking "why is the cue quality poor" until an actionable root cause is found.
2. Failure to verify hypotheses: Listing reasons without data verification and drawing conclusions based on guesswork. The correct approach is to verify with data (e.g., checking the CRM system to confirm that the lead quality is indeed poor).
3. Drawing diagrams without taking action: The root cause has been identified, but it hasn't been translated into an improvement plan or assigned responsibility. Analysis without implementation is no analysis at all.
4. Inappropriate dimensional division: The classification method is out of touch with actual business scenarios. An analytical framework suitable for this industry should be selected.
5. Missing key dimensions: The analysis only focused on "people" and "methods," neglecting product and channels. Use the 5M1E framework to ensure comprehensiveness and fill in any gaps.
It's not terrible to fail to meet KPIs; what's terrible is always attributing the reasons to "bad market conditions," "bad luck," or "insufficient manpower," without ever seriously asking "why."
The value of a fishbone diagram lies in the fact that it provides a systematic framework for thinking, forcing you to examine a problem from multiple dimensions, asking questions layer by layer until you find the root cause that you can take action to solve.
During the next quarterly review, instead of letting everyone freely express "what I think is the reason," put up a fishbone diagram on the wall and have everyone contribute reasons in each of the four dimensions: "people, machine, material, method, environment, and measurement." Then, ask "why" together. You'll find that the real problem is often hidden after the third or fourth level of questioning—and once you find it, the solution often becomes obvious.