Process Type
Graphical expression
Mind Type
Structured expression
Note Type
Efficient expression
Treemap
Bracket Diagram
Default Mode


In strategic planning and market analysis, we often need to answer the following question: What kind of macro environment are we in? What external opportunities and threats exist? These questions are directly related to the survival of a company. The PEST model is the most classic tool for answering these questions.
Whether you're an entrepreneur, product manager, marketing specialist, or a student writing a business plan, PEST analysis is an essential course you can't avoid. Today, we'll explain it thoroughly, from its concept, dimensions, usage, and differences from SWOT, to how to create charts using graphical tools.
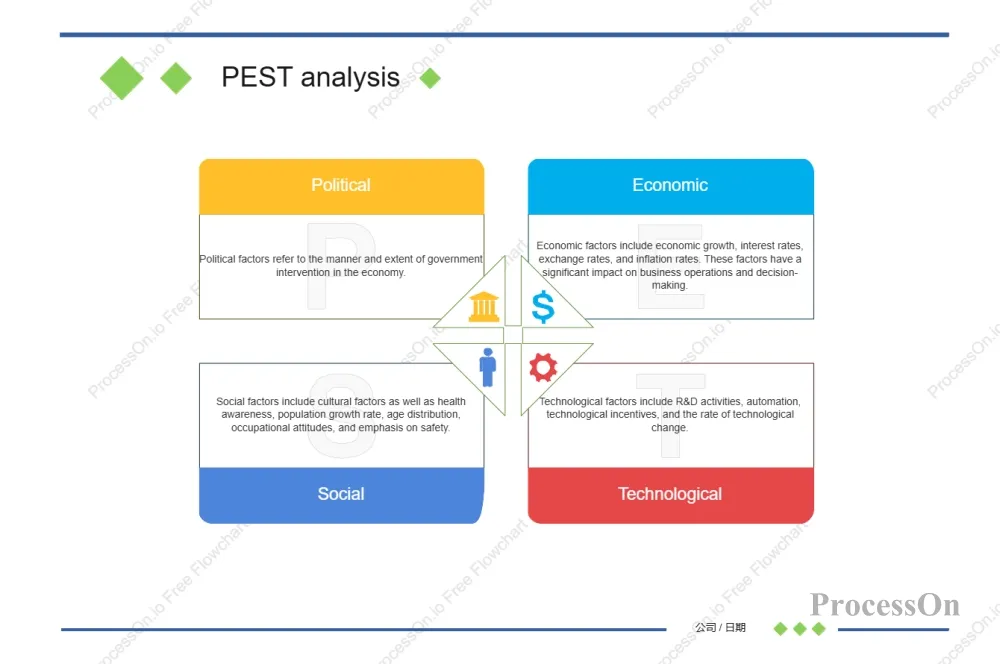
The PEST model is a macro-environmental analysis tool used to assess the impact of four key factors in the external environment on a company's strategy. The four letters in PEST represent:
Political
Economic
Social (Social Culture)
Technological
By systematically scanning these four dimensions, companies can identify opportunities and threats in the external environment, thereby making more rational strategic decisions.
PEST models are typically used for:
Feasibility analysis before entering a new market
Annual Strategic Plan
Competitor Analysis
Investment risk assessment
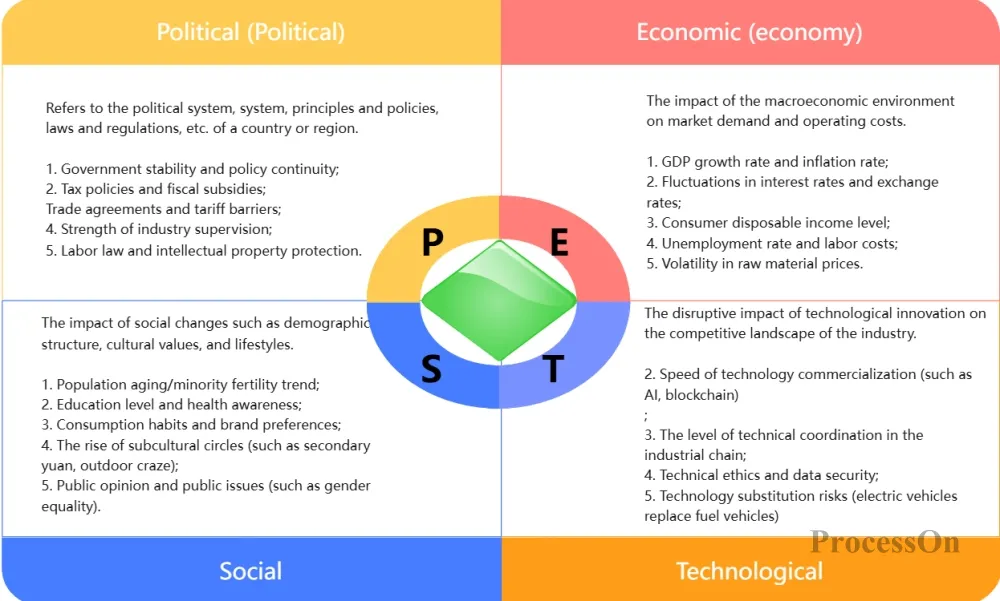
Political factors refer to the impact of government policies, laws and regulations, and political stability on business operations. Specifically, these include:
Tax policies (corporate income tax, value-added tax, etc.)
Trade restrictions (tariffs, import and export controls)
Labor Law (Minimum Wage, Working Hours Regulations)
Environmental regulations (emission standards, carbon tax)
Political stability (regime change, social unrest)
For example, when a new energy vehicle company enters the European market, it must consider the EU's carbon emission regulations and government subsidy policies.
Economic factors reflect the impact of the macroeconomic environment on enterprises, including:
Economic growth rate (GDP growth rate)
Inflation rate
Interest rates and exchange rates
unemployment rate
Residents' disposable income
Credit availability
For example, when inflation is high, consumer purchasing power declines, and the market for high-end consumer goods may shrink.
Sociocultural factors involve demographic characteristics, values, lifestyles, etc., including:
Population structure (aging population, birth rate)
Education level
Consumer habits (online shopping preference, environmental awareness)
health concept
Cultural values (individualism vs. collectivism)
For example, with increasing health awareness, the market for low-sugar and sugar-free beverages has expanded rapidly.
Technological factors refer to technological innovation, R&D investment, and technological infrastructure, including:
Emerging technologies (AI, blockchain, 5G)
R&D investment
Technology transfer speed
Intellectual Property Protection
level of automation
For example, the explosion of generative AI has changed the competitive landscape of the content creation industry.
PEST analysis typically follows these steps:
Define the object of your analysis: Is it a company? A product line? Or a new market?
Relevant information was collected extensively across four dimensions. Information sources included:
Government Statistics Bureau, Industry White Paper
Reports from professional consulting firms (such as McKinsey and iResearch).
News media, academic papers
Interviews with industry experts
The collected information is categorized into four dimensions: P, E, S, and T. Each factor records its current status and future trends.
Analyze whether the impact of each factor on the company is positive (opportunity) or negative (threat). For example:
Government subsidies for new energy (opportunity)
Population aging leads to rising labor costs (threat)
By integrating the analysis results, an overall assessment of the macro environment is obtained, and the strategic direction is adjusted accordingly.
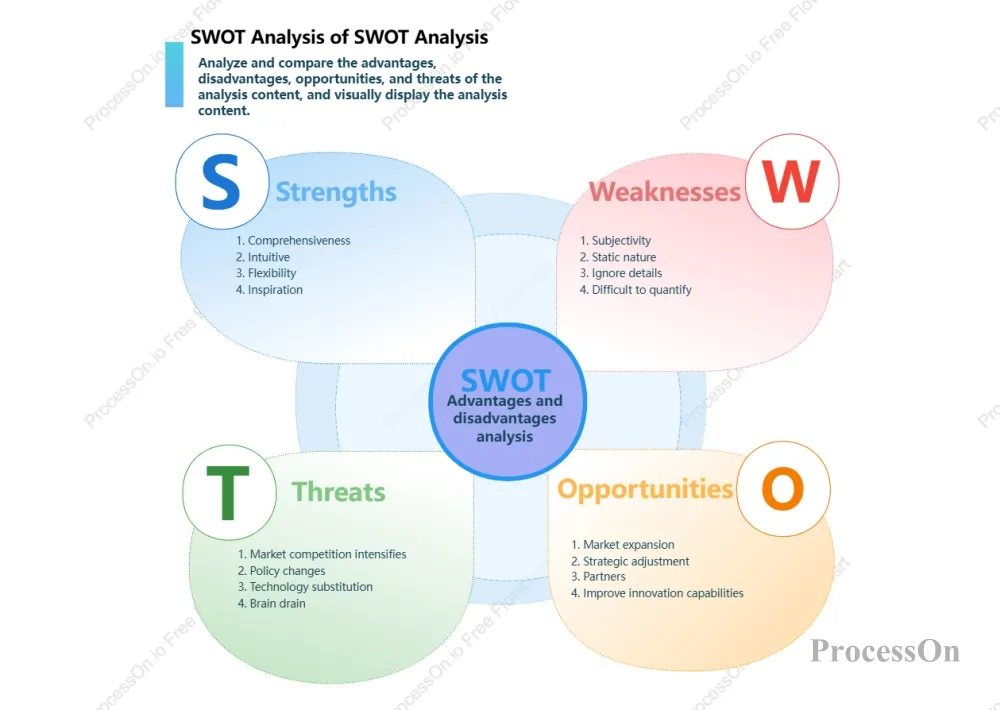
Both the PEST and SWOT models are commonly used tools in strategic analysis, but they focus on very different angles and have very different uses. They are complementary rather than substitutive.
The PEST model focuses on macro-environmental analysis, taking a completely outward perspective to help companies understand the overall landscape of the external world. It systematically scans four dimensions—Political, Economic, Social, and Technological—for factors that are beyond a company's control but profoundly impact its survival and development. Through PEST analysis, companies can identify opportunities and threats in the external environment, providing a macro-context for strategic decision-making.
The SWOT model, on the other hand, is a comprehensive strategic analysis framework that considers both internal and external factors. SWOT analysis focuses on a company's own strengths and weaknesses, as well as external opportunities and threats. Its core function is to combine internal and external factors to help companies leverage their strengths, address their weaknesses, meet external challenges, seize market opportunities, and thus formulate practical strategic solutions.
From an application perspective, PEST analysis typically precedes SWOT analysis. This is because the information for the "opportunities" and "threats" sections of SWOT analysis often originates from the results of PEST analysis. In other words, PEST provides SWOT with the "materials" of the external environment, while SWOT combines these materials with the company's internal conditions to ultimately form a complete strategic picture.
The key to creating a PEST model is to clearly present the four dimensions and their key factors, facilitating team discussion and reporting. A four-quadrant matrix diagram can be used to create the PEST model chart. Divide the canvas into four areas, labeling them P, E, S, and T respectively, and list the key factors in each area.
1. Open your ProcessOn profile page and create a new flowchart .
2. Divide the canvas into four quadrants . Write "P (Politics)" in the top left corner, "E (Economy)" in the top right corner, "S (Society)" in the bottom left corner, and "T (Technology)" in the bottom right corner . Add text boxes in each quadrant and list the factors one by one . Use colors to distinguish between opportunities (green) and threats (red), or add icons to enhance the visualization .
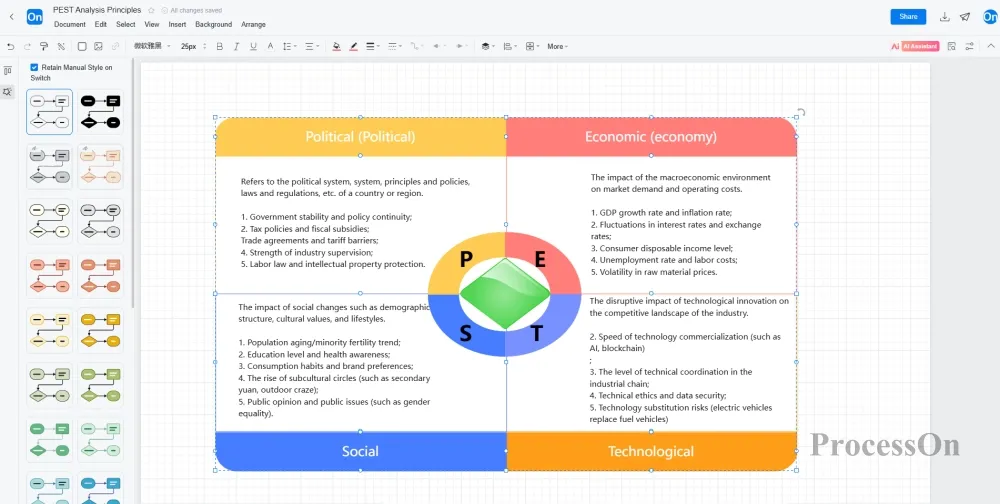
3. Once the drawing is complete, you can export it as an image or generate a link to share it with others.
The ProcessOn template community has a large number of PEST model templates published by users, which can be used to learn from case studies or to use templates.
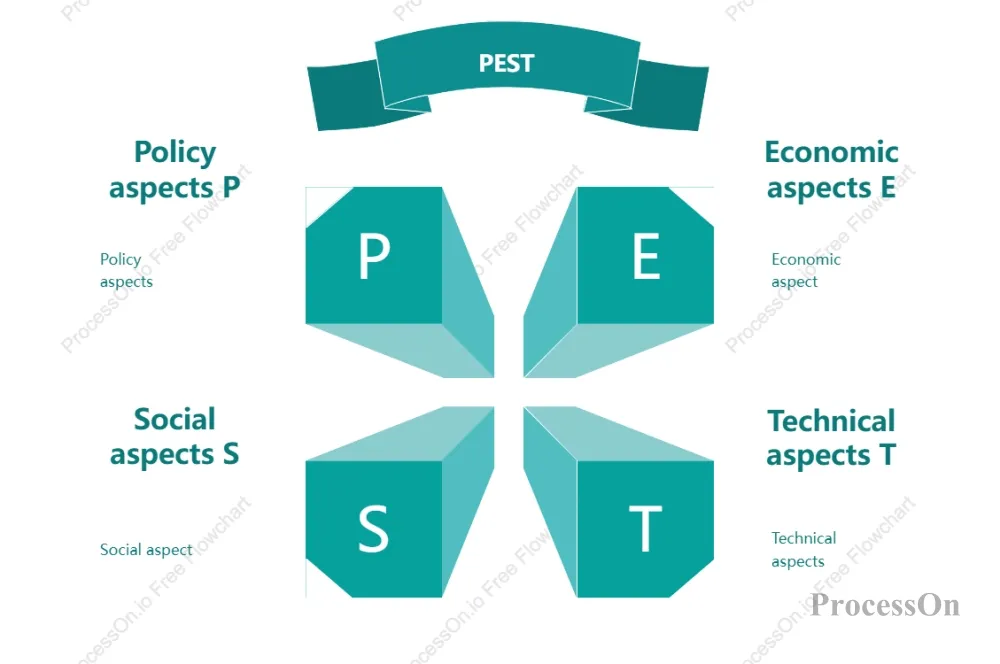
Beautiful PEST Analysis Model Template
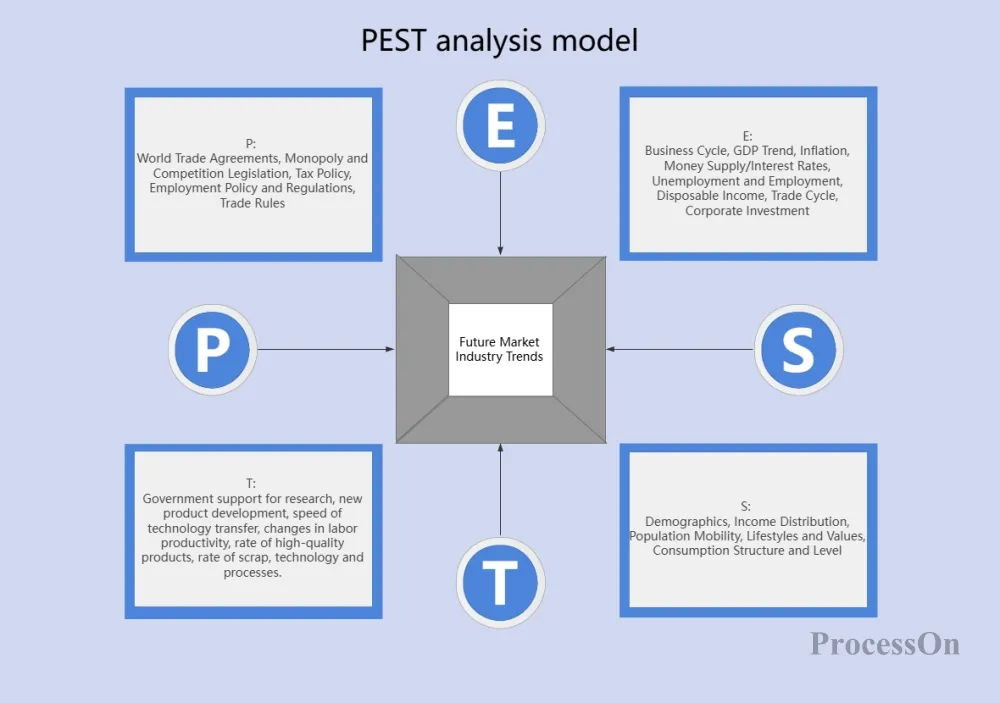
Future Market Industry PEST Analysis Model
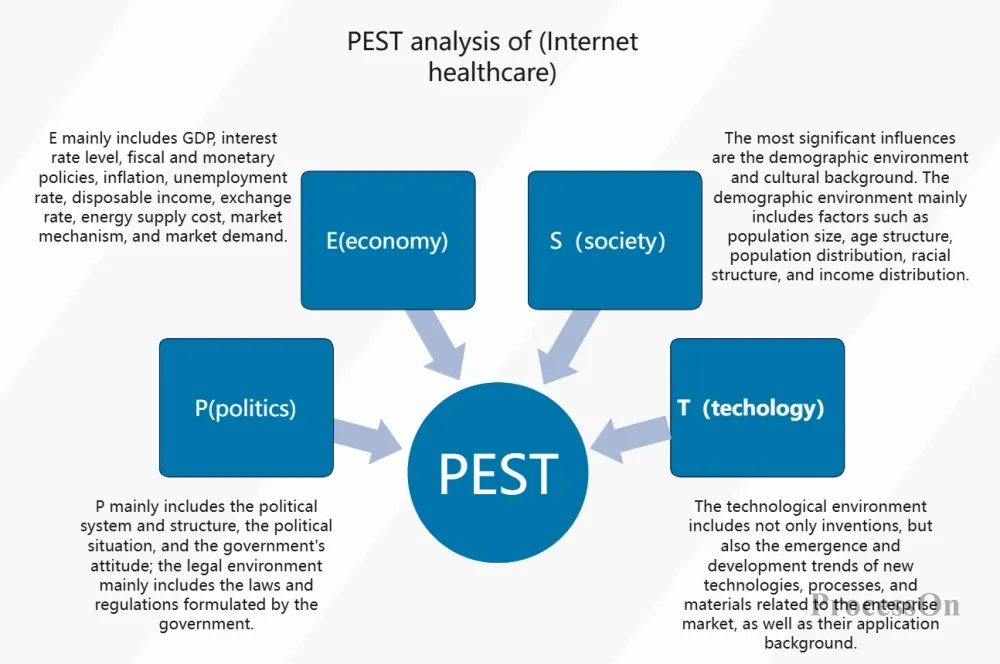
PEST Analysis of the Internet Healthcare Industry
The PEST model, though seemingly simple, contains profound strategic thinking. It forces us to step outside of daily operations and examine environmental changes from a higher perspective. A clear PEST chart enables the team to quickly reach a consensus, making decisions more informed.
The next time you face a strategic choice, try scanning the external environment with the PEST model first, and then combine it with SWOT to develop an action plan.