Process Type
Graphical expression
Mind Type
Structured expression
Note Type
Efficient expression
Treemap
Bracket Diagram
Default Mode


"This year I want to improve my skills."
"This quarter we need to increase user activity."
Do these words sound familiar? Almost every professional has set similar goals, but when it comes to reviewing their progress, they often find that these goals were either never started or were abandoned halfway through.
Where does the problem lie? It's not that the goal itself is wrong, but that the goal is too "vague." A vague goal is like a map without navigation; you know you want to go somewhere far away, but you don't know exactly where to go, how far to go, or when to arrive.
The SMART principle is like a navigator, helping you clarify vague goals. Today, we'll discuss this classic goal management tool and how to use charts to truly implement the SMART principle.
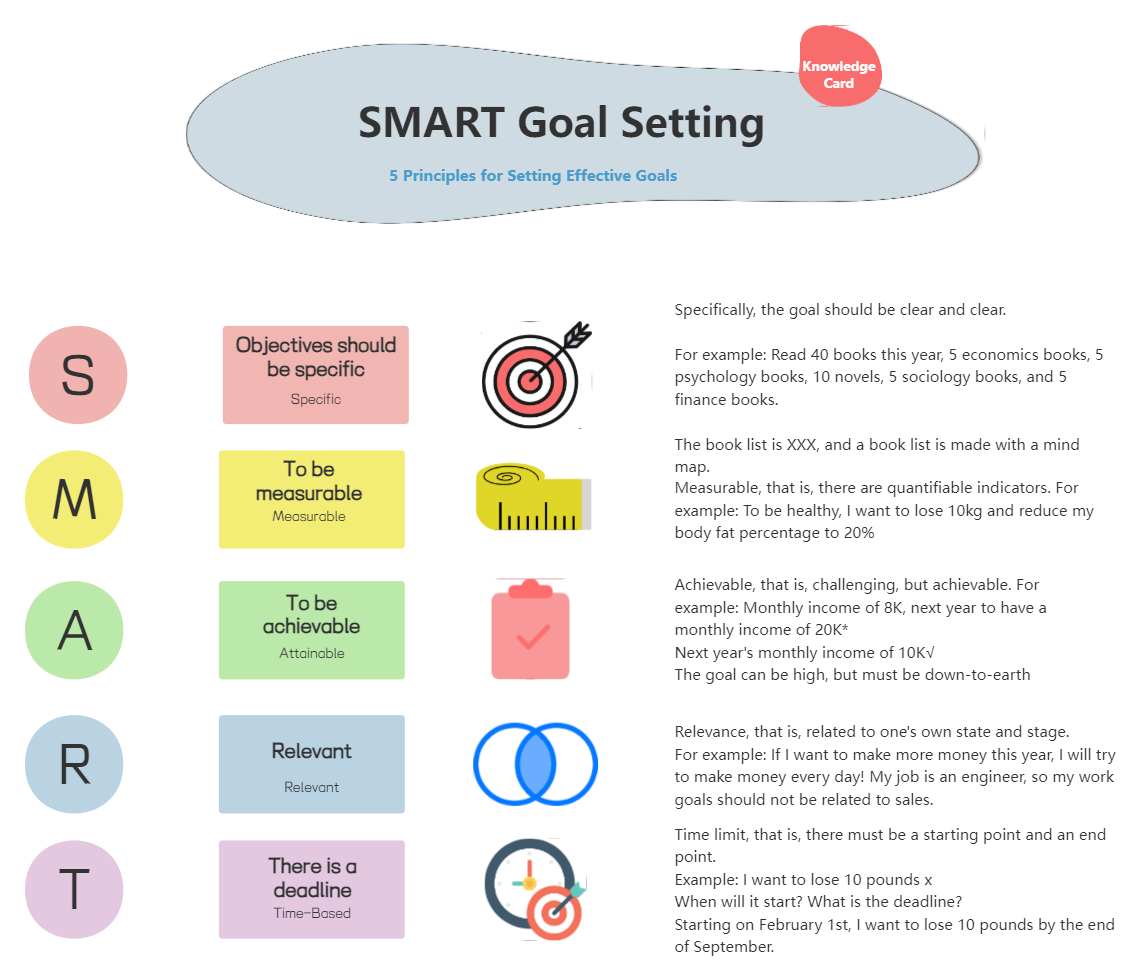
The SMART principle, first proposed by management guru Peter Drucker in his book *The Practice of Management*, is one of the most important principles in management by objectives. SMART is an acronym for five English words that represent five standards that should be followed when setting goals:
Specific: The goal must be clear and unambiguous, not vague.
Measurable: The goal should have quantifiable standards to determine whether it has been achieved.
Attainable: The goal must be within our capabilities, something we can reach with a little effort.
Relevant: The objective must be related to other objectives and cannot be isolated.
Time-bound: The goal must have a clear deadline.
This principle seems simple, but it's not easy to use effectively. Many people tend to skip one or two dimensions when setting goals, causing the goals to become distorted during execution. Next, we'll break down these five dimensions one by one and show you how to use charts to make each dimension concrete.
Incorrect example: "I want to improve my communication skills."
The problem with this goal is that communication skills encompass too many aspects—public speaking, written expression, cross-departmental collaboration, reporting upwards… So which one should we improve?
A good example: "I want to improve my communication skills in cross-departmental meetings to ensure that I can clearly convey the core message in every speech."
How can we use charts to make our goals more specific?
You can use a mind map to break down your goals. Put a large goal in the center, and then break it down into specific sub-goals layer by layer.
Taking "improving communication skills" as an example, it can be broken down as follows:
First level: Public speaking skills, written expression, cross-departmental collaboration, and reporting upwards.
The second layer: Cross-departmental collaboration can be further broken down into "needs alignment ability," "meeting facilitation ability," and "conflict resolution ability."
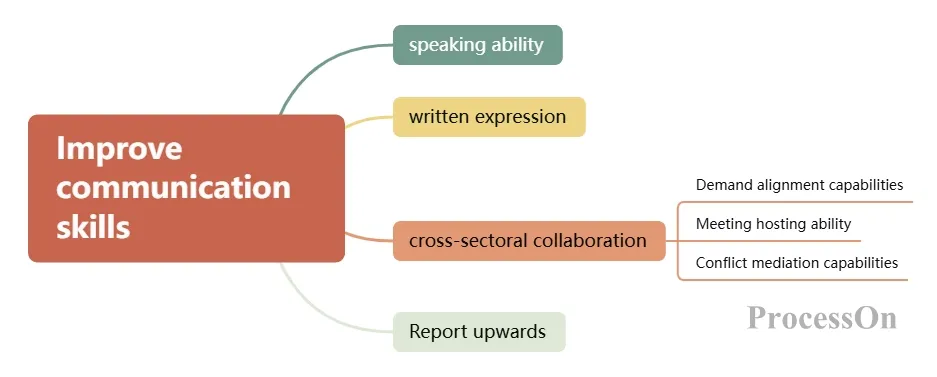
Once the goal is broken down to this level of granularity, you'll know where to start. In ProcessOn, using mind map templates, you can create a complete goal breakdown diagram in just 5 minutes.
Incorrect example: "Increase user activity".
The problem with this goal is: what does "improvement" mean? Is it an improvement of 1% or an improvement of 50%? Without a quantitative standard, it is impossible to judge whether it is a success or a failure.
Correct example: "Increase daily active users from 100,000 to 150,000, a growth rate of 50%."
How can we use charts to make goals measurable?
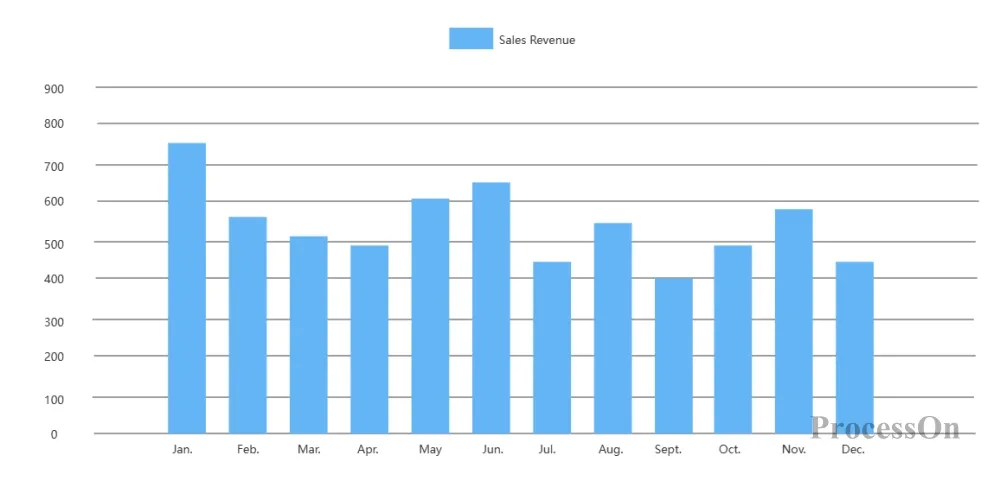
The most commonly used tools are trend charts or dashboards. Plot the target value as one line and the actual progress as another line to visually show the difference.
For example, you could create a bar chart showing performance targets from January to December , with the horizontal axis representing months and the vertical axis representing performance targets , and then update the actual data each month. This way, the team can immediately see how far we are from our goals and whether we are ahead of schedule or behind schedule.
Incorrect example: "Increase the daily active users of the app from 10,000 to 1 million within a month."
The problem with this goal is that it's unrealistic. Unless there are significant external incentives, this goal is highly likely to fail and damage team morale.
Correct example: "With existing resources, we can increase daily active users from 10,000 to 15,000 by optimizing user acquisition channels."
How can we use charts to assess whether a goal is achievable?
You can use Gantt charts or resource allocation charts to assess the feasibility of your goals. Break down the goal into specific tasks, estimate the time and resources required for each task, and then see if the total resources are within your budget.
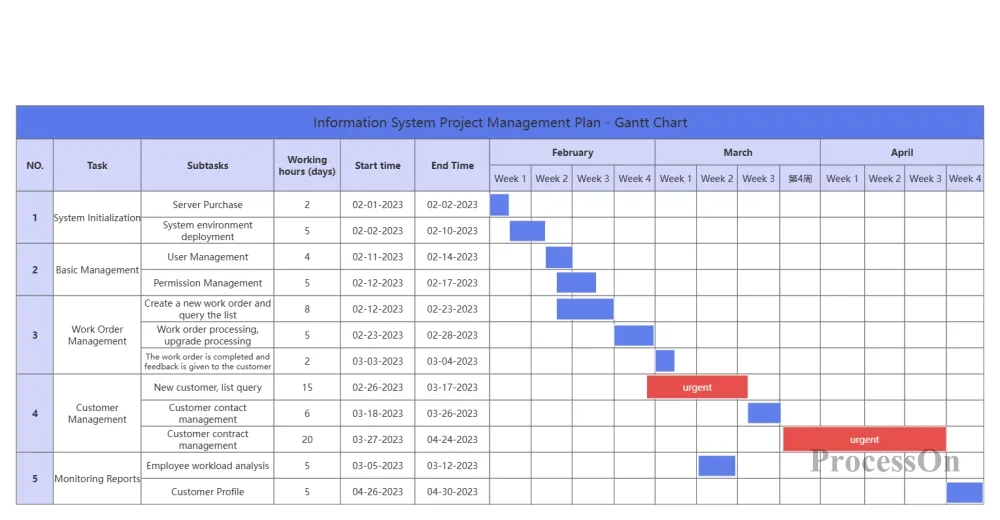
In ProcessOn, Gantt chart templates can help you quickly schedule tasks. Each task can be labeled with the responsible person, working hours, and dependencies, making the entire plan clear at a glance.
Wrong example: "I want to learn to play the guitar." (When your core job is data analysis)
The goal itself isn't wrong, but it's not relevant to your job responsibilities or team goals. In organizational management, individual goals need to be aligned with team goals, and team goals need to be aligned with company goals.
Correct example: "By learning new data analysis tools, we can improve processing efficiency and support the team's operational analysis needs in Q3."
How can we use charts to clarify the relationships between objectives?
The most classic tool is the goal alignment map or strategy map. It uses a tree structure to show the hierarchical breakdown from company goals to departmental goals and then to individual goals.
For example:
Company goal: 30% annual revenue growth.
Marketing Department Target: Generate 10,000 valid leads
Operations team goal: Increase lead conversion rate by 5%.
Personal goal: Optimize landing page copy and increase click-through rate by 2%.
By drawing these hierarchical levels using organizational charts or tree diagrams, everyone can clearly see how their work supports the company's overall goals. This sense of "seeing meaning" is a significant source of team motivation.
Incorrect example: "I need to complete the product requirements document."
The problem with this goal is that there is no deadline. "To be completed" could be a week later or six months later, so there is no sense of urgency.
Correct example: "Complete the product requirements document version 2.0 by June 30th and organize a review."
How can we use charts to reinforce the sense of time limits?
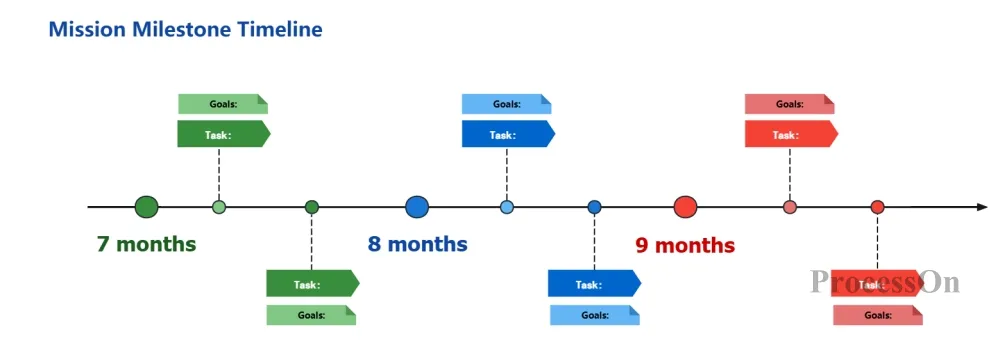
The most direct tool is a timeline or milestone chart. Mark each key milestone of the goal on a timeline to create a clear roadmap.
Plotting timelines on a timeline, with each milestone marked by color (green: completed, yellow: in progress, red: delayed), provides a more impactful visualization than documentation, allowing team members to quickly assess whether the project is progressing smoothly.
The SMART principle may seem simple, but its essence is a way of thinking—transforming vague desires into actionable tasks. This transformation process is the key step from "idea" to "action."
The value of a chart lies in its ability to visualize this transformation. A goal management action plan is not just a plan, but also a consensus and commitment within the team. It makes it clear to everyone: where we are going, how to get there, when we will arrive, and where we are now.
In ProcessOn, we have prepared a complete set of templates for SMART goal management: mind maps, Gantt charts, timelines, dashboards, goal alignment charts, etc. You can freely combine them according to your needs to quickly generate your own goal management battle plan.
Give it a try now. Set yourself a SMART goal and draw it out on a chart. You'll find that goal management isn't as difficult as you think.
 Following the tutorial to try
Free to use ProcessOn
Following the tutorial to try
Free to use ProcessOn