Process Type
Graphical expression
Mind Type
Structured expression
Note Type
Efficient expression
Treemap
Bracket Diagram
Default Mode
In the wave of digital transformation, the complexity of enterprise operations is increasing exponentially. From customer demand alignment and internal process collaboration to cross-departmental resource allocation, any ambiguity or chaos in any link can lead to inefficiency, increased costs, or even customer churn. Business process diagrams, as an intuitive visualization tool, are becoming a core means for enterprises to streamline business logic, optimize process efficiency, and improve collaboration capabilities. They are not only a "map" of business logic but also a "compass" for enterprise management decisions. This article will comprehensively analyze the value and application of business process diagrams, helping you master this efficient management tool.
A Business Process Diagram (BPD) is a tool that graphically represents the various stages, roles, tasks, and decision points in a business process. Through standardized symbols and clear logical lines, it transforms abstract business processes into intuitive and easy-to-understand visual representations, allowing participants to quickly grasp the overall picture and details of the process.
Unlike ordinary flowcharts, business process diagrams focus more on recreating business scenarios. They not only show the sequence of tasks but also clearly define the responsible parties, inputs and outputs, decision-making rules, and exception handling mechanisms for each step. This comprehensive presentation makes business process diagrams an important basis for cross-departmental communication, process optimization, and system development.
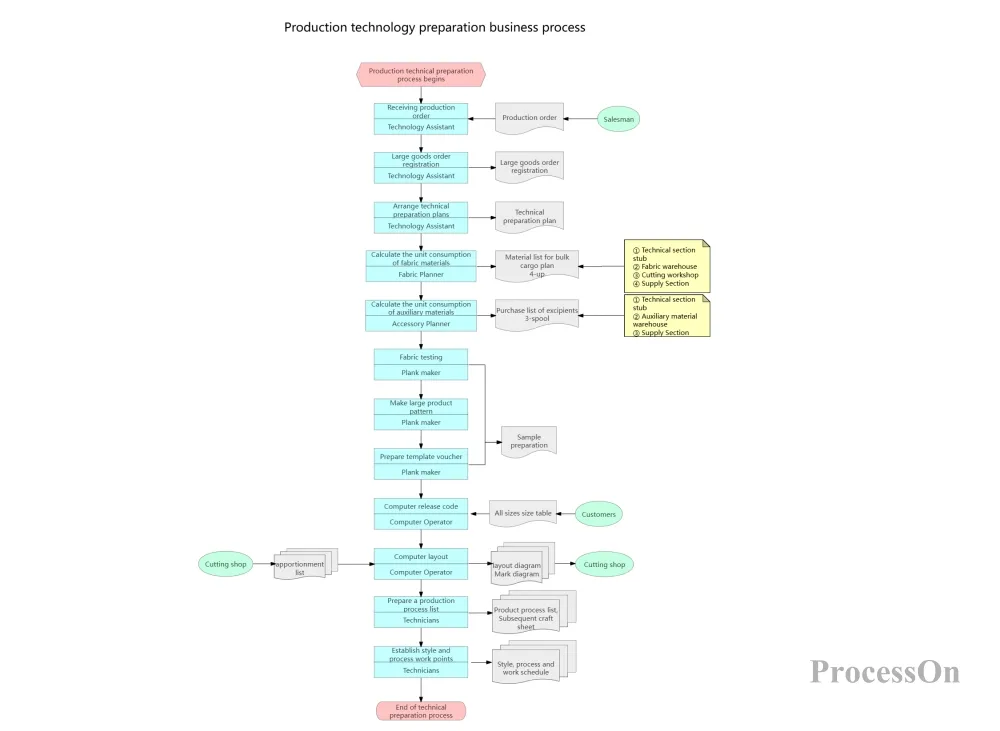
Production Technology Preparation Business Process Flowchart
The core principle of business process diagrams originates from process analysis methods in the field of industrial engineering, and can be traced back to the scientific management movement of the early 20th century. At that time, Frederick Taylor proposed the concept of standardized operating procedures through the analysis of worker operation processes, which was the prototype of business process diagrams.
With the development of enterprise management theory, the application scope of business process diagrams has been continuously expanding. In the 1980s, Michael Hammer's Business Process Reengineering (BPR) theory made business process diagrams a core tool for enterprise transformation. In the digital age, with the introduction of the BPMN (Business Process Modeling and Symbolic Method) standard, the standardization of business process diagrams has been further improved, becoming an important support for enterprise digital transformation.
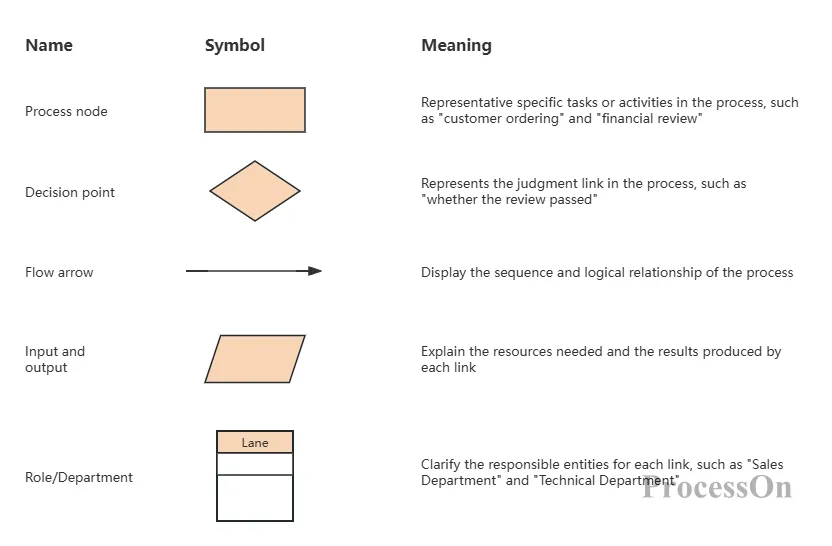
Although business process diagrams may take different forms in different scenarios, they typically include the following core elements:
These professional diagrams can be easily created using tools like ProcessOn, an online graphical representation tool that supports various diagram types such as flowcharts, mind maps, and UML diagrams. It has a wealth of built-in business process diagram templates that users can reuse directly or modify according to their needs, greatly reducing the barrier to creating flowcharts.
In traditional enterprise management models, business processes often suffer from the following pain points:
Ambiguous processes : Inconsistent understanding of the processes among employees leads to deviations in execution.
Poor communication : Information transmission is distorted during cross-departmental collaboration, leading to inefficiency.
Redundant steps : Unnecessary duplication of work in the process increases operating costs.
Risk out of control : Lack of monitoring of key processes led to frequent risk events.
Business process diagrams are an effective tool for addressing these pain points. By visualizing business processes, companies can clearly see each step in the process, identify existing problems and areas for optimization, thereby achieving standardization, normalization, and efficiency in the process.
Business process diagrams improve work efficiency primarily in the following ways:
Reduce communication costs : A unified, visual representation of processes allows employees from different departments to quickly understand each other's work content and collaboration methods, avoiding communication barriers caused by information asymmetry.
Reduce training costs : New employees can quickly understand work processes through business process diagrams, shortening the training cycle and enabling them to integrate into the job more quickly.
Improved execution efficiency : Standardized processes clarify the operational procedures and time requirements for each step, reducing unnecessary waiting and repetitive work.
Enhanced collaboration : Clear process division of labor allows each department to understand its responsibilities and collaboration milestones, improving the efficiency and quality of cross-departmental collaboration.
Business process diagrams are not only tools for daily operations, but also crucial support for corporate decision-making and strategy implementation. Through the visual analysis of business processes, corporate managers can:
Identify process bottlenecks : pinpoint the key steps affecting overall efficiency and optimize them accordingly.
Assess process risks : Identify potential risks within the process and develop corresponding control measures.
Optimize resource allocation : Rationally allocate human, material, and financial resources according to process requirements.
Supporting strategy implementation : Decomposing the company's strategic goals into specific processes and tasks to ensure the effective execution of the strategy.
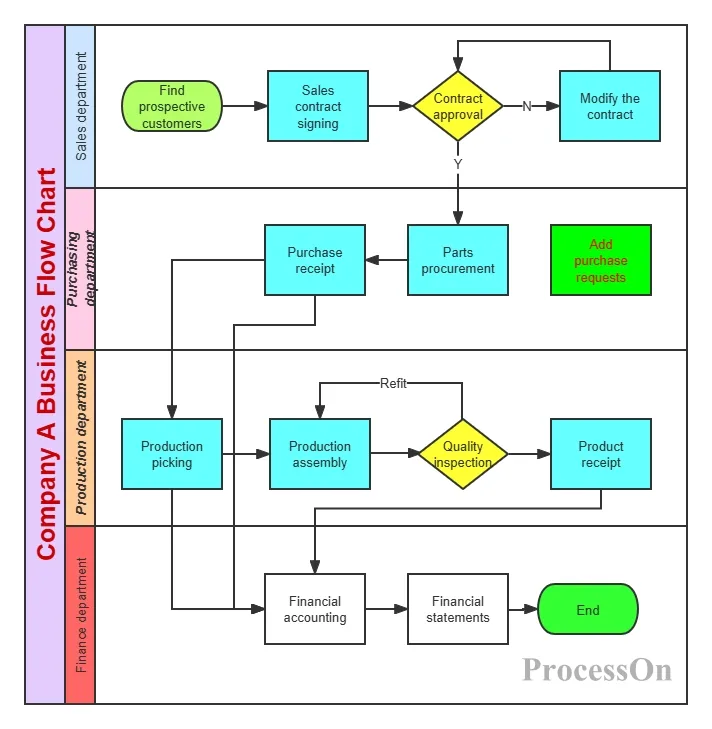
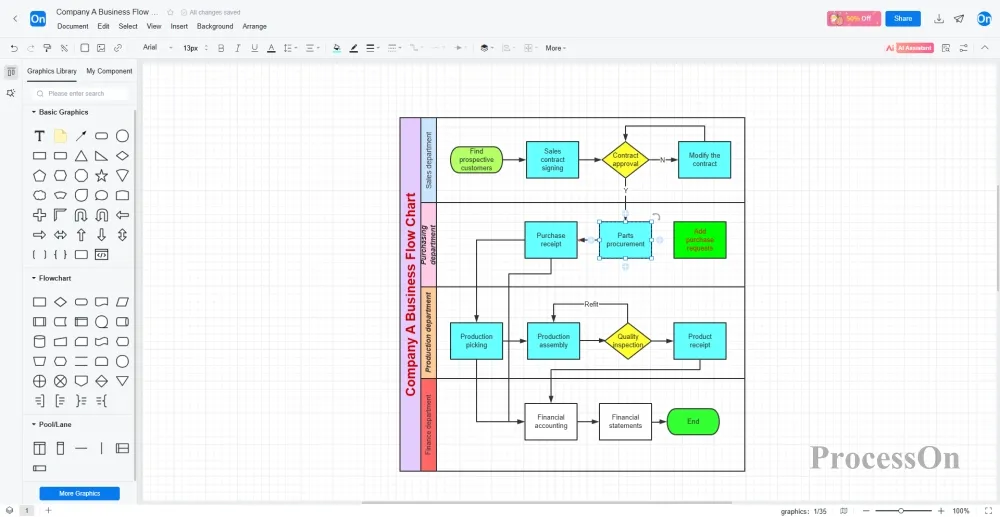
Company A's Business Process Diagram
The financial industry is one of the most widespread applications of business process diagrams, especially in areas such as transaction processing and risk control. Taking local money transfers as an example, the process typically includes the following steps:
Customer initiates transfer request : Customers initiate transfer requests through bank counters, online banking, or mobile banking.
Preliminary review : The system performs a preliminary verification of the transfer information, including account validity and balance adequacy.
Compliance assessment : Conduct risk assessments on transfer transactions to identify potential fraud risks.
Transaction processing : Fund transfers are completed through the local clearing system.
Second review: Staff will conduct a second review and compliance assessment of the transfer information.
Accounting procedures : Complete the accounting for the relevant accounts.
Print vouchers : Print business vouchers and archive transaction information for easy retrieval and auditing later.
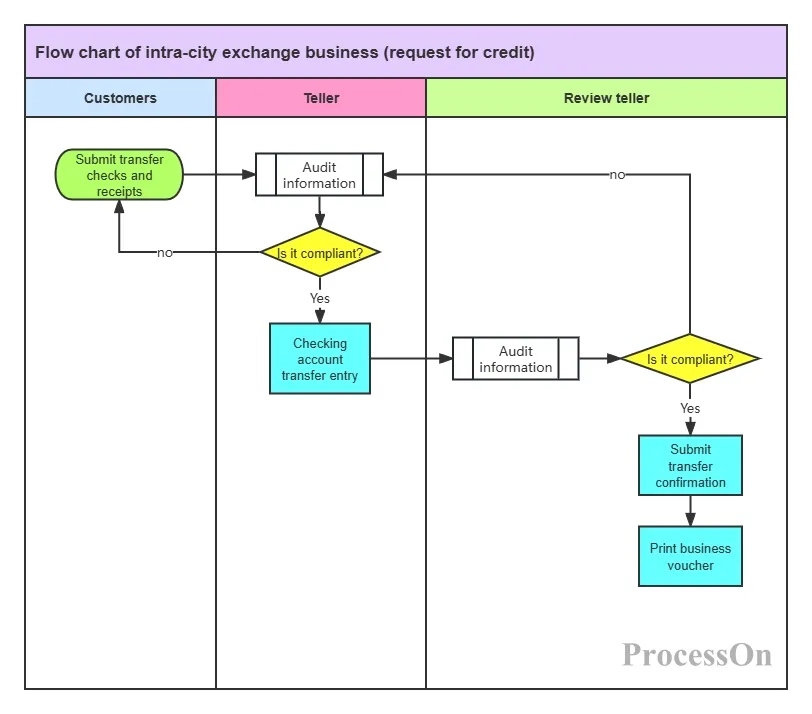
Same-city money transfer process flowchart
By using business process diagrams, banks can clearly illustrate each step of the transfer process, clarify the responsibilities and collaborative relationships of each department, and ensure the accuracy and security of transaction processing. At the same time, it also facilitates the identification of risk points in the process and the development of corresponding risk control measures.
In the internet industry, requirements management is a core aspect of product development. Business process diagrams help teams clearly outline the entire process from requirement initiation to implementation. Typical requirement business processes include:
Requirements gathering : Gathering requirements information from users, the market, internal teams, and other channels.
Requirements Analysis : Analyze and evaluate the collected requirements to determine their feasibility and priority.
Requirements Review : Organize relevant personnel to review the requirements to ensure their rationality and completeness.
Requirements development : Transforming requirements into product design and development tasks, and assigning the development team to implement them.
Testing and Verification : Conduct testing and verification on the completed functions to ensure they meet the requirements.
Release : Features that have passed testing will be released to users.
Feedback and Iteration : Collect user feedback to continuously optimize and iterate the product.
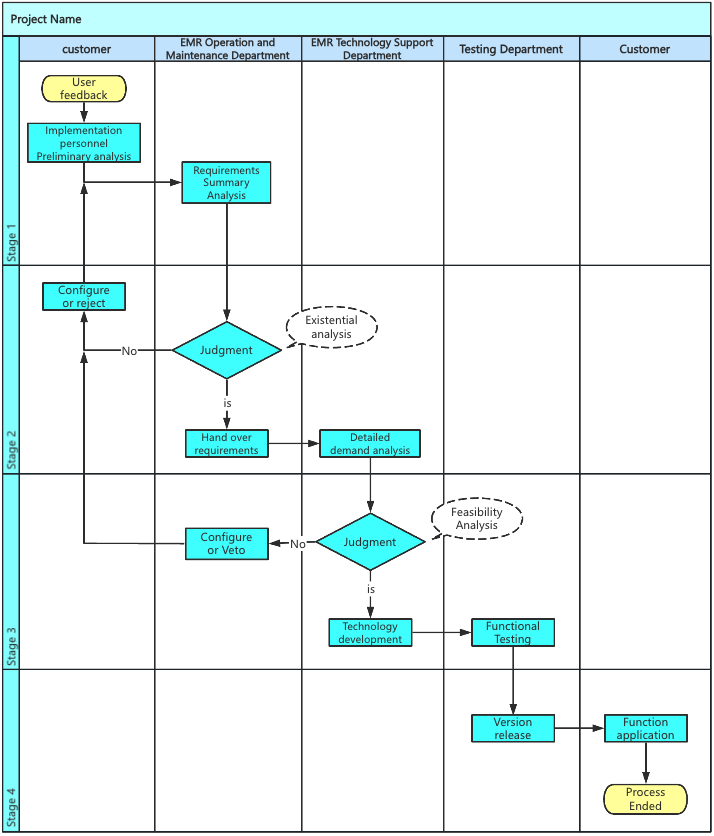
Requirements business process diagram
By using business process diagrams, internet companies can standardize and regulate demand management, improve the efficiency and quality of demand processing, and ensure that product development can quickly respond to market demands.
Manufacturing processes typically involve multiple stages and departments, and business process diagrams can help companies achieve visual management of these processes. Typical production business processes include:
Order Review : Review and receive customer orders, confirm order requirements and delivery time.
Production planning : Develop production plans and allocate production resources based on order demand.
Material procurement : Procuring the necessary raw materials and components according to the production plan.
Production and processing : Processing and assembling products according to production processes.
Quality inspection : Conduct quality inspections on completed products to ensure they meet quality standards.
Packaging and Warehousing : Pack qualified products and store them in the warehouse.
Shipping and Delivery : Ship products to customers according to order requirements.
After-sales service : Providing after-sales support and services for products.

Product manufacturing process flowchart
By using business process diagrams, manufacturing companies can optimize production processes, shorten production cycles, and improve production efficiency and product quality. At the same time, it facilitates the monitoring and management of the production process, enabling the timely identification and resolution of problems encountered during production.
Use swimlane diagrams appropriately : For processes involving multiple departments or roles, swimlane diagrams can more clearly show the responsibilities and collaborative relationships of each role, avoiding process confusion.
Add detailed descriptions : Add necessary explanatory text to the flowchart to explain the specific content, inputs, outputs, and decision rules of each process node, thereby improving the readability of the flowchart.
Use color coding : Different colors are used to distinguish different types of process nodes or states, such as green for normal processes, red for exception handling, and blue for decision points.
Layered presentation of complex processes : For overly complex processes, a layered presentation approach can be used, first showing the top-level process and then gradually expanding the detailed processes to avoid information overload.
Mark key performance indicators : Mark key performance indicators in the flowchart, such as processing time and success rate, to facilitate subsequent process analysis and optimization.
Incomplete process : Omitting certain important process steps or exception handling situations results in the flowchart failing to accurately reflect the actual business. The solution is to conduct thorough business research before drawing the flowchart, ensuring that all possible scenarios are covered.
Logical errors : Incorrect order or logical relationships among process nodes prevent the flowchart from correctly guiding business execution. The solution is to conduct multiple reviews after completion and invite relevant business personnel for verification.
Non-standard symbol usage : Using non-standard or incorrect symbols to represent process nodes makes the flowchart difficult to understand. The solution is to follow standards and specifications such as BPMN and use a unified symbol system.
Information overload : Adding too much detail to the flowchart makes it overly complex and difficult to read. The solution is to reasonably control the level of detail in the flowchart, and use a layered presentation when necessary.
Lack of maintenance and updates : Flowcharts are not updated promptly after creation, leading to a disconnect from actual business operations. The solution is to establish a flowchart maintenance mechanism, regularly reviewing and updating flowcharts.
Full participation : Invite relevant business personnel to participate in the creation and review of flowcharts to ensure that the flowcharts accurately reflect actual business operations.
Continuous optimization : Use business process diagrams as a tool for process optimization, regularly analyze and evaluate processes, and continuously improve process efficiency and quality.
Integrating digital tools : Using online tools such as ProcessOn to create and manage business process diagrams enables team collaboration, version control, and dynamic process management.
Training and Promotion : Provide training to employees on the use of business process diagrams to improve their understanding and application of these diagrams, ensuring their effective implementation.
Integration with other management tools : Integrate business process diagrams with systems such as ERP, CRM, and BPMS to achieve automated and intelligent process management.
ProcessOn, a professional online graphical tool, provides robust support for the creation and management of business process diagrams. Users can simply visit the official website to choose a suitable template or start creating a flowchart from a blank canvas. Through simple operations such as dragging and dropping graphic elements, connecting lines, and adding text, users can quickly create professional business process diagrams. Furthermore, ProcessOn supports team collaboration, real-time saving, and exporting in multiple formats, greatly improving the efficiency of flowchart creation and management convenience.
Business process diagrams, as an intuitive visualization tool, have become one of the core means of enterprise management and operations. They not only help enterprises clarify business logic and optimize process efficiency, but also promote cross-departmental collaboration, support management decisions, and provide important support for enterprises' digital transformation.
In practical applications, enterprises should rationally select and use business process diagrams based on their own business needs and characteristics, and continuously optimize their process management level by combining them with professional tools such as ProcessOn. At the same time, it is crucial to focus on the continuous maintenance and updating of process diagrams to ensure they remain consistent with actual business operations and truly realize their value.
If you haven't used business process diagrams before, you might want to try using ProcessOn to create your own. Start by outlining a simple business process, and gradually improve your company's process management capabilities to drive efficient operation and sustainable development.