Process Type
Graphical expression
Mind Type
Structured expression
Note Type
Efficient expression
Treemap
Bracket Diagram
Default Mode
In the fields of software development and algorithm design, program flowcharts are one of the most classic and intuitive tools for describing logic. Whether you are a beginner programmer or an experienced software engineer, you cannot do without them: use them to organize your thoughts when designing algorithms, use them to communicate logic during code reviews, and use them to lower the barrier to understanding during teaching demonstrations.
So, what is a program flowchart? What standard symbols does it contain? How do you draw a clear and standardized flowchart? This article will systematically explain the basic knowledge, structure , and template examples of program flowcharts , enabling you to master the content of program flowcharts.
A program flowchart is a graphical representation of the execution steps of an algorithm or program. It uses standardized geometric symbols to describe the order of operations, branching conditions, loop control, and input/output. Flowcharts allow us to "visualize" complex code logic, making it easier to identify logical errors and optimize the code structure.
Compared to other visualization tools, flowcharts have a unique positioning: they are more intuitive than pseudocode and more concise than UML activity diagrams, making them particularly suitable for quickly outlining logic and showcasing core processes. These professional diagrams can be easily created using tools like ProcessOn, an online graphical representation tool that supports various diagram types such as flowcharts, mind maps, and UML diagrams, helping users quickly organize their thoughts, visualize complex information, and improve communication efficiency.
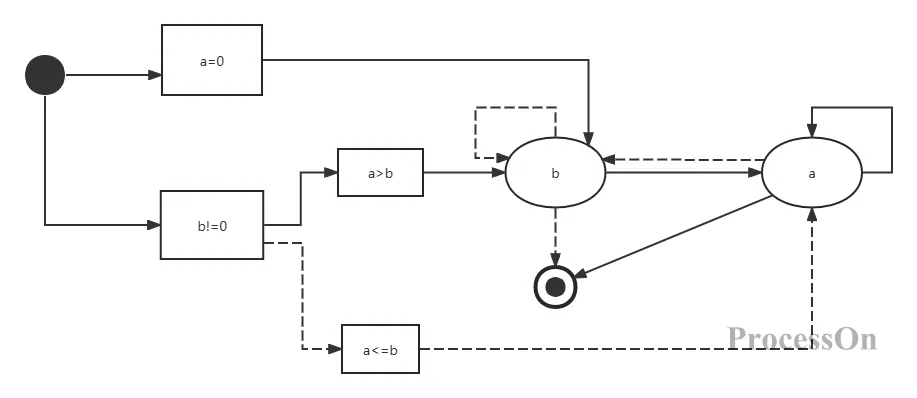
Program Flowchart Basic Template
This template demonstrates typical program logic including variable initialization, conditional statements, and loop operations, clearly illustrating the three basic structures of a program flowchart: a=0 is the sequentially executed initialization operation; b!=0 , a>b, etc., are branch decision nodes; and the self-loop after operation a demonstrates the application of loop structures. Through this visual representation, the originally abstract code logic becomes readily apparent.
The International Organization for Standardization (ISO) and ANSI have established commonly used symbols for flowcharts. Below are some of the most essential symbols for process flowcharts:
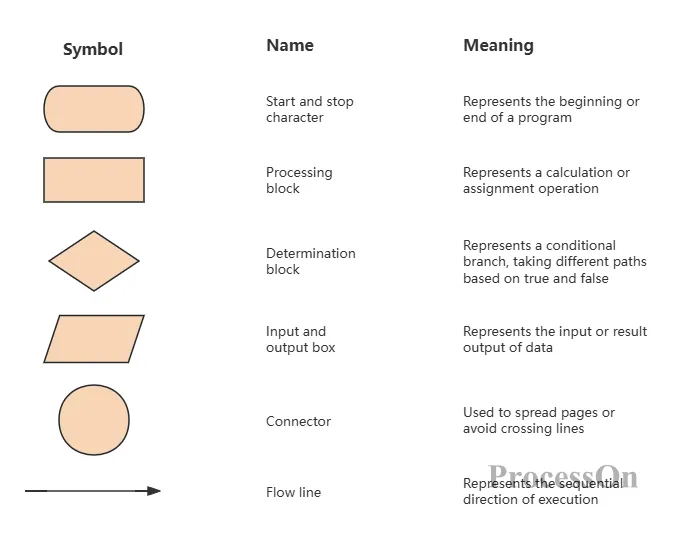
In addition, there are subroutine (pre-processed) symbols (rectangles with vertical lines on the left and right) used to call subroutines, and comment symbols (curly braces) used to add explanations. Mastering these symbols allows you to draw most program flowcharts.
Any program logic can be composed of three basic structures: sequential structure, selection structure, and loop structure.
The code is executed sequentially according to its order of writing. In the flowchart, it is represented by a series of processing boxes connected by arrows from top to bottom.
Execute different branches based on conditions. These include:
Single branch (if): Execute an operation if the condition is true, otherwise skip.
Two-branch (if-else): The true and false statements each take a different path.
Multiple branches (switch-case): Multiple condition values correspond to different operations.
In the flowchart, diamond decision boxes are used to represent true branches, labeled "Yes" or "Y", and false branches are labeled "No" or "N".
Repeatedly execute a block of code until a condition is no longer met. Includes:
While loop: First, the condition is evaluated, then the loop body is executed.
Do-while loop: The loop body is executed once before the condition is evaluated.
Counting loop (for): Specifies the number of iterations.
In flowcharts, loops are usually represented by decision boxes with return lines.
In the process of software development and system design, the practical value of program flowcharts is reflected in many aspects. It is not only a tool, but also a way of thinking and a language of communication.
First, flowcharts are an important tool for clarifying thought processes. Before writing code, drawing a flowchart helps developers clarify logical relationships and avoid logical confusion or omissions. Especially when dealing with complex business logic, flowcharts allow developers to examine the entire process from a global perspective and identify potential logical flaws in advance.
Secondly, flowcharts serve as a "common language" for team collaboration. In collaborative projects, members with different roles (such as product managers, developers, and test engineers) can quickly understand each other's thinking through flowcharts, reducing communication costs. Product managers can use flowcharts to express requirement logic, developers can use flowcharts to demonstrate implementation solutions, and test engineers can design test cases based on flowcharts.
Third, flowcharts are an effective way to preserve and pass on knowledge. For complex systems or business processes, flowcharts can serve as part of documentation, helping new members quickly understand the system logic. During project handover or personnel changes, flowcharts enable new members to get started quickly, reducing learning costs.
Furthermore, program flowcharts play a crucial role in the debugging and optimization phases. When bugs occur, developers can refer to the flowcharts to troubleshoot step by step and quickly locate the problem. During the performance optimization phase, flowcharts help developers identify bottlenecks in the process and find directions for optimization.
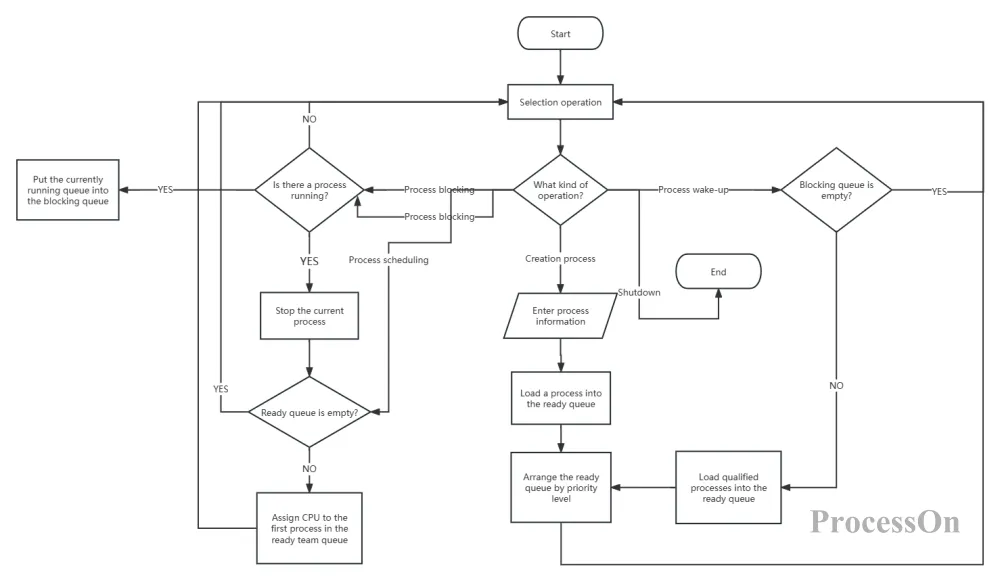
Process Management Program Flowchart
This process management flowchart demonstrates the value of program flowcharts in the design of complex systems. Through clear branching and looping structures, it visualizes complex operations such as process creation, waking, and scheduling, allowing team members to quickly understand the logic of the entire process management system. In real-world projects, such flowcharts can serve as a core part of system design documentation, guiding development, testing, and maintenance efforts.
As a visualization tool, program flowcharts have unique advantages, but they also have certain limitations. Understanding these characteristics will help us use them appropriately in our work.
The main advantages of program flowcharts include:
Intuitive and easy to understand : Through standardized graphic symbols, even non-technical personnel can quickly understand the process logic, reducing the communication threshold.
Clear logic : It forces developers to organize a clear logical structure to avoid messy or redundant code.
Easy to modify : When requirements change, the flowchart can be quickly modified, helping developers assess the impact of the changes on the entire process.
High versatility : It is applicable to various fields and scenarios, from simple business processes to complex system designs.
However, program flowcharts also have some limitations:
Difficult to represent complex systems : For complex systems with many branches and loops, flowcharts may become too large and complex, which reduces readability.
Lack of detail : Flowcharts mainly show the logical structure but cannot reflect the specific implementation details of the code, such as variable types and algorithm complexity.
High maintenance costs : When the system changes frequently, the flowchart needs to be updated synchronously, otherwise it will become disconnected from the actual code and lose its reference value.
Potential limitations on thinking : Over-reliance on flowcharts may limit developers' creative thinking, especially in scenarios requiring flexibility.
In practical applications, we need to choose the appropriate tools based on the specific scenario. For simple processes or scenarios requiring rapid communication, program flowcharts are the best choice; for complex system designs, it may be necessary to combine them with other tools such as UML diagrams and architecture diagrams; and for scenarios that require displaying code details, pseudocode or comments may be more suitable.
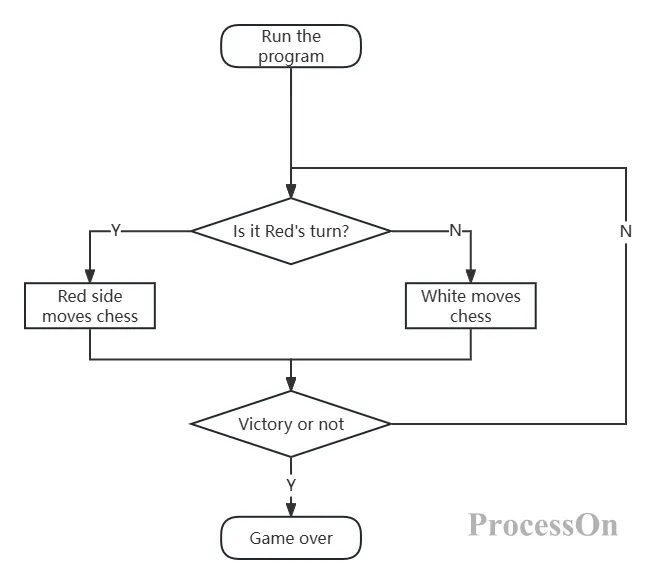
Flowchart of a chess game program
This board game flowchart demonstrates the advantages of flowcharts in simple scenarios: clear logic, intuitive and easy to understand, allowing even those without programming experience to quickly grasp the game's mechanics. However, for more complex game systems, including AI algorithms and multiplayer interactions, simple flowcharts are insufficient, requiring the use of other tools to showcase more details.
Program flowcharts are a fundamental skill for programmers and an indispensable communication language in software engineering. Mastering them will enable you to express logic more clearly, collaborate more efficiently, and design programs more elegantly.
Now, open ProcessOn and create your first program flowchart. Whether it's bubble sort, the recursive Tower of Hanoi, or the business logic you're writing, everything can be made clear with just one or two diagrams. Let flowcharts become a powerful tool in your programming toolbox!