Process Type
Graphical expression
Mind Type
Structured expression
Note Type
Efficient expression
Treemap
Bracket Diagram
Default Mode


In investment analysis, corporate management, and even personal finance, we often hear the term "Return on Equity" (ROE). It is a core indicator for measuring shareholder returns, but a simple ROE figure cannot tell you why a company makes money. Is it due to high profit margins, high turnover rates, or high leverage? The answer lies in DuPont analysis.
DuPont analysis is an analytical method that breaks down ROE into multiple financial ratios. First used by DuPont in the 1920s, it remains an essential analytical tool for financial professionals and business managers worldwide. Like a "financial microscope," it helps you see the true source of a company's profitability, identify risks, and discover areas for improvement.
Today, we will give a comprehensive explanation of the core logic, decomposition steps, and practical application cases of the DuPont analysis method, making the data clear at a glance.
DuPont analysis, also known as the DuPont identity, is an analytical method that decomposes return on equity (ROE) into multiple financial ratios. Its core idea is that a company's profitability is not determined by a single factor, but is driven by a combination of profitability, operational efficiency, and financial leverage.
The traditional formula for calculating ROE is very simple:
ROE = Net Profit / Net Assets
However, this formula only tells you the result, not the reason. DuPont analysis breaks it down as follows:
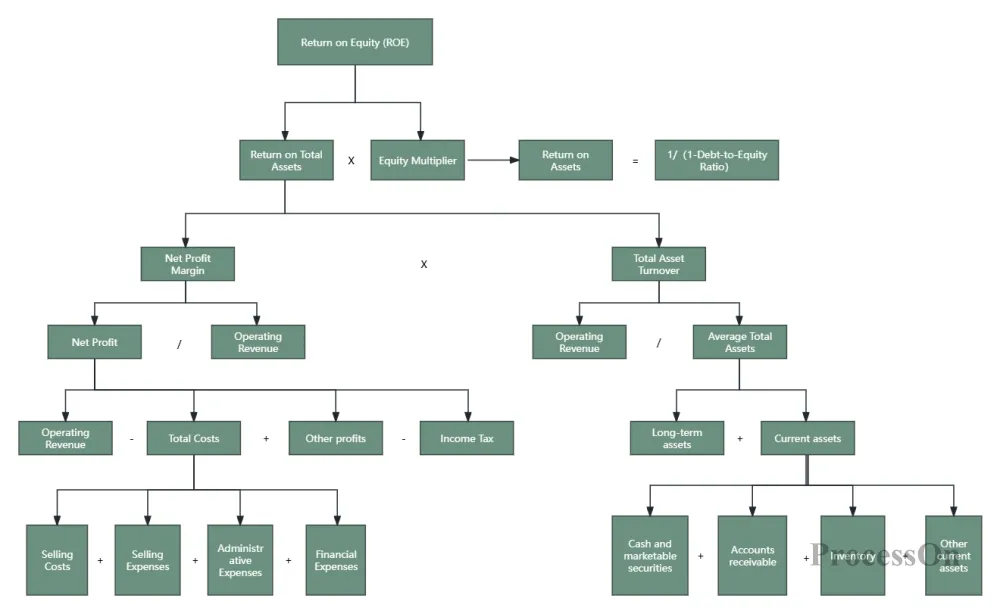
ROE = (Net Profit / Revenue) × (Revenue / Total Assets) × (Total Assets / Net Assets)
Right now:
ROE = Net Profit Margin × Total Asset Turnover × Equity Multiplier
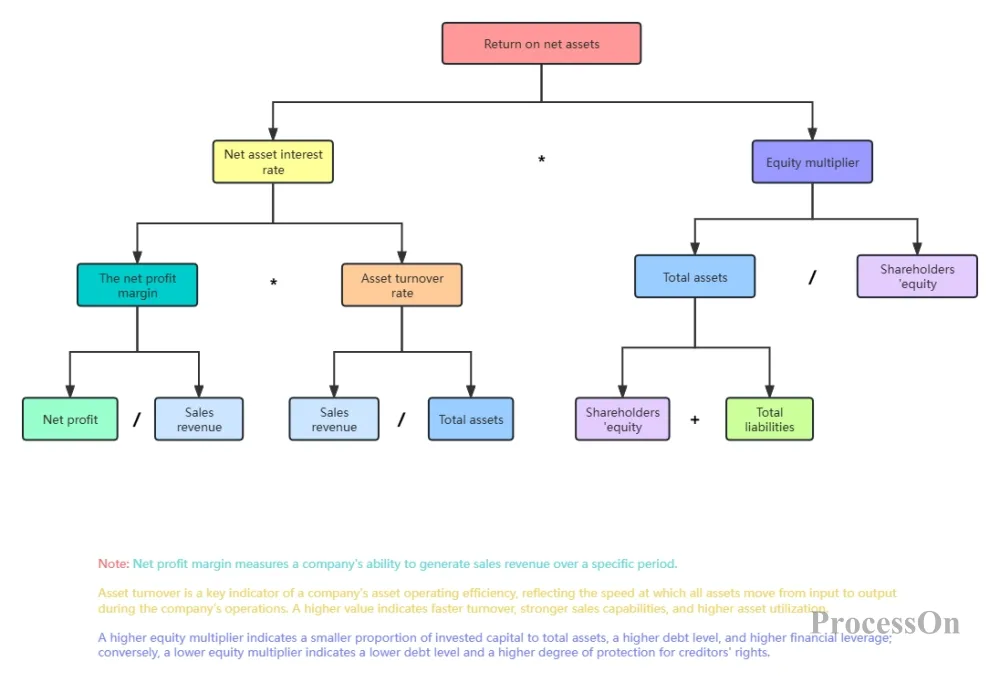
Net profit margin: Measures how much net profit can be generated from each dollar of revenue, reflecting the product's profitability and cost control level.
Total asset turnover: measures the efficiency of asset utilization, i.e. how much revenue can be generated from each unit of asset.
Equity multiplier: Measures financial leverage, that is, how many times total assets are relative to net assets, reflecting the debt level of a company.
By breaking down the data in this way, analysts can quickly pinpoint the root cause of changes in a company's ROE: Is it because products are sold at high prices (high profit margins)? Is it because products are sold quickly (high turnover)? Or is it because of excessive borrowing (high leverage)?
This is a core indicator of profitability. It reflects a company's pricing power and cost control capabilities.
A high net profit margin typically indicates that the product has brand premium, technological barriers, or cost advantages. For example, a certain wine brand 's net profit margin has consistently been around 50%, indicating that its products have extremely strong pricing power.
Low net profit margin may be due to: rising raw material prices, excessive marketing expenses, and intense price wars.
How to optimize: Increase product selling price, reduce production costs, and control period expenses (sales, administration, and financial expenses).
This reflects operational efficiency. It demonstrates a company's ability to generate revenue from its assets.
A high turnover rate indicates that the company's assets are used efficiently, such as in the retail and fast-moving consumer goods industries, where the profit margin is low but the sales volume is high.
Low turnover may mean: idle assets (such as a large amount of cash lying in the books), inventory backlog, and slow collection of receivables.
How to optimize: accelerate inventory turnover (e.g., by adopting JIT), shorten accounts receivable periods, and dispose of idle assets.
This is a financial leverage indicator. It reflects the level of debt a company has.
A higher equity multiplier indicates that a company has more debt and greater financial leverage. While this can amplify profits during economic booms, it can also amplify losses during recessions.
An equity multiplier of 3 means that total assets are 3 times net assets, or liabilities account for 2/3 of total assets.
How to optimize: Reasonably control the debt-to-equity ratio and balance returns and risks. Excessive borrowing may trigger a debt crisis.
The classic DuPont analysis method is already very useful, but it can be further broken down for a more in-depth diagnosis of the problem:
Net profit margin = (Operating revenue - Cost of goods sold - Period expenses - Taxes - Other expenses) / Operating revenue
This can be further broken down into: gross profit margin, expense ratio, tax rate, etc. For example, if the net profit margin decreases, is it because the gross profit margin decreases (due to increased costs or decreased selling price) or the expense ratio increases (due to increased marketing investment)?
Total asset turnover ratio = Operating revenue / (Current assets + Non-current assets)
Current asset turnover can be further subdivided into: inventory turnover, accounts receivable turnover, and cash turnover. Non-current asset turnover includes: fixed asset turnover and intangible asset turnover. This breakdown allows for precise identification of which asset items are inefficient.
An excessively high equity multiplier implies high debt, and it is necessary to make a comprehensive judgment based on debt repayment indicators such as interest coverage ratio and current ratio to avoid an "artificially high" ROE.
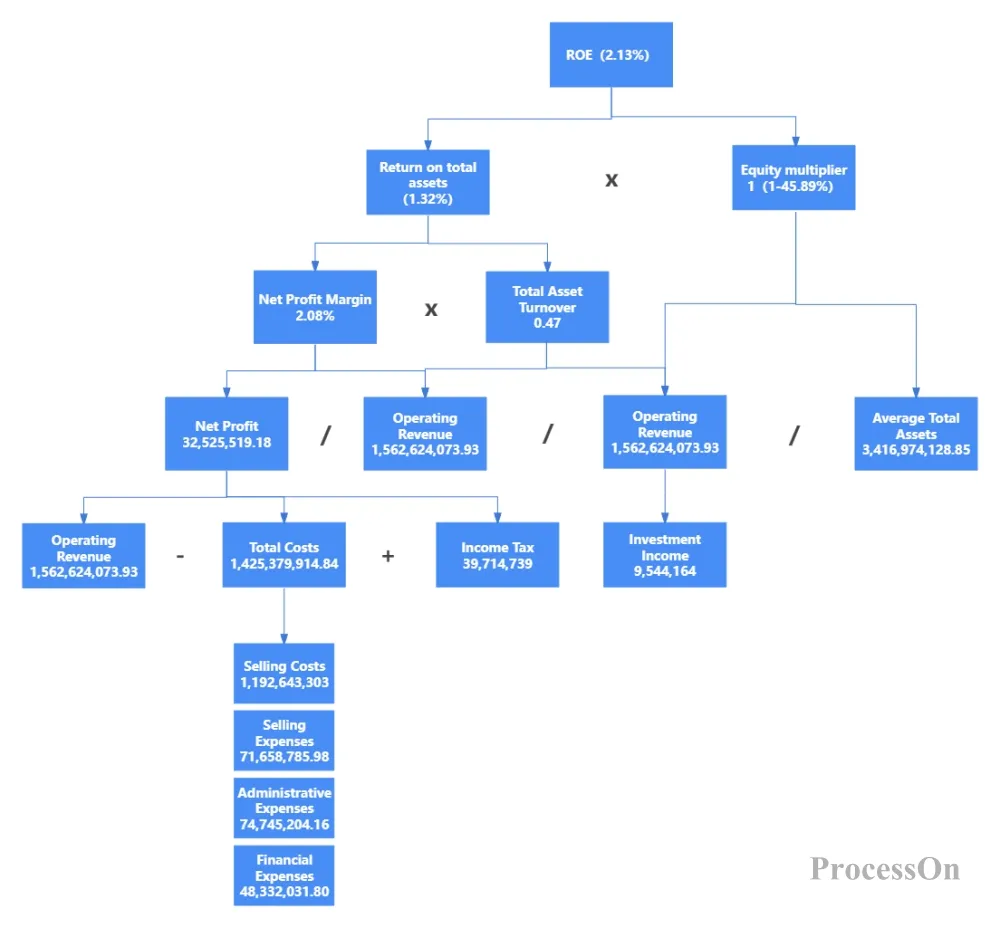
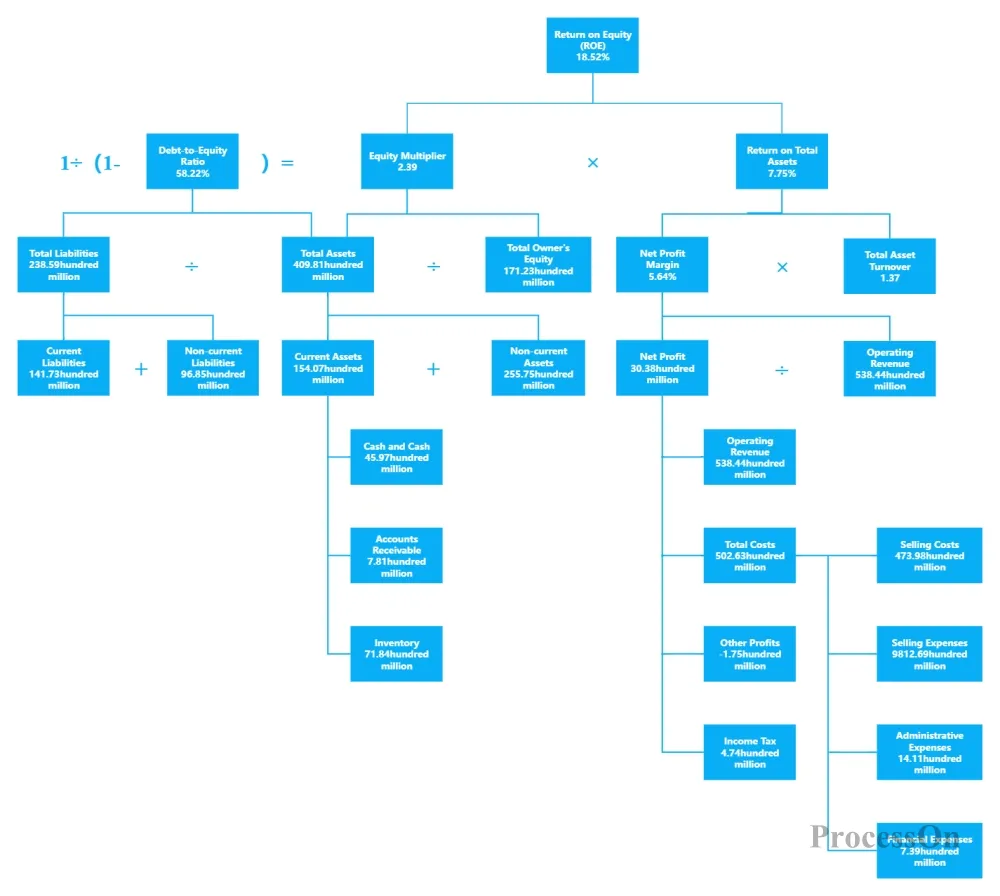
In this case, the top-level return on equity (ROE) is 2.13%, which is obtained by multiplying the return on total assets (1.32%) and the equity multiplier (1/(1-45.89%)). This data shows that the company's ROE is not high, mainly because the return on total assets is low, while the equity multiplier is at a moderate level.
Return on total assets (ROA) is calculated by multiplying the net profit margin (2.08%) and the total asset turnover (0.47). A net profit margin of only 2.08% indicates that the company generates only 2.08% net profit per 100 units of revenue, demonstrating weak profitability. A total asset turnover of 0.47 indicates low asset operating efficiency and a slow conversion of assets into revenue.
Net profit margin is calculated by dividing net profit (32,525,519.18) by operating revenue (1,562,624,073.93). Net profit is obtained by subtracting total costs (1,425,379,914.84) from operating revenue, and then adding income tax (39,714,739) and investment income (9,544,164). Total costs include operating costs (1,192,643,303), selling expenses (71,658,785.98), administrative expenses (74,745,204.16), and financial expenses (48,332,031.80).
Analyzing this data reveals that the company's operating costs account for a high proportion of operating revenue, reaching 76.3%, which is the main reason for its low net profit margin. Meanwhile, selling expenses, administrative expenses, and financial expenses also account for 4.58%, 4.78%, and 3.09% respectively, indicating that the company has room for improvement in operational management and financial costs.
Total asset turnover is calculated by dividing operating revenue by average total assets (3,416,974,128.85). The average total assets are as high as 3.4 billion, while operating revenue is only 1.56 billion, indicating that the company's asset size is too large, while operating revenue is relatively small, resulting in low asset operating efficiency. This may be due to an unreasonable asset structure, such as an excessively high proportion of fixed assets or excessive inventory accumulation.
The equity multiplier is derived by dividing average total assets by (average total assets - average total liabilities), and can be inversely calculated by subtracting the debt-to-equity ratio of 45.89% from 1. A debt-to-equity ratio of 45.89% indicates that the company's debt level is moderate, and the use of financial leverage is relatively appropriate. However, due to the low return on total assets, even with appropriate financial leverage, the return on equity remains low.
This case study demonstrates how DuPont analysis can help us gain a deeper understanding of a company's financial situation, identify problems, and propose targeted improvement measures. For example, in this case, we could suggest optimizing the cost structure to reduce operating costs; improving asset operating efficiency to reduce asset occupancy; and optimizing the capital structure by using financial leverage appropriately.
Systematic approach: Decompose the single ROE indicator into three independent dimensions to avoid one-sided judgment.
Comparability: It can be used for horizontal comparison between different companies, or for historical trend analysis of the same company.
Operability: Each dimension corresponds to specific business improvement measures, which facilitates management and implementation.
Early warning function: Discover the root cause of abnormal fluctuations in ROE (such as excessive leverage or deteriorating turnover).
Reliance on the quality of financial statements: If financial statements are falsified, DuPont analysis will also be distorted.
Ignoring cash flow: High profits do not necessarily mean high cash flow; cash flow indicators must be considered.
Differences in industry characteristics: The normal range of indicators varies greatly across different industries, and cannot be applied blindly.
Short-term perspective: Overemphasizing ROE may lead to short-sightedness by management, resulting in cuts in long-term investments such as R&D.
ProcessOn contains a large number of templates and examples for DuPont analysis. You can find ready-made templates by simply searching for "DuPont analysis" and reuse them with one click to quickly generate professional analysis charts.
DuPont analysis of group assets
Although DuPont analysis originated in finance, its approach of "breaking down core indicators into multiple driving factors" can be applied to many fields:
E-commerce operations: GMV = Number of visitors × Conversion rate × Average order value. Breaking this down allows for optimization of traffic, conversion rate, and average order value.
Content creation: Readership = Exposure × Click-through rate × Completion rate. Break this down and improve lower-level aspects.
Personal growth: Annual income = Hourly wage × Working hours. After breaking it down, consider whether to increase the hourly wage or increase working hours.
This "deconstruction → positioning → optimization" framework is the most valuable legacy of the DuPont analysis method.
DuPont analysis, though nearly a century old, remains one of the most practical analytical tools in the business world. It's simple—requiring only elementary-level multiplication and division—but it offers a structured way of thinking: every outcome has its driving factors, and by identifying them, you can control the outcome.
For investors, DuPont analysis helps you identify "pseudo-high-quality" companies (such as those with ROE built on high leverage). For managers, DuPont analysis helps you pinpoint operational weaknesses (whether it's low profit margins or slow turnover). For entrepreneurs, DuPont analysis helps you establish an ROE-oriented decision-making system.
Now you can open ProcessOn, create a DuPont analysis chart, input the financial data of the company you are interested in, and analyze its profitability yourself.