Process Type
Graphical expression
Mind Type
Structured expression
Note Type
Efficient expression
Treemap
Bracket Diagram
Default Mode


Many companies invest heavily in marketing but reap little reward. The reason is often that they try to sell their products to everyone, resulting in failing to resonate with anyone. In this age of information overload, "casting a wide net" marketing is ineffective. What you need is a method that helps you find the "right people" from a vast sea of consumers—this is the STP theory.
STP (Strategy, Targeting, and Planning) is a core framework for marketing strategy, helping businesses shift from the "mass market" to the "target market" for precise marketing. Today, we'll discuss what STP is and how to use it to guide your business's marketing strategy. More importantly, we'll show you how to visualize the STP analysis process using charting tools, making team consensus more efficient.
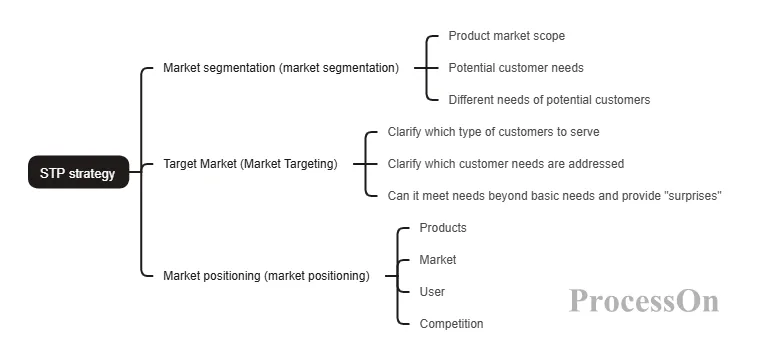
STP is an acronym for three English words:
Segmentation: Dividing the entire market into several sub-markets according to certain criteria.
Targeting: Assess the attractiveness of each sub-market and select one or more sub-markets to enter.
Positioning (market positioning): Establishing a unique and valuable position in the minds of target consumers.
This theory was proposed by marketing scholar Wendell Smith in 1956 and later popularized by Philip Kotler. Its core idea is that businesses cannot satisfy all the needs of everyone; rather than trying to please everyone, they should focus on serving a select few.
The value of STP lies in transforming the question "Who are our customers?" from a vague guess into a scientific decision-making process. Through segmentation, you can discover different demand groups hidden within seemingly homogeneous markets; through selection, you can concentrate resources on the most promising market segments; through positioning, you can occupy a unique place in the minds of consumers.
The purpose of market segmentation is to identify groups of consumers with different needs, characteristics, or behavioral patterns. An effective market segment should possess the following characteristics:
Measurable: Subdivided variables can be quantified.
Profitability: Large enough in scale and commercially viable.
Accessible: Businesses have the ability to reach and serve this group.
It can be distinguished that different market segments respond differently to marketing.
1. Geographical subdivision
The categories are divided according to country, region, city size, climate, population density, etc. For example, down jacket brands mainly promote thicker models in the north and lighter models in the south; sunscreen is heavily promoted in coastal cities.
2. Population breakdown
Segmentation can be based on age, gender, income, occupation, education level, and family life cycle. This is the most common method of segmentation. For example, maternity and baby brands target young parents aged 25-35; luxury watch brands target business professionals with an annual income of over 1 million.
3. Psychological segmentation
They can be categorized by lifestyle, personality, values, social class, etc. For example, outdoor brands target those who "seek adventure," while eco-friendly products target consumers who are "ecologically conscious."
4. Behavioral segmentation
Segmentation can be based on purchase timing, usage frequency, brand loyalty, desired benefits, and user status. For example, airlines categorize passengers into business travelers and leisure travelers; shampoo brands are segmented based on benefits such as "dandruff control," "smoothing," and "hair loss prevention."
Tool 1: Subdivision Dimension Matrix
By using two key segmentation variables as the horizontal and vertical axes, different consumer groups can be placed into quadrants. For example, if the horizontal axis represents "price sensitivity" (high/low) and the vertical axis represents "quality requirements" (high/low), then four groups can be identified: those who pursue cost-effectiveness, those who pursue high-end products, those who pursue low prices, and those who are not sensitive to quality.
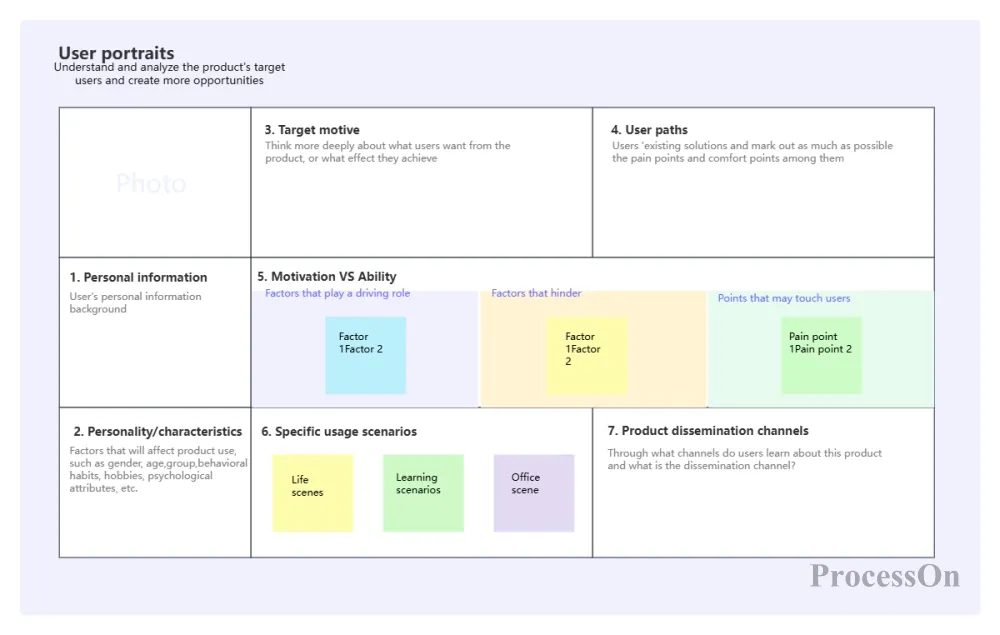
Tool 2: User Persona Kanban
Create a "person card" for each market segment, including name, age, occupation, pain points, needs, and behavioral habits. Use mind maps or card layouts to bring each market segment to life.
In ProcessOn, you can use templates such as matrix diagrams, mind maps, and bubble charts to present detailed results, making it easier for team discussions and decision-making.
Having completed market segmentation, the next step is to assess the attractiveness of each sub-market and select the target market to enter. Three main factors are considered during the assessment:
Size and growth potential of the segmented market: How large is it? How fast is it growing?
Structural attractiveness of the market segment: Are there many competitors? Are there significant threats from substitutes? Do buyers have strong bargaining power?
Company goals and resources: Does this market align with our company strategy? Are we capable of competing?
1. Mass Marketing
Ignoring market segment differences and using a single product and marketing mix to cover the entire market—for example, early Coca-Cola only had one flavor. The advantage was low cost, but the disadvantage was its inability to meet personalized needs.
2. Differentiated Marketing
Simultaneously, they enter multiple market segments, designing different products and marketing plans for each market. For example, Procter & Gamble has Head & Shoulders (anti-dandruff), Rejoice (smoothing), and Pantene (repairing). The advantage is wide coverage, but the disadvantage is high cost.
3. Concentrated Marketing
Choose only one niche market and concentrate all resources on developing it deeply. For example, Rolls-Royce only makes ultra-luxury cars. This approach is suitable for small and medium-sized enterprises with limited resources.
4. Micromarketing
Segmenting the market to its extreme, creating products tailored for individuals or small groups. Examples include custom-made suits and personalized recommendations. This approach is costly, but also has a high conversion rate.
5. Counter-segmentation
When over-segmentation leads to diseconomies of scale, several smaller segments can be merged into a larger market. For example, "family users" of different age groups can be treated as a single entity.
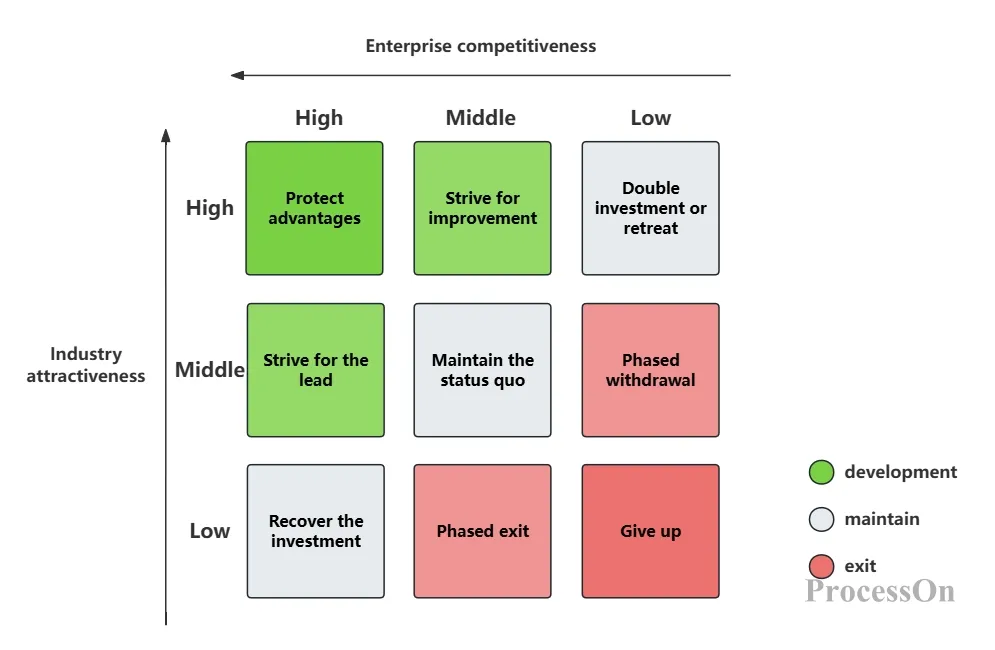
Tool 3: Market Attractiveness-Competitive Capability Matrix (GE Matrix)
The horizontal axis represents the company's competitiveness (strong/medium/weak), and the vertical axis represents market attractiveness (high/medium/low). Each market segment is divided into nine cells:
Top left corner (high attractiveness + strong capabilities): Key investment area
Diagonal (middle + middle): Selective Investment
Bottom right corner (Low attraction + weak ability): Consider quitting
Tool 4: Boston Matrix (BCG Matrix)
Product lines or market segments are categorized into four types based on "relative market share" and "market growth rate": Stars (high growth + high market share), Cash Cows (low growth + high market share), Question Marks (high growth + low market share), and Dogs (low growth + low market share). Different resource allocation strategies are applied to each category.
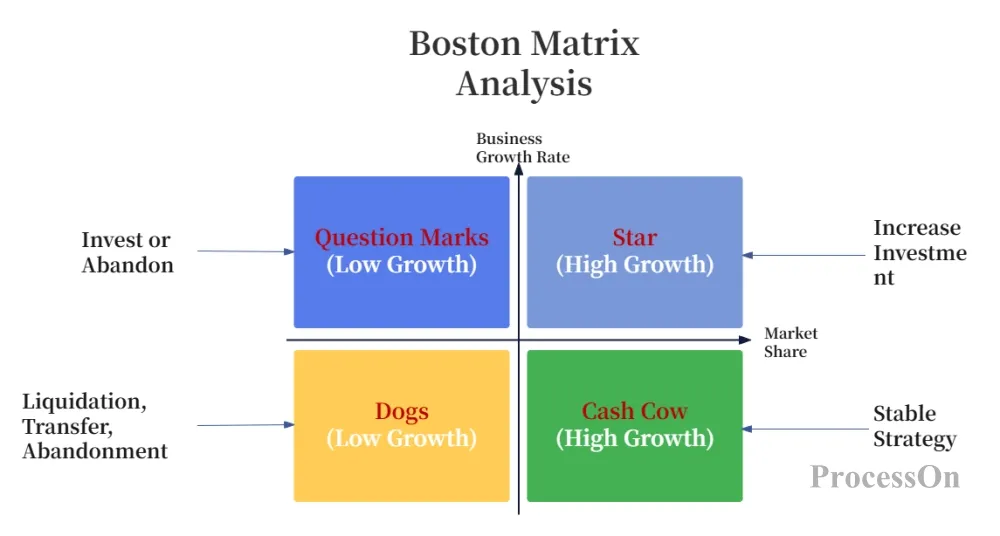
ProcessOn offers ready-made templates for both the GE matrix and the Boston matrix. Simply fill in the data to generate the matrix, and you can also use colors to indicate priority.
Having identified our target market, the next question is: How do we want consumers to perceive us in this market? What is our unique value compared to our competitors?
The essence of market positioning is differentiation—finding a valuable, unclaimed position in the minds of target consumers. Positioning isn't about what you do with your product, but rather what impression you leave on potential customers.
1. Identify potential competitive advantages
Companies can differentiate themselves in three ways:
Product differentiation: functionality, performance, design, quality, reliability
Service differentiation: delivery speed, installation, training, and after-sales service
Image differentiation: brand personality, logo, culture, reputation
2. Choose the right competitive advantage
Not all differentiators are valuable. A good differentiator should meet the following criteria: important to consumers, different from competitors, communicable, sustainable, and profitable.
3. Positioning of dissemination and transmission
Positioning isn't just written on paper; it needs to be communicated to consumers through all touchpoints, including product, price, channels, and promotions. All marketing activities should revolve around positioning.
Attribute Positioning: Volvo's "Safety"
Price positioning: Dell's "value for money"
Usage scenario positioning: Wanglaoji for those who "afraid of getting too hot"
Target audience: PepsiCo – “The choice of the younger generation”
Competitor Positioning: 7UP "Non-Cola"
Many marketers easily confuse STP with 4P. Actually, the relationship between the two is:
STP stands for the strategic level: determining "who to serve" and "on which battlefield to fight."
The 4Ps represent the tactical layer: deciding "what weapons to use" and "how to execute" the strategy.
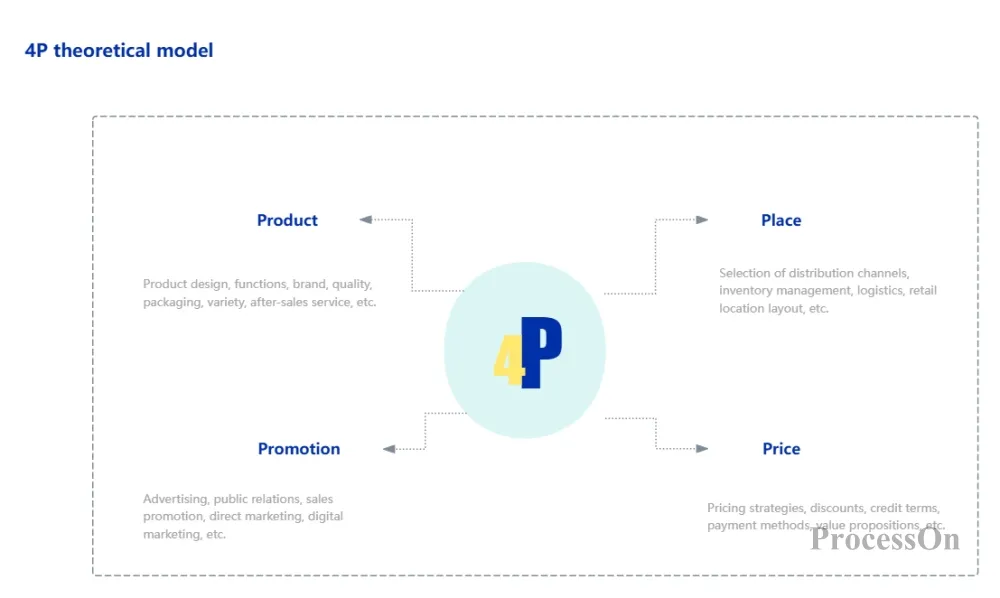
The correct workflow is: first, perform STP (Strategic Planning, Product Development, and Product Selection) to determine the target market and positioning; then, design the 4Ps (Product, Price, Place, Product) combination based on the positioning. For example, if your positioning is "high-end business professionals," then the product should be exquisite, the price should be high, the channel should be airport stores, and the promotion should emphasize a sense of quality.
Conversely, if you skip STP and go straight to 4P, there will be contradictions between product, price, place, and promotion, or the product positioning will be unclear, and no one will buy it.
In today's resource-constrained and highly competitive world, the biggest waste for businesses is not advertising spending, but pushing products to the wrong people. The value of the STP theory lies in helping you focus your marketing resources on the people most likely to make a purchase.
It's not complicated: first, segment the market; then, select your target market; finally, position yourself. But to truly master it, you need a deep understanding of your users, a rational assessment of the market, and decisive trade-offs. The role of chart tools is to visualize this process—when segmentation criteria, market size, and competitive landscape are all plotted, cognitive biases within the team are greatly reduced, and decision-making efficiency is significantly improved.
In ProcessOn, we've prepared a complete set of STP analysis templates for you: segmentation dimension matrices, GE matrices, Boston Consulting Group (BCG) matrices, and more. You don't need to start from scratch; just fill in your data and insights. Try it now and re-examine your market with STP—you might discover a hidden goldmine.
 Following the tutorial to try
Free to use ProcessOn
Following the tutorial to try
Free to use ProcessOn