Process Type
Graphical expression
Mind Type
Structured expression
Note Type
Efficient expression
Treemap
Bracket Diagram
Default Mode


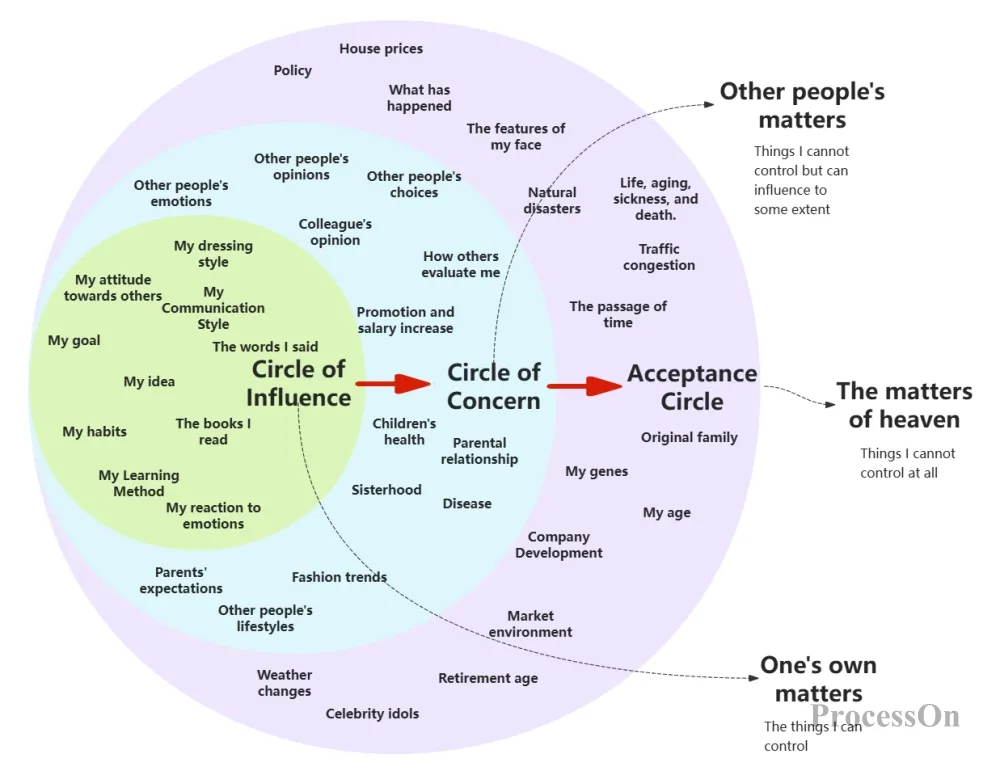
Onion diagram, as the name implies, is shaped and structured like an onion. It is a visualization tool used to model and display the relationship between different aspects of a topic. This diagram displays different stakeholders, influencing factors or research levels one by one in a layered manner, thus helping people understand the internal relationship of complex problems or systems more clearly.
The main function of the onion diagram is its powerful ability to display relationships. By displaying in layers, the onion diagram can clearly reveal the degree of connection, importance or scope of influence between different elements.
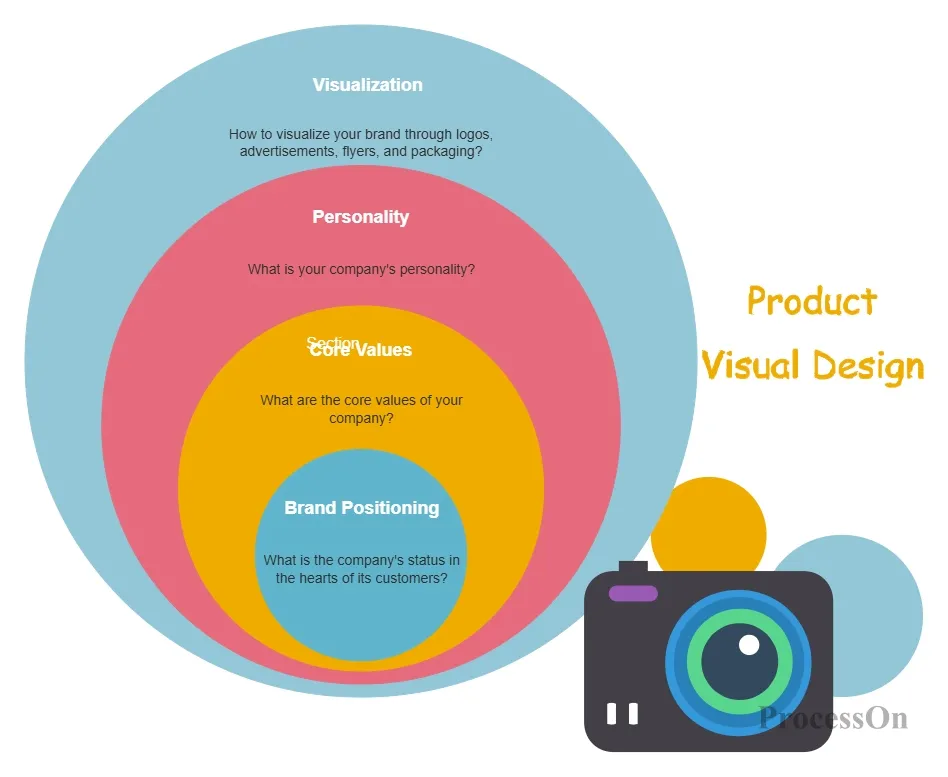
In business analysis, onion diagrams are often used to describe the relationship between stakeholders and solutions, helping teams identify key stakeholders and develop more effective strategies. In addition, onion diagrams are also widely used in social science research, project management, market analysis and other fields, becoming an important tool for solving complex problems.
In the business world, onion diagrams are often used to analyze the relationship between stakeholders and solutions, helping teams identify key stakeholders and optimize product design and market strategies.
Case: Stakeholder Analysis
Beijing: A company needs to identify brand stakeholders in order to develop a brand strategy to meet user needs.
application:
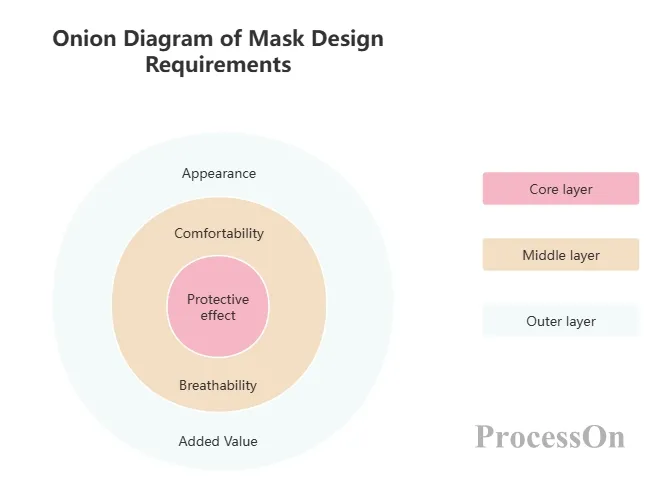
Core stakeholders: such as the core consumer group of the brand, they are located in the innermost layer of the onion diagram. These consumers have a high degree of brand identification and loyalty, and are the key to the sustainable development of the brand.
Key stakeholders: such as channel partners, media, etc., are located in the middle layer of the onion diagram. These stakeholders have moderate influence and interest in the brand, but still need to receive sufficient attention and communication to ensure the dissemination and promotion of the brand.
Peripheral stakeholders: such as regulators, industry associations, etc., are located at the outermost layer of the onion diagram. Although they have less influence and interest on brands, their policies and regulations still have a certain impact on brands.
Results: Through the onion diagram, companies can better understand the needs and expectations of each stakeholder, thereby developing more effective brand strategies to meet these needs and enhance brand competitiveness and market share.
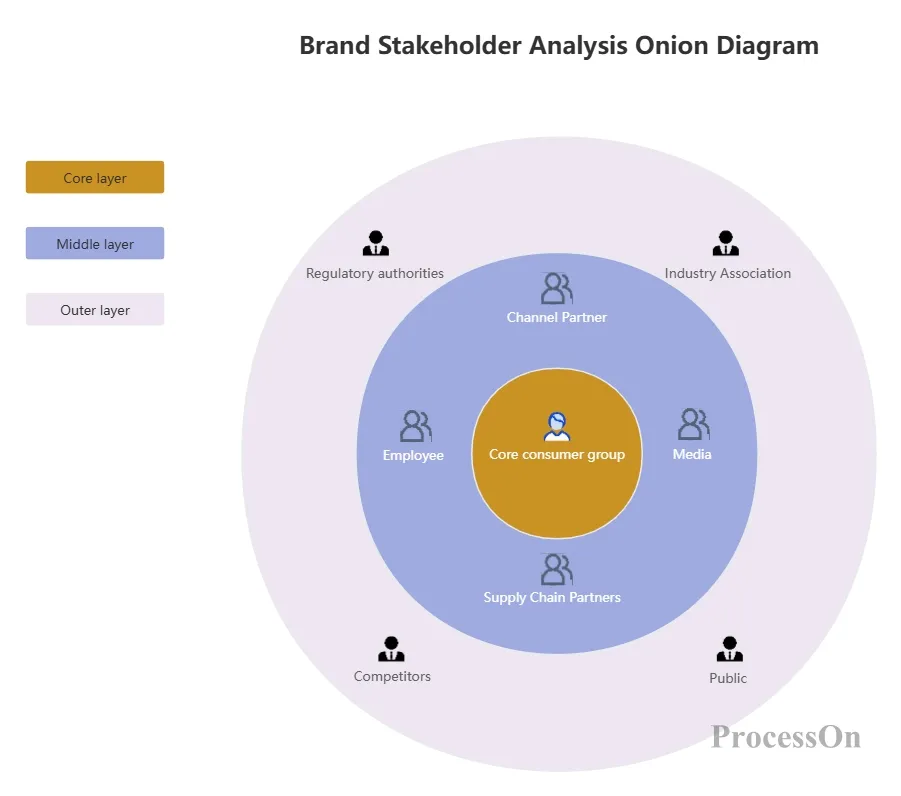
Brand Stakeholder Analysis Onion Diagram
In social science research, onion diagrams can be used to show the relationship between different theories, methods or strategies, helping researchers to gain a deeper understanding of social phenomena.
Case: Analysis of social phenomena
Background: Researchers want to analyze the attitudes and behaviors of residents in a certain area towards the waste sorting policy.
application:
Core layer: Clarify residents’ cognition and understanding of the garbage classification policy, which is the key factor affecting their behavior.
Middle layer: Analyze residents’ acceptance of the garbage classification policy, willingness to participate, and actual implementation, etc. These factors together constitute residents’ attitudes towards the garbage classification policy.
Outer layer: examine the impact of residents’ personal characteristics (such as age, gender, educational background, etc.), family situation (such as number of family members, income level, etc.) and social environment (such as community atmosphere, policy publicity, etc.) on attitudes toward garbage classification policies.
Results: Through the application of the onion diagram, researchers were able to clearly see the multi-level influencing factors of residents' attitudes towards garbage sorting policies, providing a scientific basis for formulating more effective garbage sorting policies.
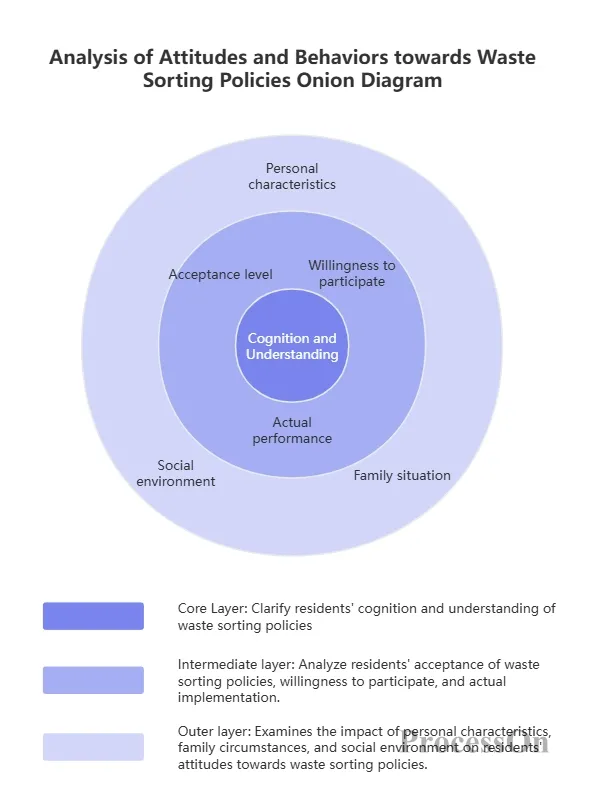
Onion diagram for social phenomenon analysis
In project management, onion diagrams can be used to show the relationships between different stages, tasks or resources of a project, helping project managers to better plan and manage projects.
Case: Project Risk Management
Background: A company hopes to comprehensively identify and manage project risks when implementing a large engineering project.
application:
Core layer: Clarify the core objectives and critical paths of the project, which is the core of project risk management.
Middle layer: Identify various risks that may be encountered during the project, such as technical risks, market risks, financial risks, etc., and evaluate the impact of these risks on project objectives.
External layer: Develop detailed risk response measures and plans, including strategies such as risk avoidance, risk reduction, risk transfer and risk acceptance. At the same time, establish a risk monitoring mechanism to ensure that project risks are effectively controlled.
Result: Through the application of the onion diagram, the company was able to comprehensively identify and manage project risks to ensure smooth project implementation and achieve the expected goals.
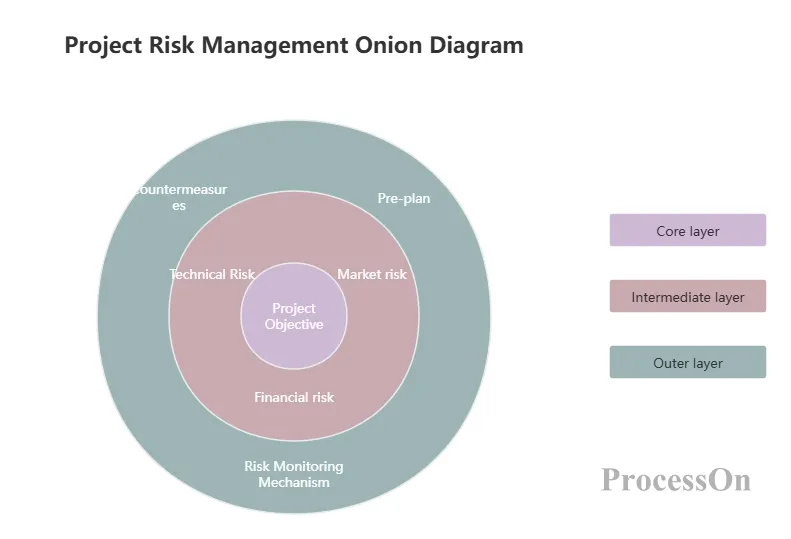
Project Risk Management Onion Diagram
There are many onion diagram makers, such as Word, MindManager, ProcessOn, etc. The following are the steps to draw an onion diagram using ProcessOn:
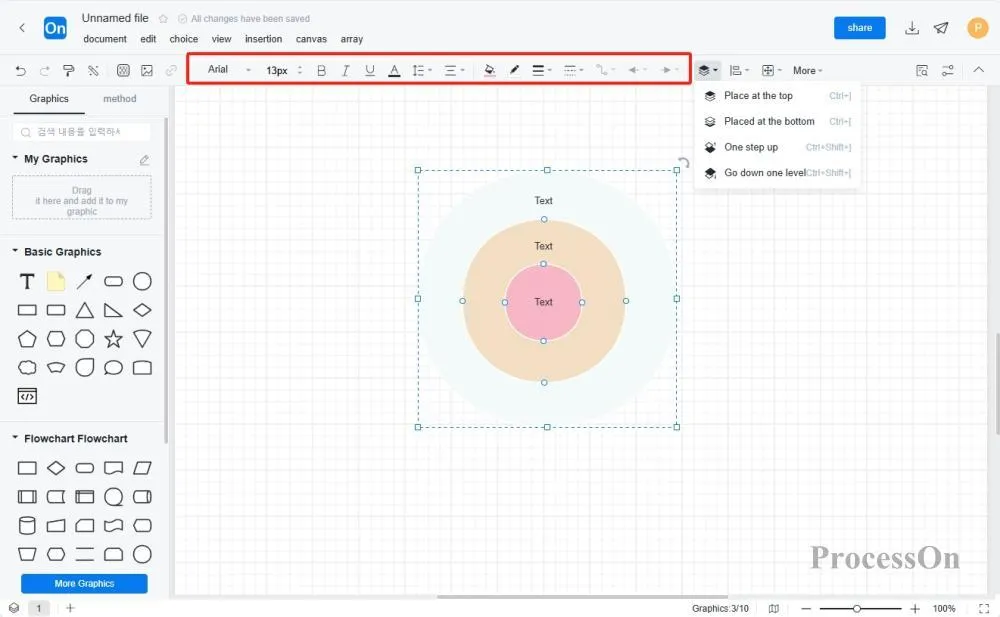
Open the ProcessOn official website, enter the personal file page, and click New to create a flowchart .
the circle from the graphics library on the left side of the flowchart maker to the canvas, double-click the graphic to add text. If the circle is not the right size, select the graphic, press Ctrl+Alt and drag the four corners of the graphic to scale the circle proportionally.
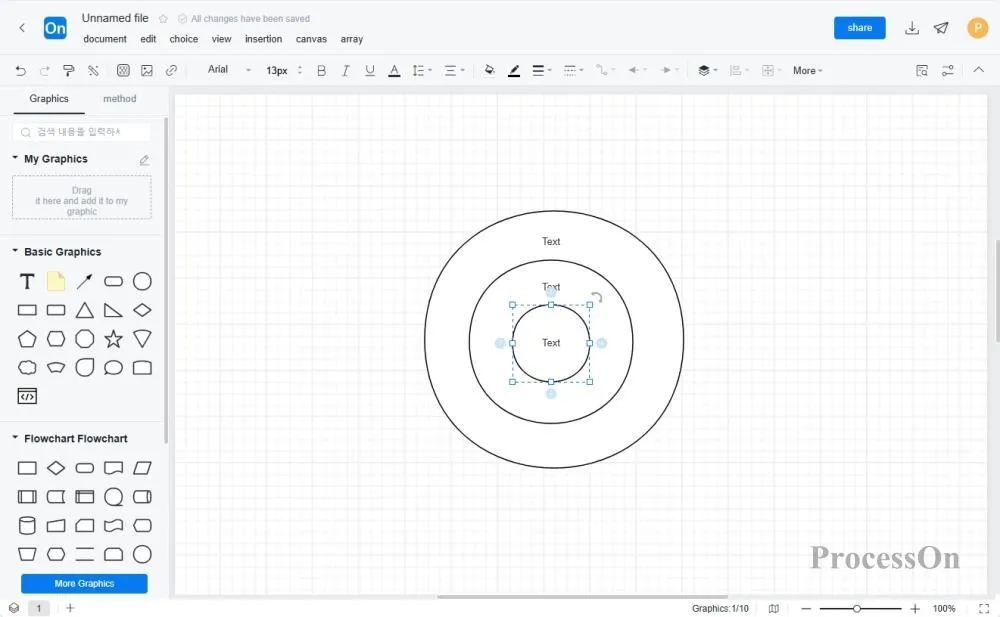
Select the circle and set different levels in the top toolbar according to the relationship between the core layer, middle layer and outer layer of the onion diagram. It also supports adjusting the color, font and other styles .
The ProcessOn template community contains a variety of onion diagram templates for reference in multiple industries, and supports cloning to improve drawing efficiency. The following are some templates for sharing.
Business Analysis Onion Diagram Example
As a powerful visualization tool, onion diagram plays an important role in many fields. By mastering the drawing method and application scenarios of onion diagram, we can better understand and solve complex problems and improve the efficiency and quality of work and research.