Process Type
Graphical expression
Mind Type
Structured expression
Note Type
Efficient expression
Treemap
Bracket Diagram
Default Mode
When conducting systematic reviews and meta-analyses, almost all mainstream academic journals require authors to include a diagram in their papers—the PRISMA flowchart. It is a core tool of the PRISMA (Preferred Reporting Items for Systematic Reviews and Meta-Analyses) statement and the first hurdle reviewers use to judge the quality of a review.
Systematic reviews and meta-analyses
Many graduate students or medical students new to scientific research often feel confused when drawing PRISMA flowcharts: What should be written in each box of the flowchart? How should the numbers be calculated? How detailed should the exclusion records be? Why do the diagrams they painstakingly draw always get criticized by reviewers for "incomplete data loops"?
If you're also struggling with these issues, don't worry. Today we'll thoroughly explain PRISMA flowcharts—what they are, their value, their core framework , and how to draw them using flowchart tools.
The PRISMA flowchart was first proposed by Moher et al. in 2009 and has undergone two major revisions in 2020 and 2025. Just as a complete meta-analysis needs not only "results" but also "processes," the significance of the PRISMA flowchart lies in this—it uses a standardized chart to record every step researchers take from "finding a needle in a haystack" to "screening results," telling journals and peers in the most intuitive way how your review was written, how the literature was screened, how many articles were excluded at each step, and the reasons for the exclusions.
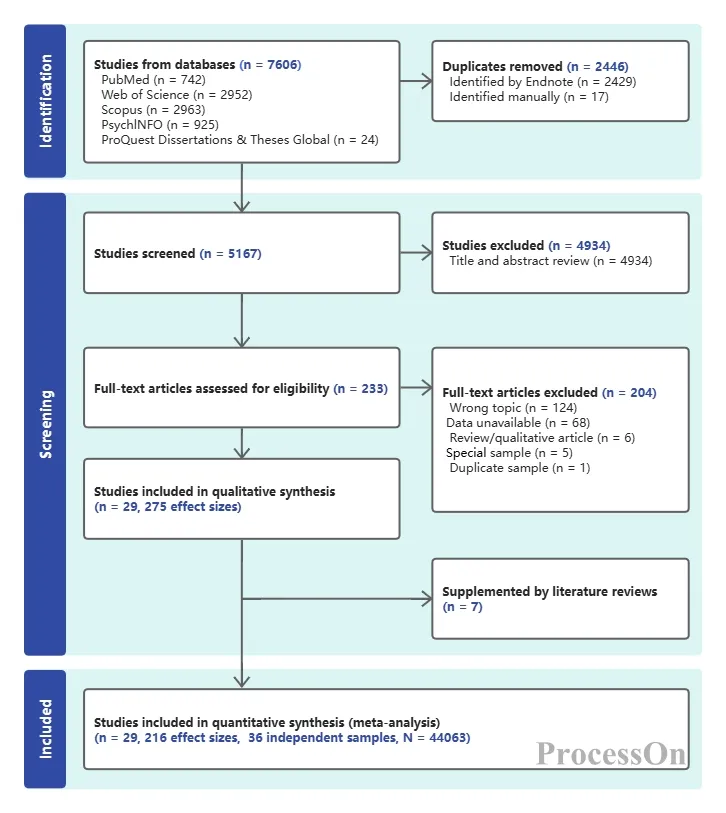
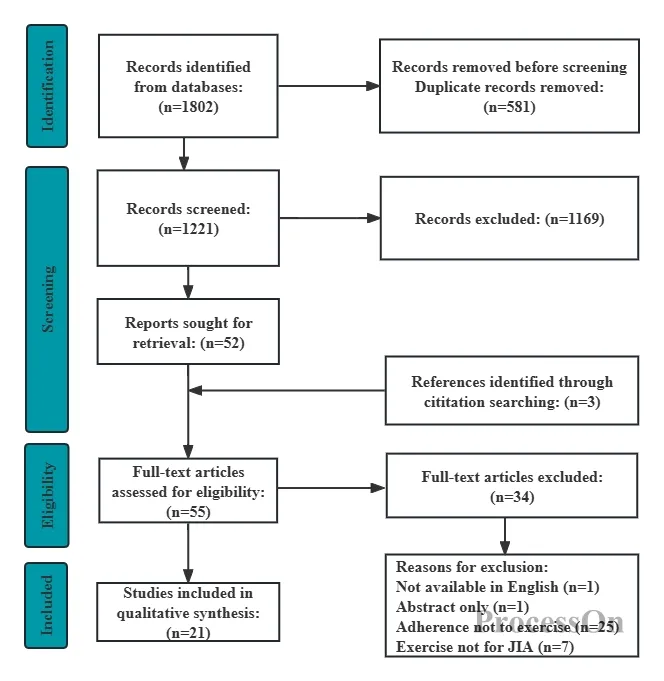
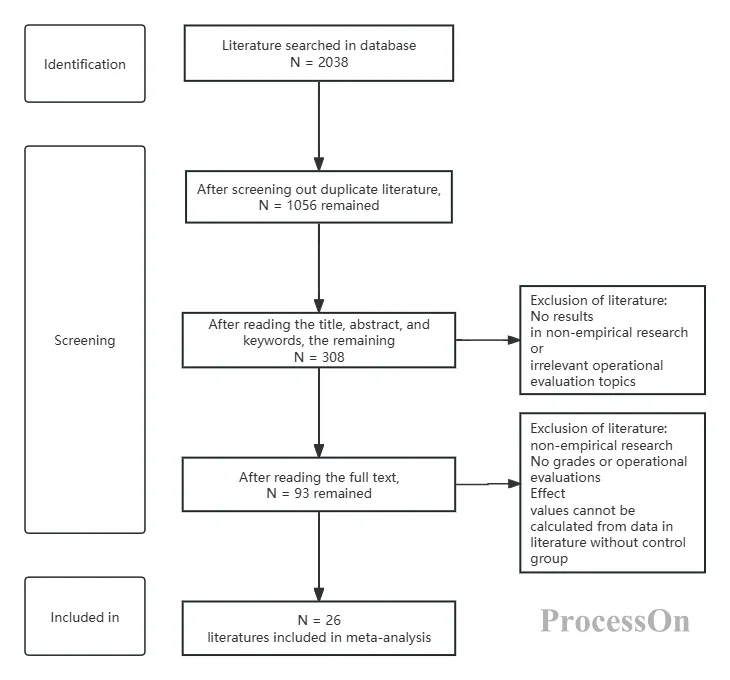
The PRISMA flowchart follows a strict standardized structure and includes four key components:
Identification phase: Shows which databases or sources the literature was found from, how many articles were found, and how many were duplicates.
Screening stage: Shows how many articles are retained after deduplication, and how many are filtered out based on title and abstract.
Eligibility assessment: After entering the full-text reading stage, how many articles were included, how many were excluded, and what were the specific reasons for the exclusion?
Included phase: This phase finalizes the number of articles included in the final analysis and results compilation.
PRISMA flowchart in four stages
These four stages are interconnected, and the number of each link must be perfectly matched to form a complete "digital closed loop".
Before understanding how to draw a PRISMA flowchart, first understand its value. Many journal reviewers will reject a systematic review or meta-analysis without one; it's not that journals are deliberately making things difficult, but rather that the PRISMA flowchart genuinely fulfills the following core functions:
Enhancing transparency and credibility: The PRISMA flowchart details the research selection process, allowing readers to clearly see the number of articles selected and the reasons for exclusion at each step. Journal editors and reviewers can use the flowchart to assess the rigor and comprehensiveness of the research selection process, thereby determining the reliability of the review and whether any important literature has been omitted.
Ensuring reproducibility: Because the flowchart fully records the operational steps of each stage, other researchers can reproduce this study based on the same screening logic, verify its conclusions, and ultimately drive a revolution in scientific reproducibility.
Reducing bias and potential errors: The flowchart clearly shows the reasons for each exclusion step—whether it's academic misconduct throughout the text, a flawed research design, or incomplete data. This transparency helps readers determine whether the review has selective reporting bias and assess the objectivity of the final research results.
Meeting strict publication requirements: Many academic journals and research funding agencies explicitly require that all systematic reviews and meta-analyses must comply with PRISMA guidelines. Manuscripts that do not provide PRISMA compliance documentation are often rejected during the initial editorial review stage.
A standard PRISMA flowchart typically resembles a vertically oriented, multi-tiered box diagram, progressing through four core phases from top to bottom: identification, screening, eligibility assessment, and inclusion. The following section breaks down the specific meaning of each phase.
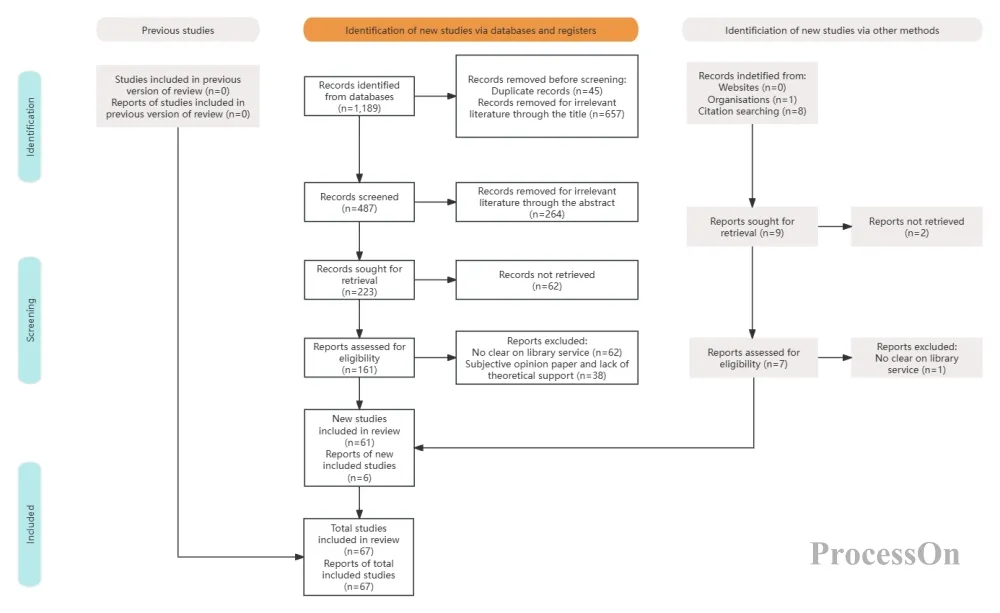
This stage answers the questions: "Where did I find the literature? How many articles did I find in total?"
The top of the flowchart typically consists of multiple squares labeled "Records obtained through database searches" and "Records obtained through other sources." Researchers need to list in detail which databases were searched, such as PubMed, Web of Science, Embase, and Cochrane Library, and indicate the number of search results for each database in parentheses.
Next, the two channels will converge at the "duplicate removal" step. Since the same article may be indexed by multiple databases, it's essential to use reference management software like EndNote or NoteExpress for automatic deduplication, clearly marking the total number of remaining references in the graph. Here, the number of references must be precise. For example, if a total of 3000 articles were found, including 1200 in PubMed and 1100 in Web of Science, these should be clearly recorded. This demonstrates the comprehensiveness of the literature search and shows reviewers that you are meticulous.
This stage is also called "initial screening," and it answers the question: "Of the deduplicated articles, how many are truly relevant?"
Researchers need to perform a rapid filtering based on title and abstract information. The purpose of this step is to eliminate obviously irrelevant literature; for example, if you want to conduct a clinical trial of "hypertensive drugs" but find literature on animal experimental models or whose research subjects are completely different. After title and abstract filtering, the remaining papers will proceed to the next stage of full-text review.
The numbers at this stage are also prone to error—the total number of duplicate documents minus the number of titles and abstracts rejected must equal the number that proceeds to full-text review. If the addition and subtraction are inconsistent, the flowchart becomes useless. Experts advise researchers to keep records as they screen, and never try to recall how many documents were rejected at the end.
The eligibility assessment, also known as "full-text review," is the most academically rigorous step in creating the flowchart. Researchers need to download the full text of the remaining literature, read it carefully, and analyze it article by article according to the pre-set inclusion and exclusion criteria. For example, the inclusion criteria for a systematic review might be "randomized controlled trial," "sample size greater than 50 cases," and "complete outcome measures," etc.
At this stage, all literature that does not meet the inclusion criteria must be clearly marked and categorized. Common reasons include "incompatible study design," "incompatible population," "incompatible intervention," and "missing outcome indicators." Reviewers will use this section to determine whether your review's exclusion criteria are reasonable and whether important literature that should not have been excluded has been excluded.
The ultimate goal of the flowchart is to show the number of articles that ultimately enter the qualitative synthesis (systematic review) or quantitative synthesis (meta-analysis) after these multiple rounds of screening. In addition to indicating the total number of articles ultimately included, the flowchart often includes a footnote: "xx articles were ultimately included." If it's a meta-analysis with pooled effect sizes, it also needs to indicate how many effect sizes were extracted.
The following is a complete operation guide from preparation to actual drawing.
Conduct a literature search : Search for relevant literature through multiple databases and record the search strategies and results, including the total number of documents retrieved. Don't just record a single total; list these numbers separately to ensure the completeness of the subsequent flowchart and the sufficiency of the argument.
Accurately calculate the number of duplicates removed: Import all references into reference management software such as EndNote and perform automatic deduplication. Record "how many references were removed by automatic deduplication and how many by manual deduplication," because the official template requires that these two sources be labeled separately.
Record the reasons for exclusion in detail and categorize them with codes: For literature excluded during the screening or full-text review stage, make sure to keep paper or electronic records, such as "research design is inconsistent" or "intervention measures are inconsistent", and record them in a standard format. This way, you can directly compile statistics and fill in graphs when summarizing at the end.
Draw a PRISMA flowchart: Based on the selection results, use tools such as ProcessOn to draw a PRISMA flowchart. You can search for "PRISMA flowchart" in the template community, apply the template directly, and then manually fill in the text and numbers to make modifications.
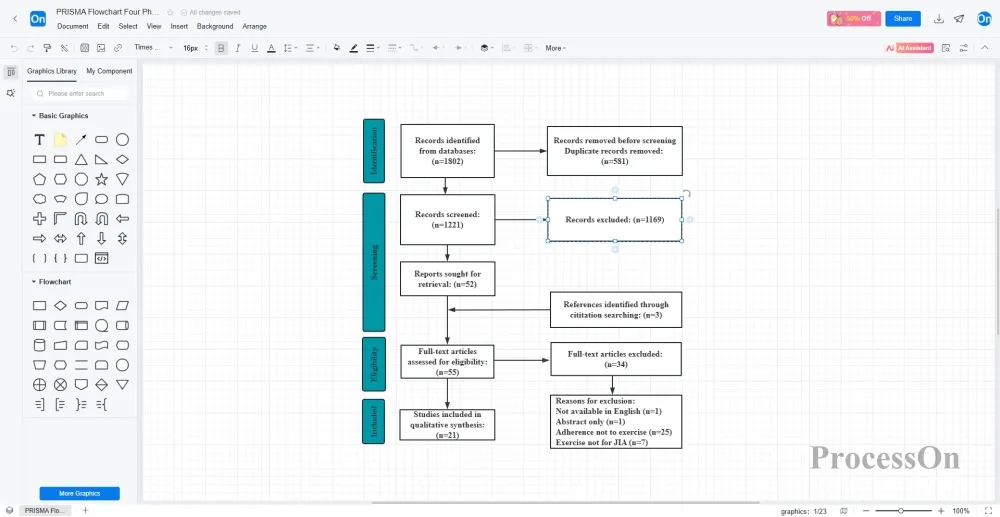
Exporting supports multiple image formats such as PNG/JPG/SVG/PDF, which can be directly embedded in documents. When team collaboration is required, you can also directly invite teammates to create a flowchart together, communicate and comment, and update in real time.
Verification work
Once the flowchart is completed, rigorous data verification is essential. A simple rule of thumb for scientific editing is this: from the total number of documents retrieved at the top to the total number included in the analysis at the bottom, every subtraction along this path should equal the total number of results. For example, the difference between "total number retrieved" and "number after deduplication" minus "number excluded by title/abstract" minus "number excluded by full-text" must equal the final "number of included studies."
Here is a very simple self-check process: After receiving the initial draft of the PRISMA flowchart, first check whether the total of "Locked" (the total of each database) in the upper left corner is equal to the "Total Number of Records"; secondly, verify the difference logic of the initial deduplication screening; then summarize and present the reasons for the exclusion of the entire text; finally, you must confirm whether the original total at the top minus all the excluded numbers is exactly equal to the "Final Inclusion" number at the bottom.
The maturity of a PRISMA flowchart, to some extent, directly reflects the methodological rigor of a systematic review. If your team is preparing to submit a meta-analysis or systematic review, don't rush to manually assemble a flowchart in PowerPoint just because you need one. ProcessOn not only helps you easily build high-quality PRISMA flowcharts, but also provides data visualization and version history tracking, which facilitates collaborative modifications and ensures traceability of change logs.