Process Type
Graphical expression
Mind Type
Structured expression
Note Type
Efficient expression
Treemap
Bracket Diagram
Default Mode


Market research is the cornerstone of a successful new product launch. Whether it's a startup or an established brand, before launching a new product, they need to conduct systematic and scientific research to validate ideas, understand needs, and mitigate risks. However, many teams' understanding of research remains limited to "sending questionnaires and collecting data," lacking a complete and systematic approach.
This article will break down the entire market research process for you: from preliminary preparation, copywriting, data collection to analysis and reporting, as well as five mainstream research methods—copywriting research, questionnaires, interviews , observation , and experimentation . Whether you are a product manager, marketing specialist, or entrepreneur, you can find practical methodologies within its pages.
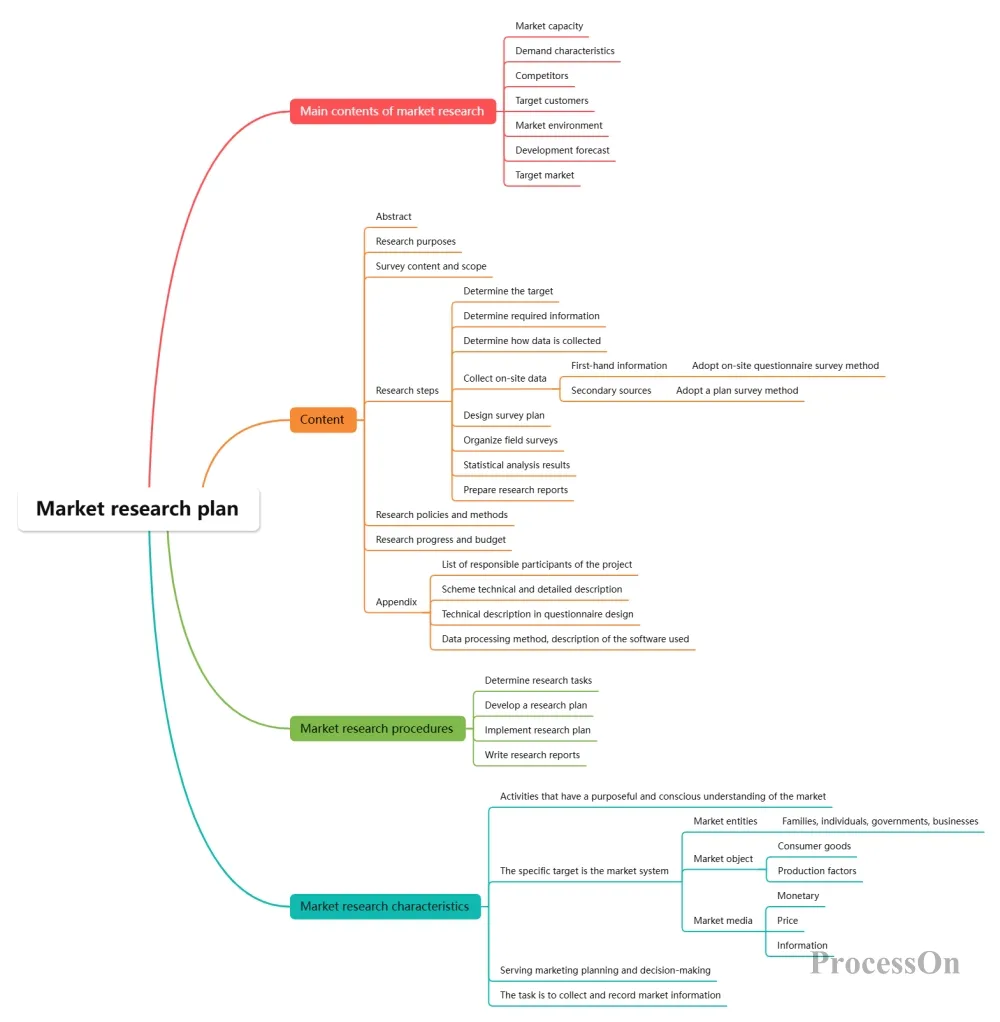
Any successful research begins with meticulous planning. The preliminary preparation stage determines the efficiency and effectiveness of the research, and mainly includes three aspects:
The research outline serves as the blueprint for the entire project. First, a research plan must be developed, clearly defining the research topic—what problem do we want to solve? For example, "Understanding the price acceptance of smart bracelets among target users." Simultaneously, the research content (such as functional preferences, purchase channels) and research methods (quantitative or qualitative) must be determined. Second, the research target group must be identified: Who is the target audience? What is the sample size? How should the research schedule be arranged? Finally, the research tools must be determined: How should the questionnaire be designed? What questions should the interview outline include? Should the sampling method be random sampling or stratified sampling?
The copywriting process includes writing research reports and creating research presentation slides. Research reports should clearly present the research objectives, questions, methods, and expected results; presentation slides are used for internal reports or presentations to clients and should be well-structured and highlight key points.
Plan your data sources in advance – will it be online questionnaires, telephone interviews, offline observations, or experimental methods? At the same time, design your data processing workflow: how to clean, classify, and code the raw data to lay a solid foundation for subsequent analysis.
With the above preparations completed, the research project will have a clear roadmap, which can prevent it from going astray or wasting resources.
five classic methods for market research , each with its own advantages and disadvantages, and each suitable for different scenarios.
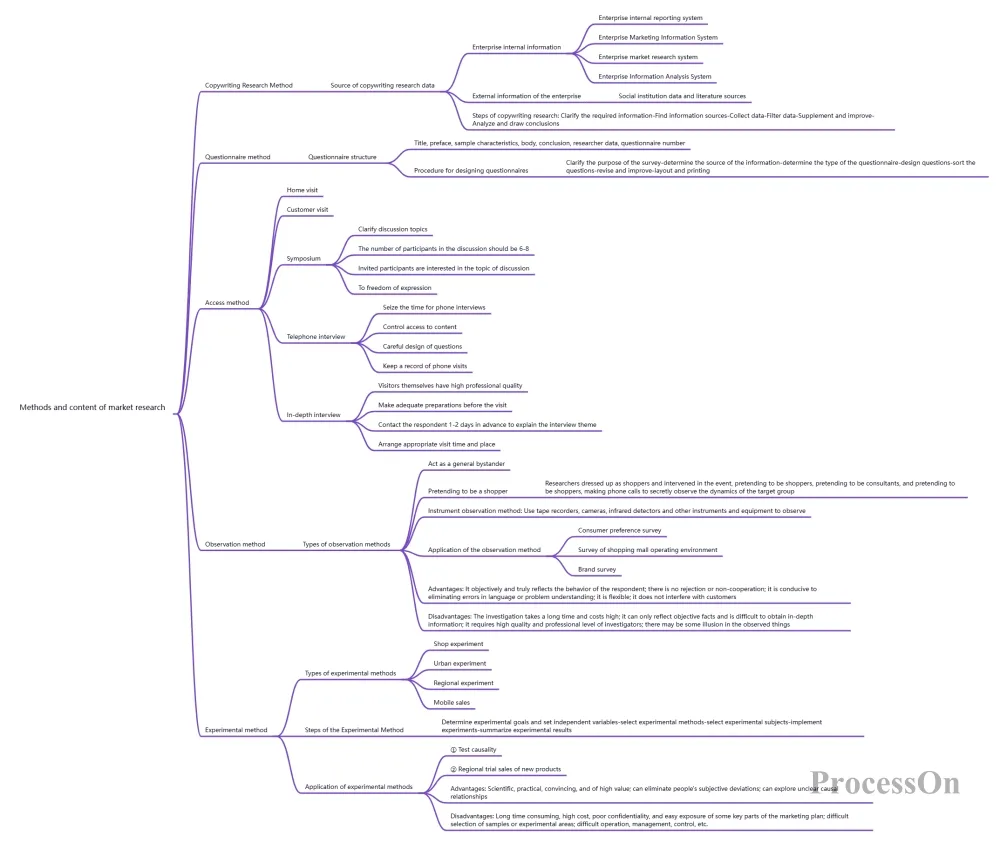
Definition: Gaining market insights by reading secondary information such as industry reports, academic papers, publicly available government data, and competitor information.
Features: High timeliness, low cost, and high operability. You don't need to personally contact users; you can simply sit in front of your computer to collect, organize, and analyze existing information.
Operating procedures:
Identify the target audience (e.g., "white-collar workers aged 25-35 in first-tier cities") → Define the research questions (e.g., "What fitness apps do they use most often?") → Determine the research methods (e.g., keyword search, database query) → Collect data (from Google Trends , SimilarWeb , etc.) → Analyze the data (comparison, summarization, trend judgment) → Write the report
The document research method is suitable for quickly understanding the market overview in the early stages of a project, but it cannot completely replace first-hand data.
Definition: Collecting data on attitudes, behaviors, preferences, etc. of a target population on a large scale by designing standardized questionnaires.
Features: Simple and easy to implement, low cost (especially online questionnaires), and quantifiable analysis. Suitable for scenarios requiring statistical inference.
Operating procedures:
Identify the target audience (e.g., "women who have purchased athletic shoes in the past 3 months") → Design questionnaire questions (primarily closed-ended questions, such as Likert scales) → Select distribution channels ( social media , email, etc.) → Collect data (ensuring the sample size meets statistical requirements) → Clean and code the data → Perform statistical analysis (descriptive statistics, cross-analysis, correlation analysis) → Write the report
The key to questionnaire methods lies in the scientific design of the questions and the representativeness of the sample.
Definition: To obtain qualitative information through in-depth communication with respondents face-to-face, by phone, or by video.
Features: Direct, efficient, and capable of uncovering deeper motivations. Suitable for exploratory research, such as understanding why users dislike a certain feature.
Operating procedures:
Identifying interviewees (usually requiring screening criteria) → Designing a semi-structured interview outline → Scheduling and conducting the interview (recording and note-taking) → Organizing the interview transcript (transcription) → Analyzing qualitative data (topic coding, keyword extraction) → Writing the report
Interviews can uncover the "why" that questionnaires cannot, but they suffer from small sample sizes, high costs, and strong subjectivity in analysis.
Definition: Observing user behavior in a real-world environment without intervention.
Features: Intuitive, effective, and avoids the discrepancy between "saying" and "doing". For example, observing the time users spend in front of supermarket shelves and their click paths within an app.
Operating procedures:
Identify the observation subjects (e.g., "customers using self-checkout machines for the first time") → Determine the observation scenario and time (e.g., a supermarket on a weekend afternoon) → Design an observation record form (behavioral frequency, duration) → Record on-site or videotape → Data processing and coding → Analyze behavioral patterns → Write a report
Observation is best suited for studying unconscious behavior, but it cannot reveal a user's inner thoughts.
By selecting samples and designing experiments, we can examine the impact of marketing variables (such as price, packaging, and advertising) on consumer behavior.
Experiment type
Product experimentation: Testing the response to different packaging or pricing in the real market.
City Experiment: Select one or two pilot cities, launch a new marketing plan, and compare the results with those in control cities.
Regional experiments: Similar to city experiments, but with a wider scope.
Mobile sales: Testing the same product in different locations and at different times to observe sales differences.
Experimental steps
Define the experimental objective, specify independent variables (e.g., price) and dependent variables (e.g., sales volume) → Select the experimental method (e.g., A/B testing) → Select the experimental subjects (e.g., specific stores or user groups) → Conduct the experiment, controlling for confounding variables → Summarize the experimental results and draw conclusions.
Regardless of the method used, a large amount of raw data will ultimately be obtained. The data collection and processing phase includes:
Data sources: questionnaires, interview recordings, observation records, experimental data, etc.
Data processing: cleaning (removing invalid questionnaires and handling missing values), classification (labeling by dimension), and coding (converting text into numbers).
For example, out of 500 questionnaires, 20 might be rejected because the completion time was too short or the answers contradictory. The interview recordings need to be transcribed and each segment labeled with a theme (e.g., "price sensitive" or "functional expectations").
Data analysis is the core value of research. According to the mind map, common methods include:
Descriptive statistical analysis: Calculate the mean, frequency, standard deviation, etc., to understand the basic characteristics of the data. For example, "75% of users want products to have a battery life reminder function."
Inferential statistical analysis: inferring the population from the sample, such as the T-test and chi-square test, to determine whether the difference is significant.
Regression analysis: Explores the relationships between variables, such as "For every 10 yuan decrease in price, by what percentage does the willingness to buy increase?"
Cluster analysis: Dividing users into different groups (such as "price-sensitive" and "feature-seeking") facilitates precise marketing.
Commonly used tools: Excel (basic analysis), SPSS (professional statistics), and R (advanced modeling). For most business research, Excel's pivot table and chart functions are sufficient.
Research reports serve as a bridge between analytical findings and business decisions. A standard report should include:
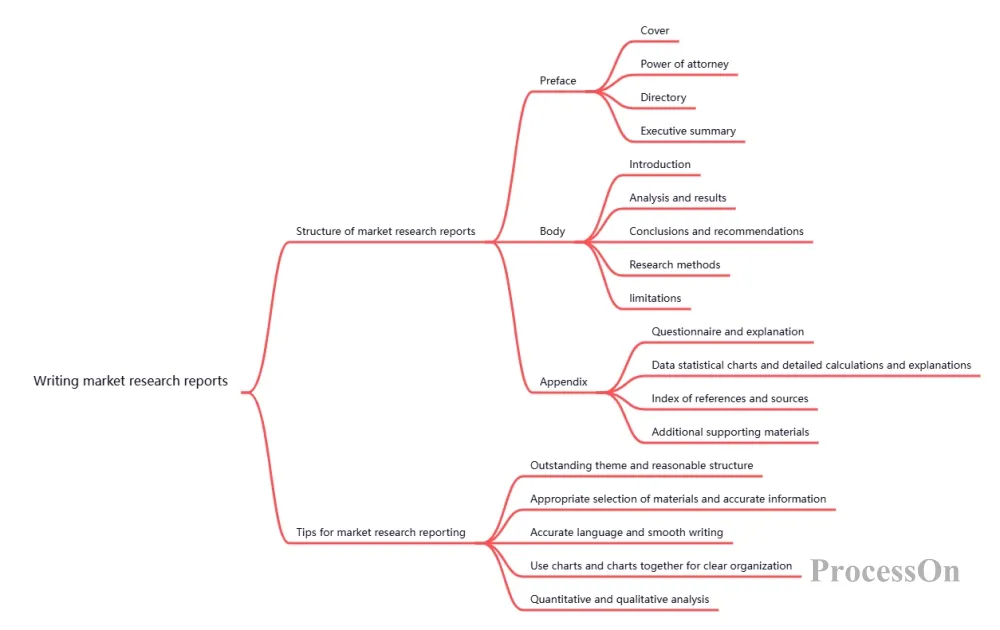
Structure of a Market Research Report
Reports should avoid simply piling up data; instead, they should use a "storyline" to connect the findings, making the insights easy for readers to understand.
After the research report is completed, it is usually necessary to present the results to the team through a meeting or presentation. Common formats include:
PPT presentation: Extract the core conclusions to no more than 10 pages, use more charts and graphs and less text.
Video demonstration: Combining user interview clips and on-site observation videos enhances the appeal.
Physical demonstrations: such as competitor product teardowns and prototype comparisons.
The content presented should also cover the background, purpose, method, and result, but with a greater emphasis on visualization and persuasiveness.
Triangular validation: Combining multiple methods such as written documents, questionnaires, and interviews to cross-validate conclusions.
Avoid bias: Questionnaire questions should be neutral, and answers should not be guided during interviews.
Sample control: Ensure that the sample covers users with different characteristics to avoid "survivorship bias".
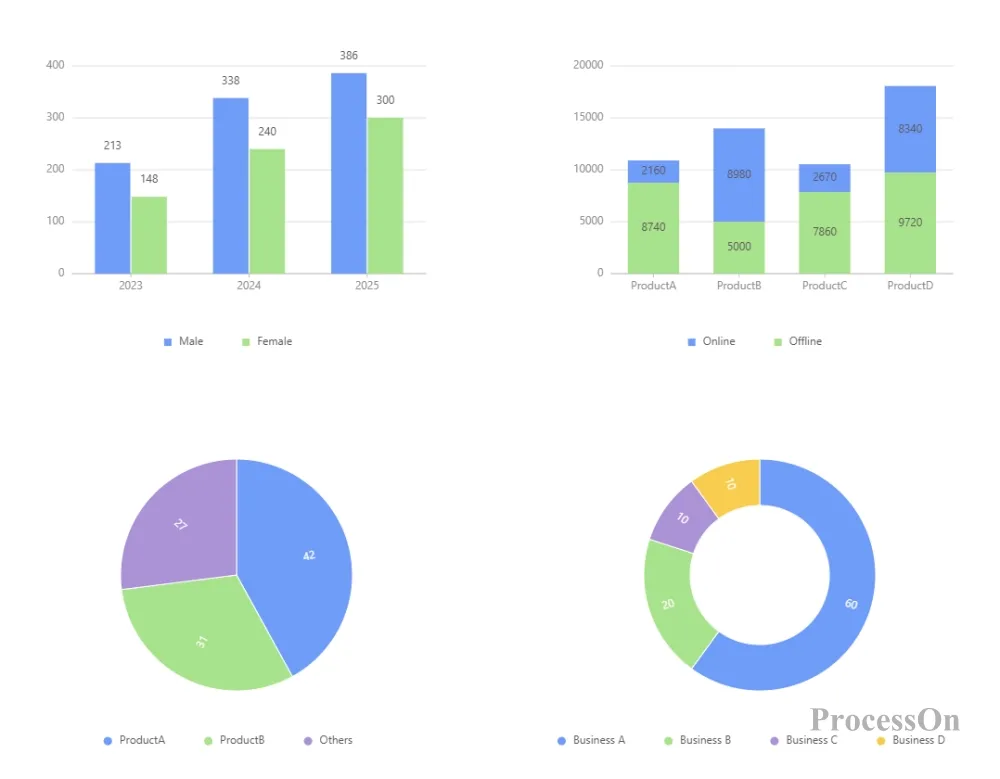
Visual presentation: Replace dry numerical tables with bar charts, pie charts, and heat maps.
A smart home brand planned to launch a new air purifier. Initial copywriting research revealed that "formaldehyde removal" was the most searched feature. A questionnaire survey collected 500 user responses, with 70% of users willing to pay an extra 200 yuan for a digital formaldehyde display. Further in-depth interviews with 20 allergy sufferers revealed their extreme sensitivity to noise. Finally, observations in physical stores showed that users would feel the airflow force at the vents with their hands. Based on all these findings, the product ultimately added a formaldehyde sensor, a silent mode, and a visual airflow display, becoming a bestseller after its launch.
Market research is not a one-off event, but should be conducted throughout the entire product lifecycle. From proof-of-concept to post-launch feedback, continuous research helps companies respond quickly to changes. Remember: good decisions stem from good information, and good information stems from scientific research.
Market research involves numerous steps, methods, and documents, making it easy for teams to get lost in the details. At this point, a clear mind map or flowchart can act as a "navigator."
ProcessOn supports online creation of various diagrams such as mind maps, flowcharts, and UML diagrams, and boasts a vast template library. You can directly search for "market research" to find similar templates, reuse them with one click, and quickly build your own research plan. Meanwhile, the team collaboration feature allows multiple people to edit simultaneously, comment, and communicate, making the research plan more comprehensive.
now on ProcessOn . Use visualization to ensure that every research project is goal-oriented, logically structured, and delivers tangible results.