
Annual plan Gantt chart
7 Report
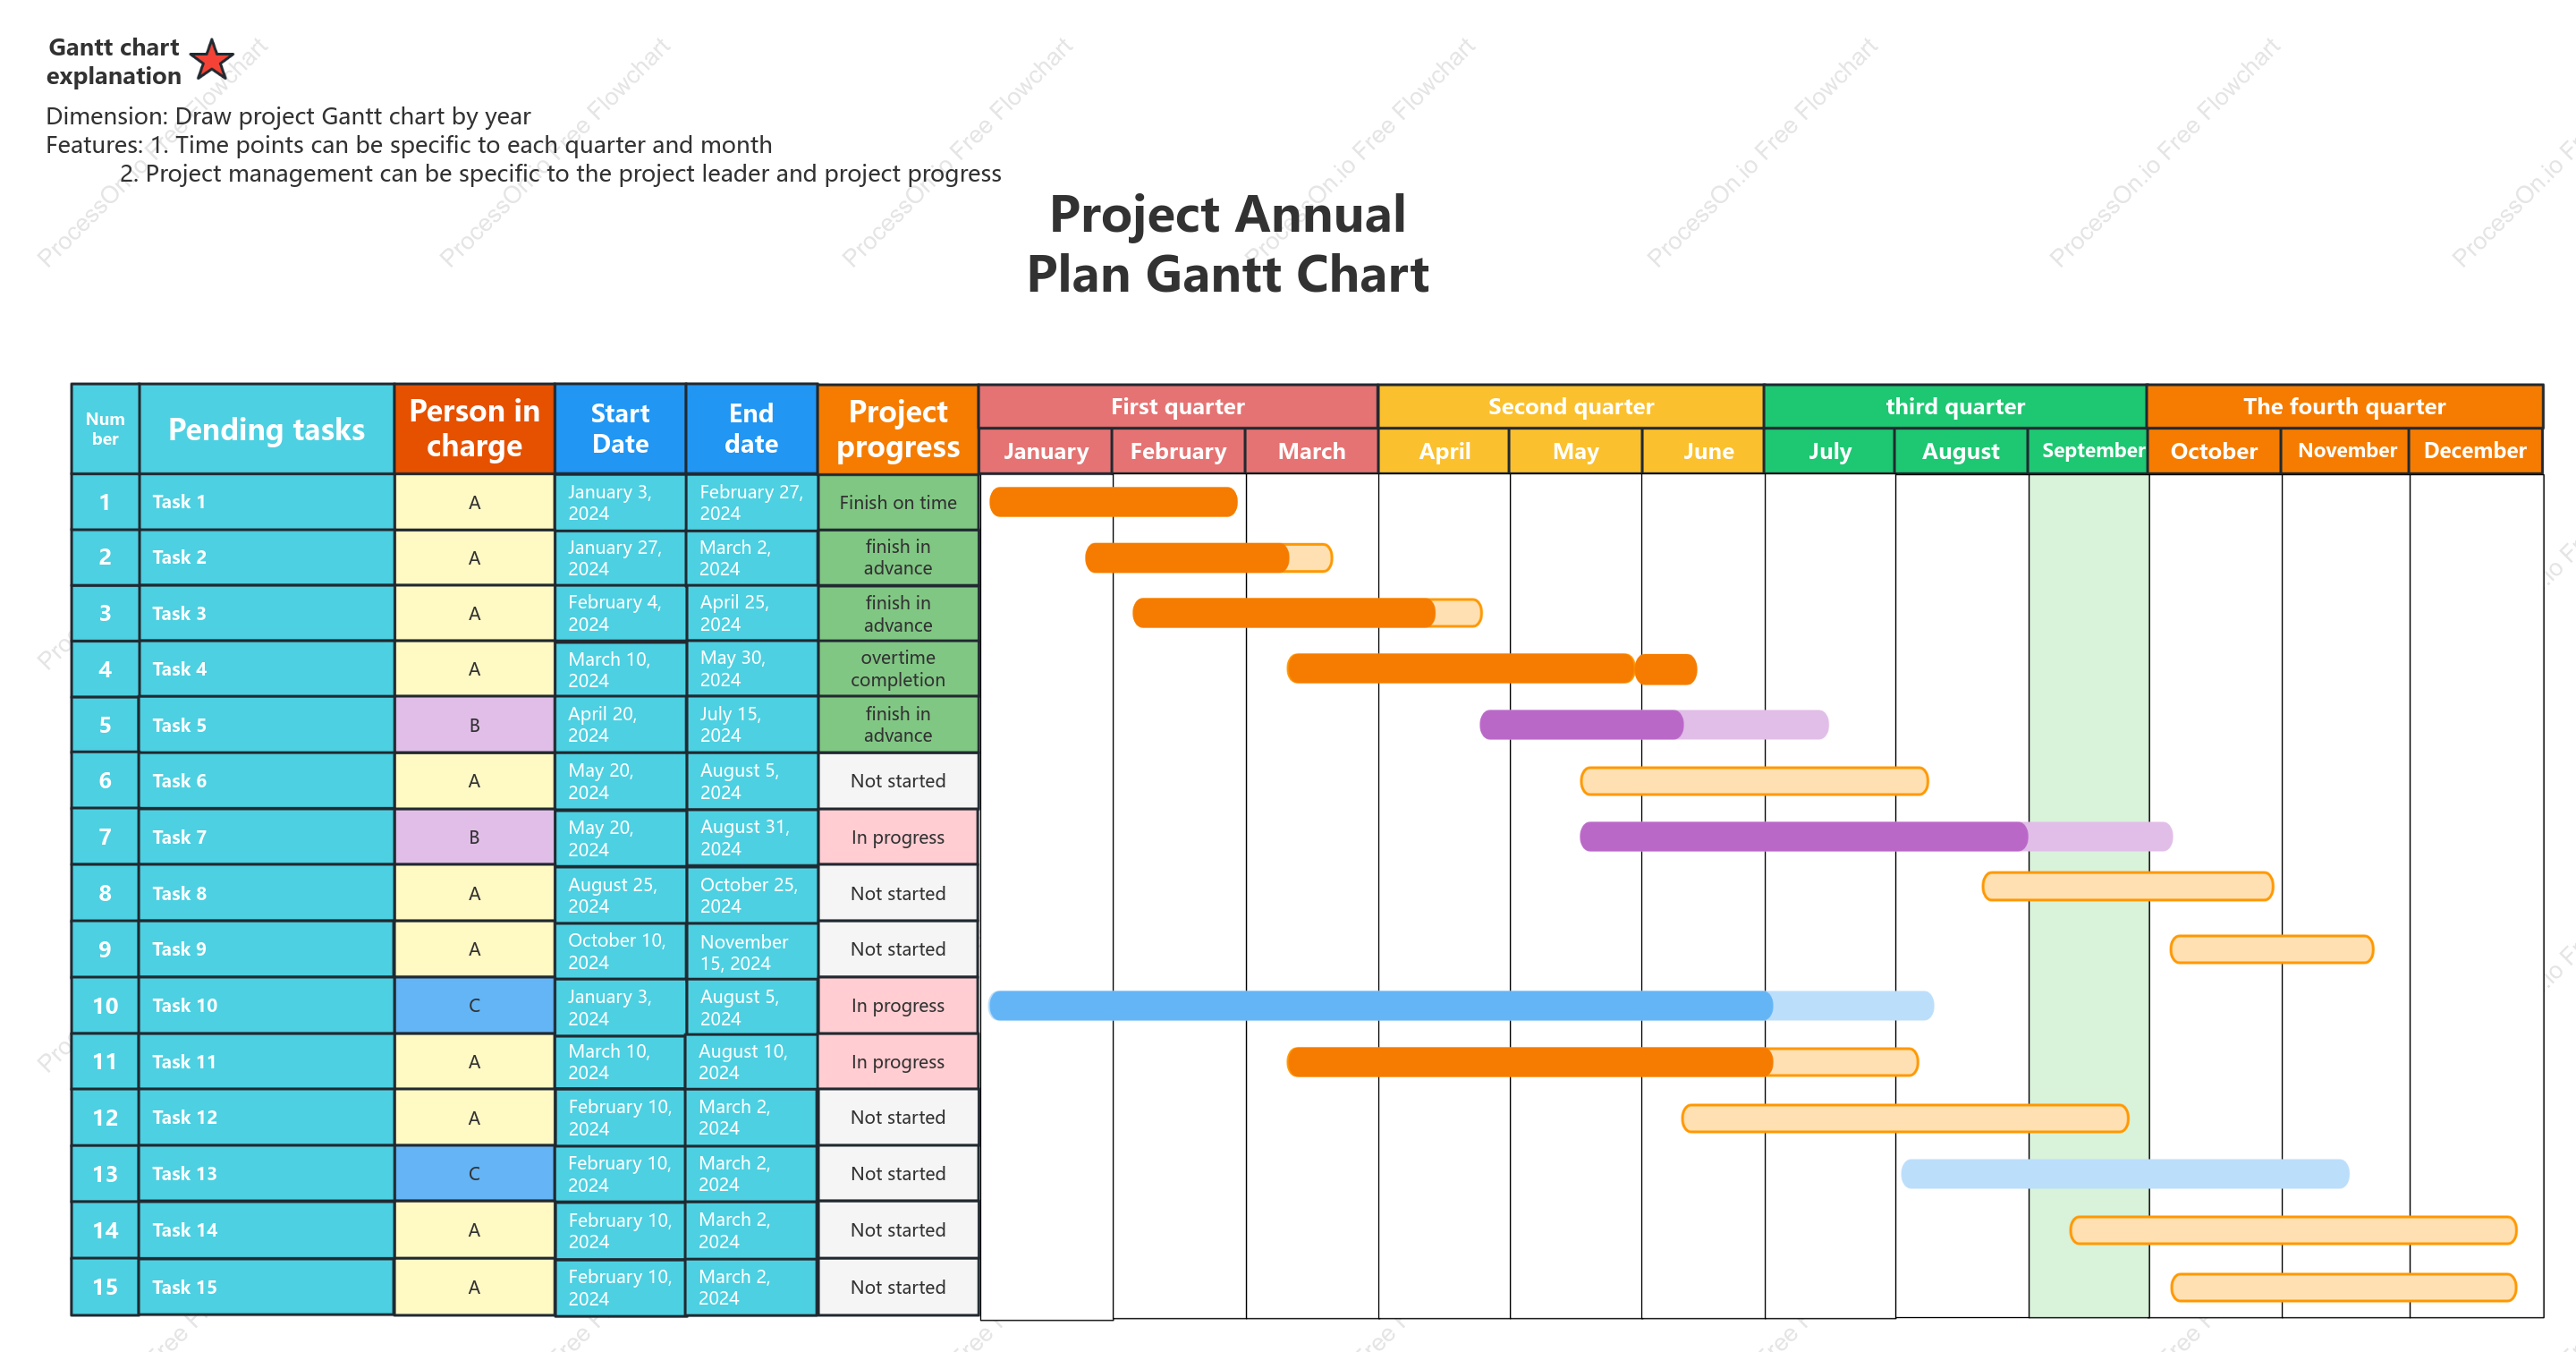
This is an Annual Plan Gantt Chart designed to illustrate the timeline and progress of various tasks throughout the year. The chart is divided into quarters and months, allowing for precise project management and tracking. Key features include the ability to monitor task statuses, such as 'Not Started,' 'In Progress,' and 'Finish in Advance,' as well as assigning responsibilities to project leaders. The Gantt chart covers tasks from January to December, with specific focus on tasks like Task 1, Task 8, and Task 15, ensuring a comprehensive overview of the annual project plan and its progress.
Related Recommendations
Other works by the author
Outline/Content
See more
End date
A
Not started
Task 1
Pending tasks
Task 10
August
Start Date
third quarter
finish in advance
2
February
Task 8
Task 15
In progress
6
C
Task 5
First quarter
Second quarter
11
Gantt chart explanation
April
13
14
November
March
January
3
5
May
Task 13
9
Task 11
Task 6
4
Task 7
B
Task 4
June
Number
October
15
Dimension: Draw project Gantt chart by yearFeatures: 1. Time points can be specific to each quarter and month 2. Project management can be specific to the project leader and project progress
12
Task 14
July
overtime completion
Task 3
Person in charge
Project progress
Task 12
September
December
8
1
Finish on time
Task 9
Project Annual Plan Gantt Chart
Task 2
The fourth quarter
7
10


Collect
Collect
Collect
Collect
Collect

0 Comments
Next Page