
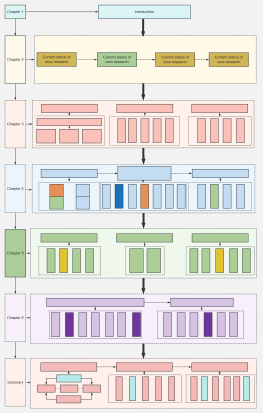
Research Project Flowchart
5 Report
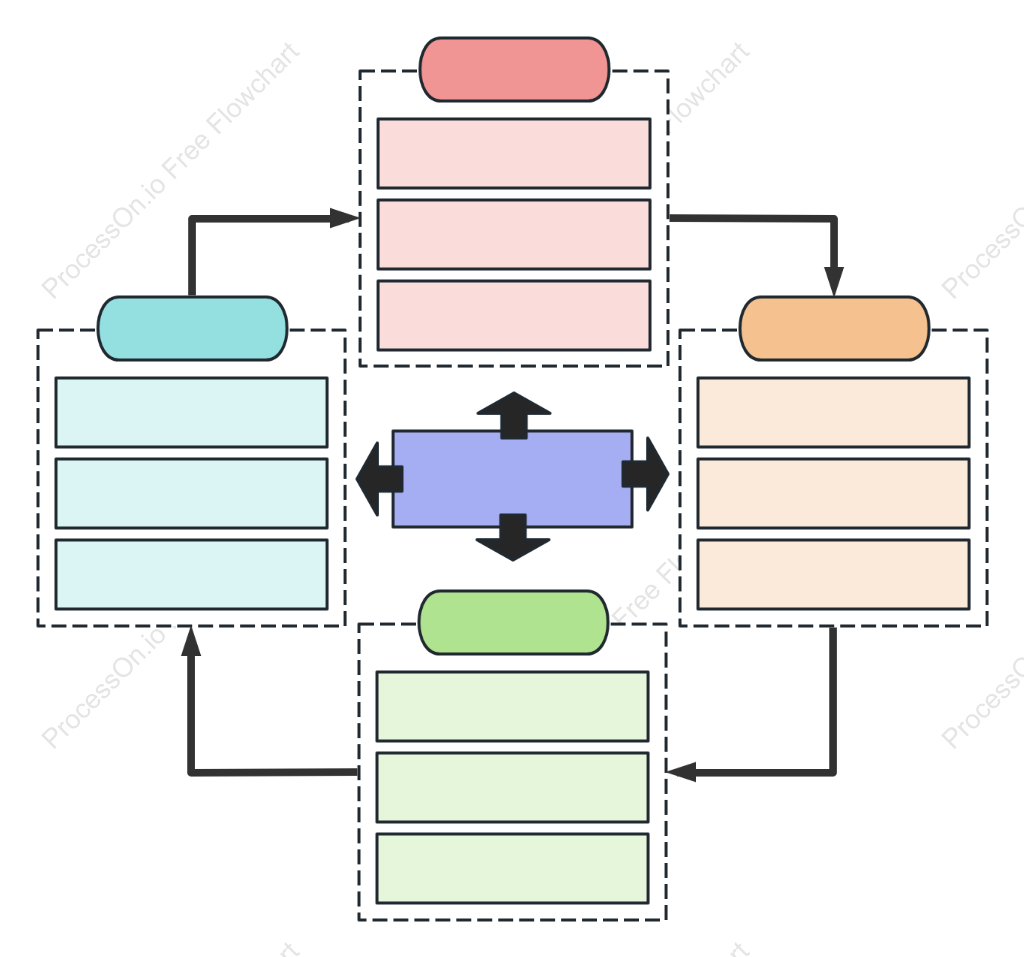
Research flowcharts are used to visually illustrate the overall steps and logical sequence of a research project or topic, typically covering core stages such as problem definition, research design, data collection and analysis, results verification, and conclusion output. Presenting the connections between each stage in a structured and visual manner helps clarify research ideas, standardize the implementation process, and improve overall research efficiency and the quality of results.
Related Recommendations
Other works by the author
Outline/Content
See more

Collect
Collect
Collect
Collect
Collect
Collect
Collect

0 Comments
Next Page