
Gantt chart 3D
0 Report
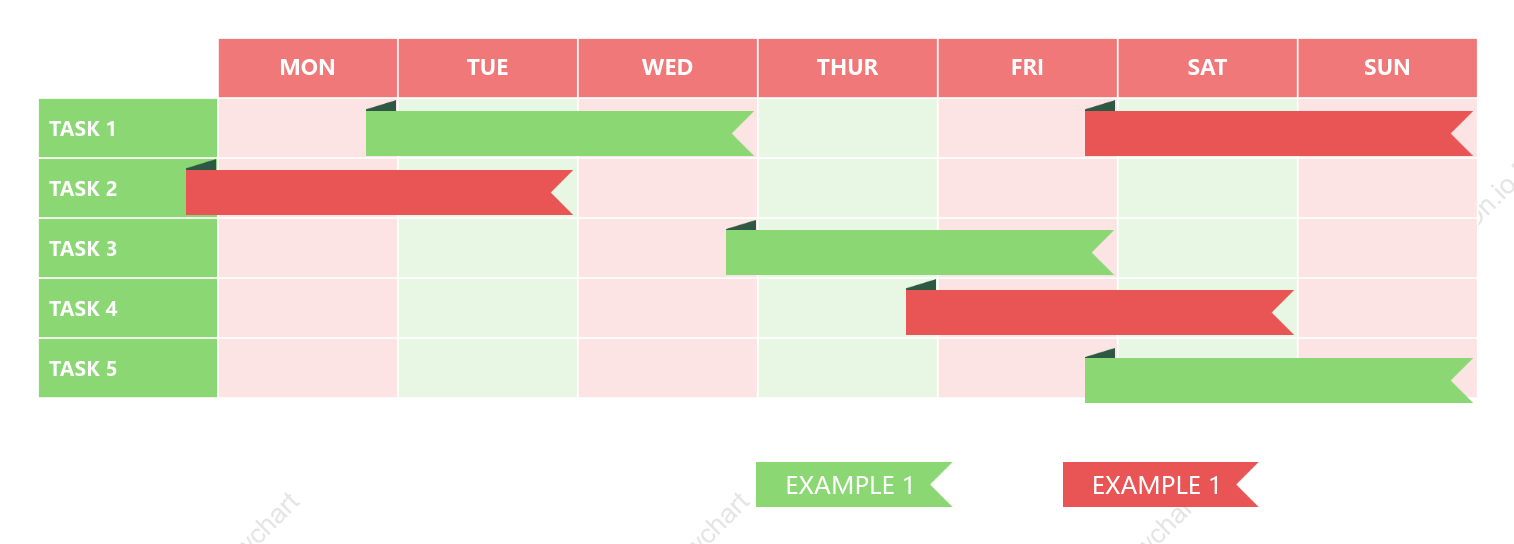
This is a 3D Gantt chart designed to visually represent the scheduling and progress of various tasks over a week. The chart includes a timeline from Monday to Sunday and tracks the progress of five tasks: Task 1, Task 2, Task 3, Task 4, and Task 5. It serves as a practical tool for project management, allowing users to efficiently allocate resources and monitor the status of each task across the days of the week. This clear, organized layout aids in ensuring that project deadlines are met and workflows are optimized.
Related Recommendations
Other works by the author
Outline/Content
See more
EXAMPLE 1
MON
TUE
WED
THUR
FRI
SAT
SUN
TASK 1
TASK 2
TASK 3
TASK 4
TASK 5


Collect
Collect

Collect
Collect

0 Comments
Next Page