
Dependency Line Gantt Chart
4 Report
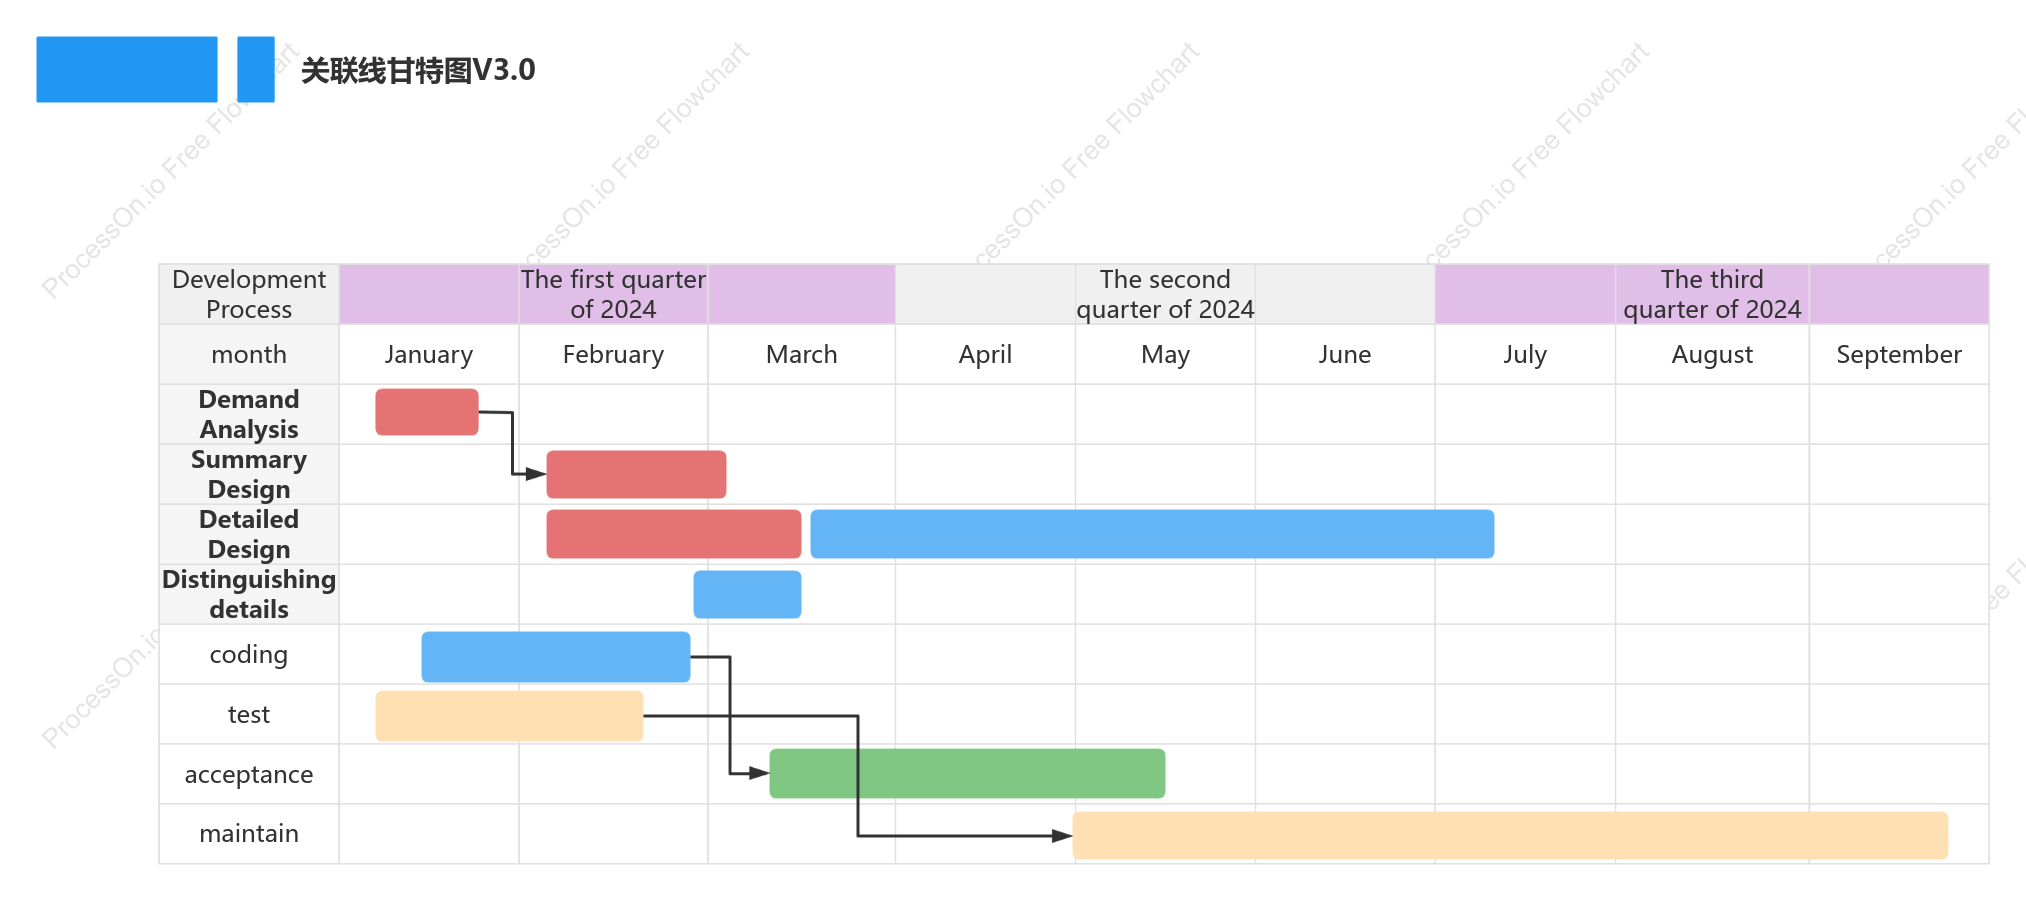
The Dependency Line Gantt Chart provides a structured overview of the development process throughout 2024, segmented into key phases over the first three quarters. It outlines critical stages such as Demand Analysis, Summary Design, and Detailed Design, followed by coding, testing, acceptance, and maintenance. Each phase is meticulously planned across the months from January to September, ensuring a comprehensive approach to project management. This chart, version 3.0, serves as a valuable tool for visualizing dependencies and timelines, facilitating efficient tracking and coordination of development activities.
Related Recommendations
Other works by the author
Outline/Content
See more
Development Process
The first quarter of 2024
The second quarter of 2024
The third quarter of 2024
month
January
February
March
April
May
June
July
August
September
Demand Analysis
Summary Design
Detailed Design
Distinguishing details
coding
test
acceptance
maintain
关联线甘特图V3.0


Collect


0 Comments
Next Page