
Gantt chart - project progress chart
3 Report
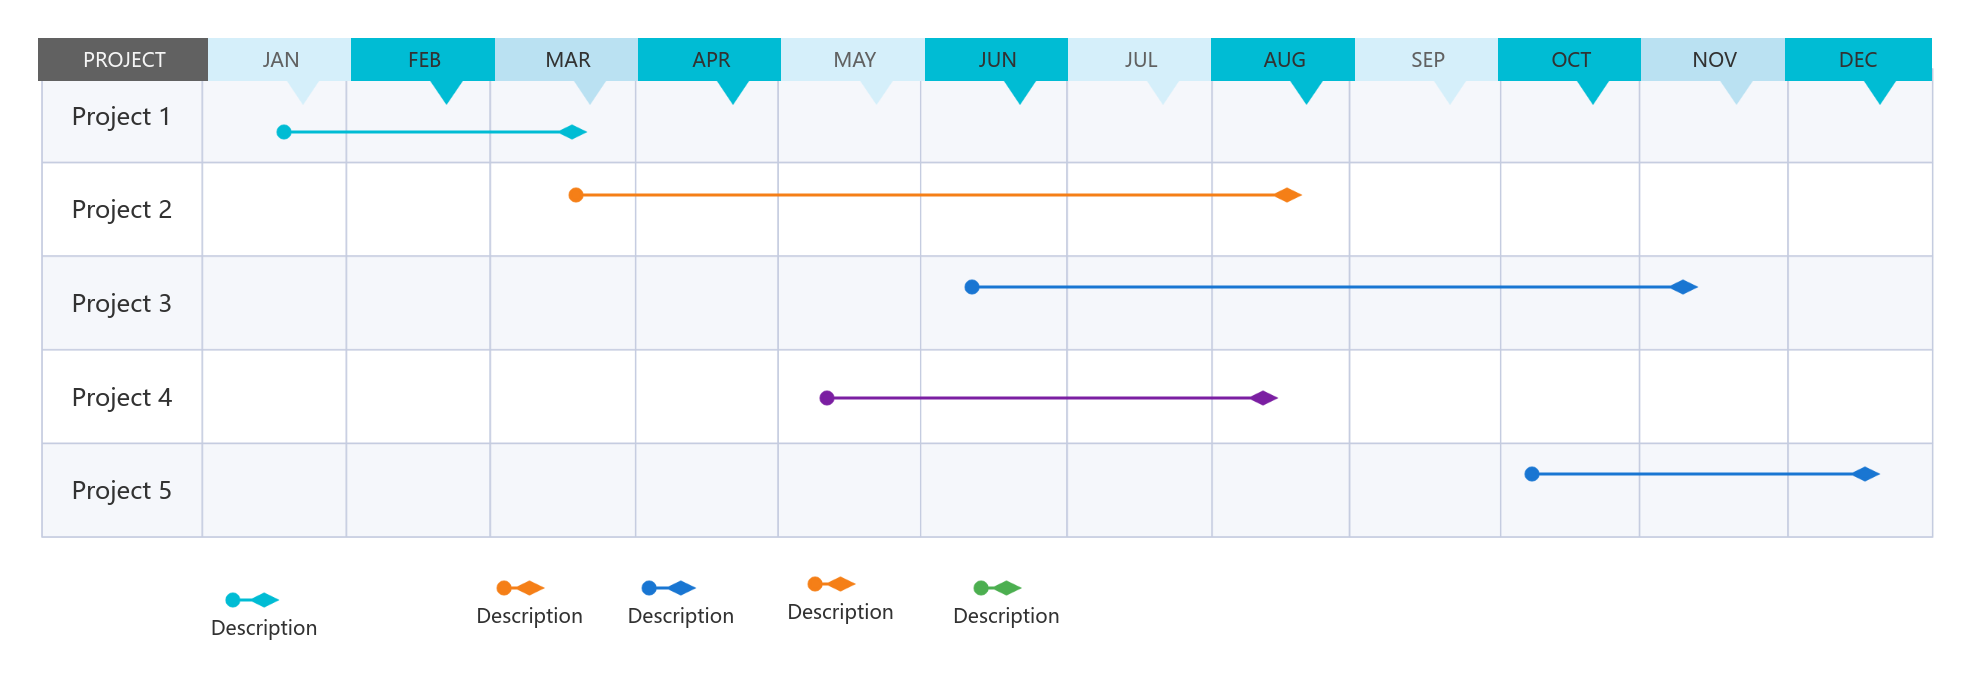
This is a Gantt chart, a project progress chart designed to illustrate the timeline and current status of multiple projects. The chart provides a detailed overview of five projects, labeled Project 1 through Project 5, spanning across various months including January, February, March, April, and beyond, up to December. Each project is broken down into specific descriptions that align with different months, allowing for a clear visualization of tasks and milestones. This chart serves as an essential tool for project management, enabling efficient tracking and coordination of project activities over time.
Related Recommendations
Other works by the author
Outline/Content
See more
Description
MAR
JUL
AUG
DEC
APR
JUN
OCT
FEB
NOV
PROJECT
Project 1
Project 2
Project 3
Project 4
Project 5
JAN
SEP
MAY


Collect

0 Comments
Next Page