
Gantt chart,horizontal bar chart
3 Report
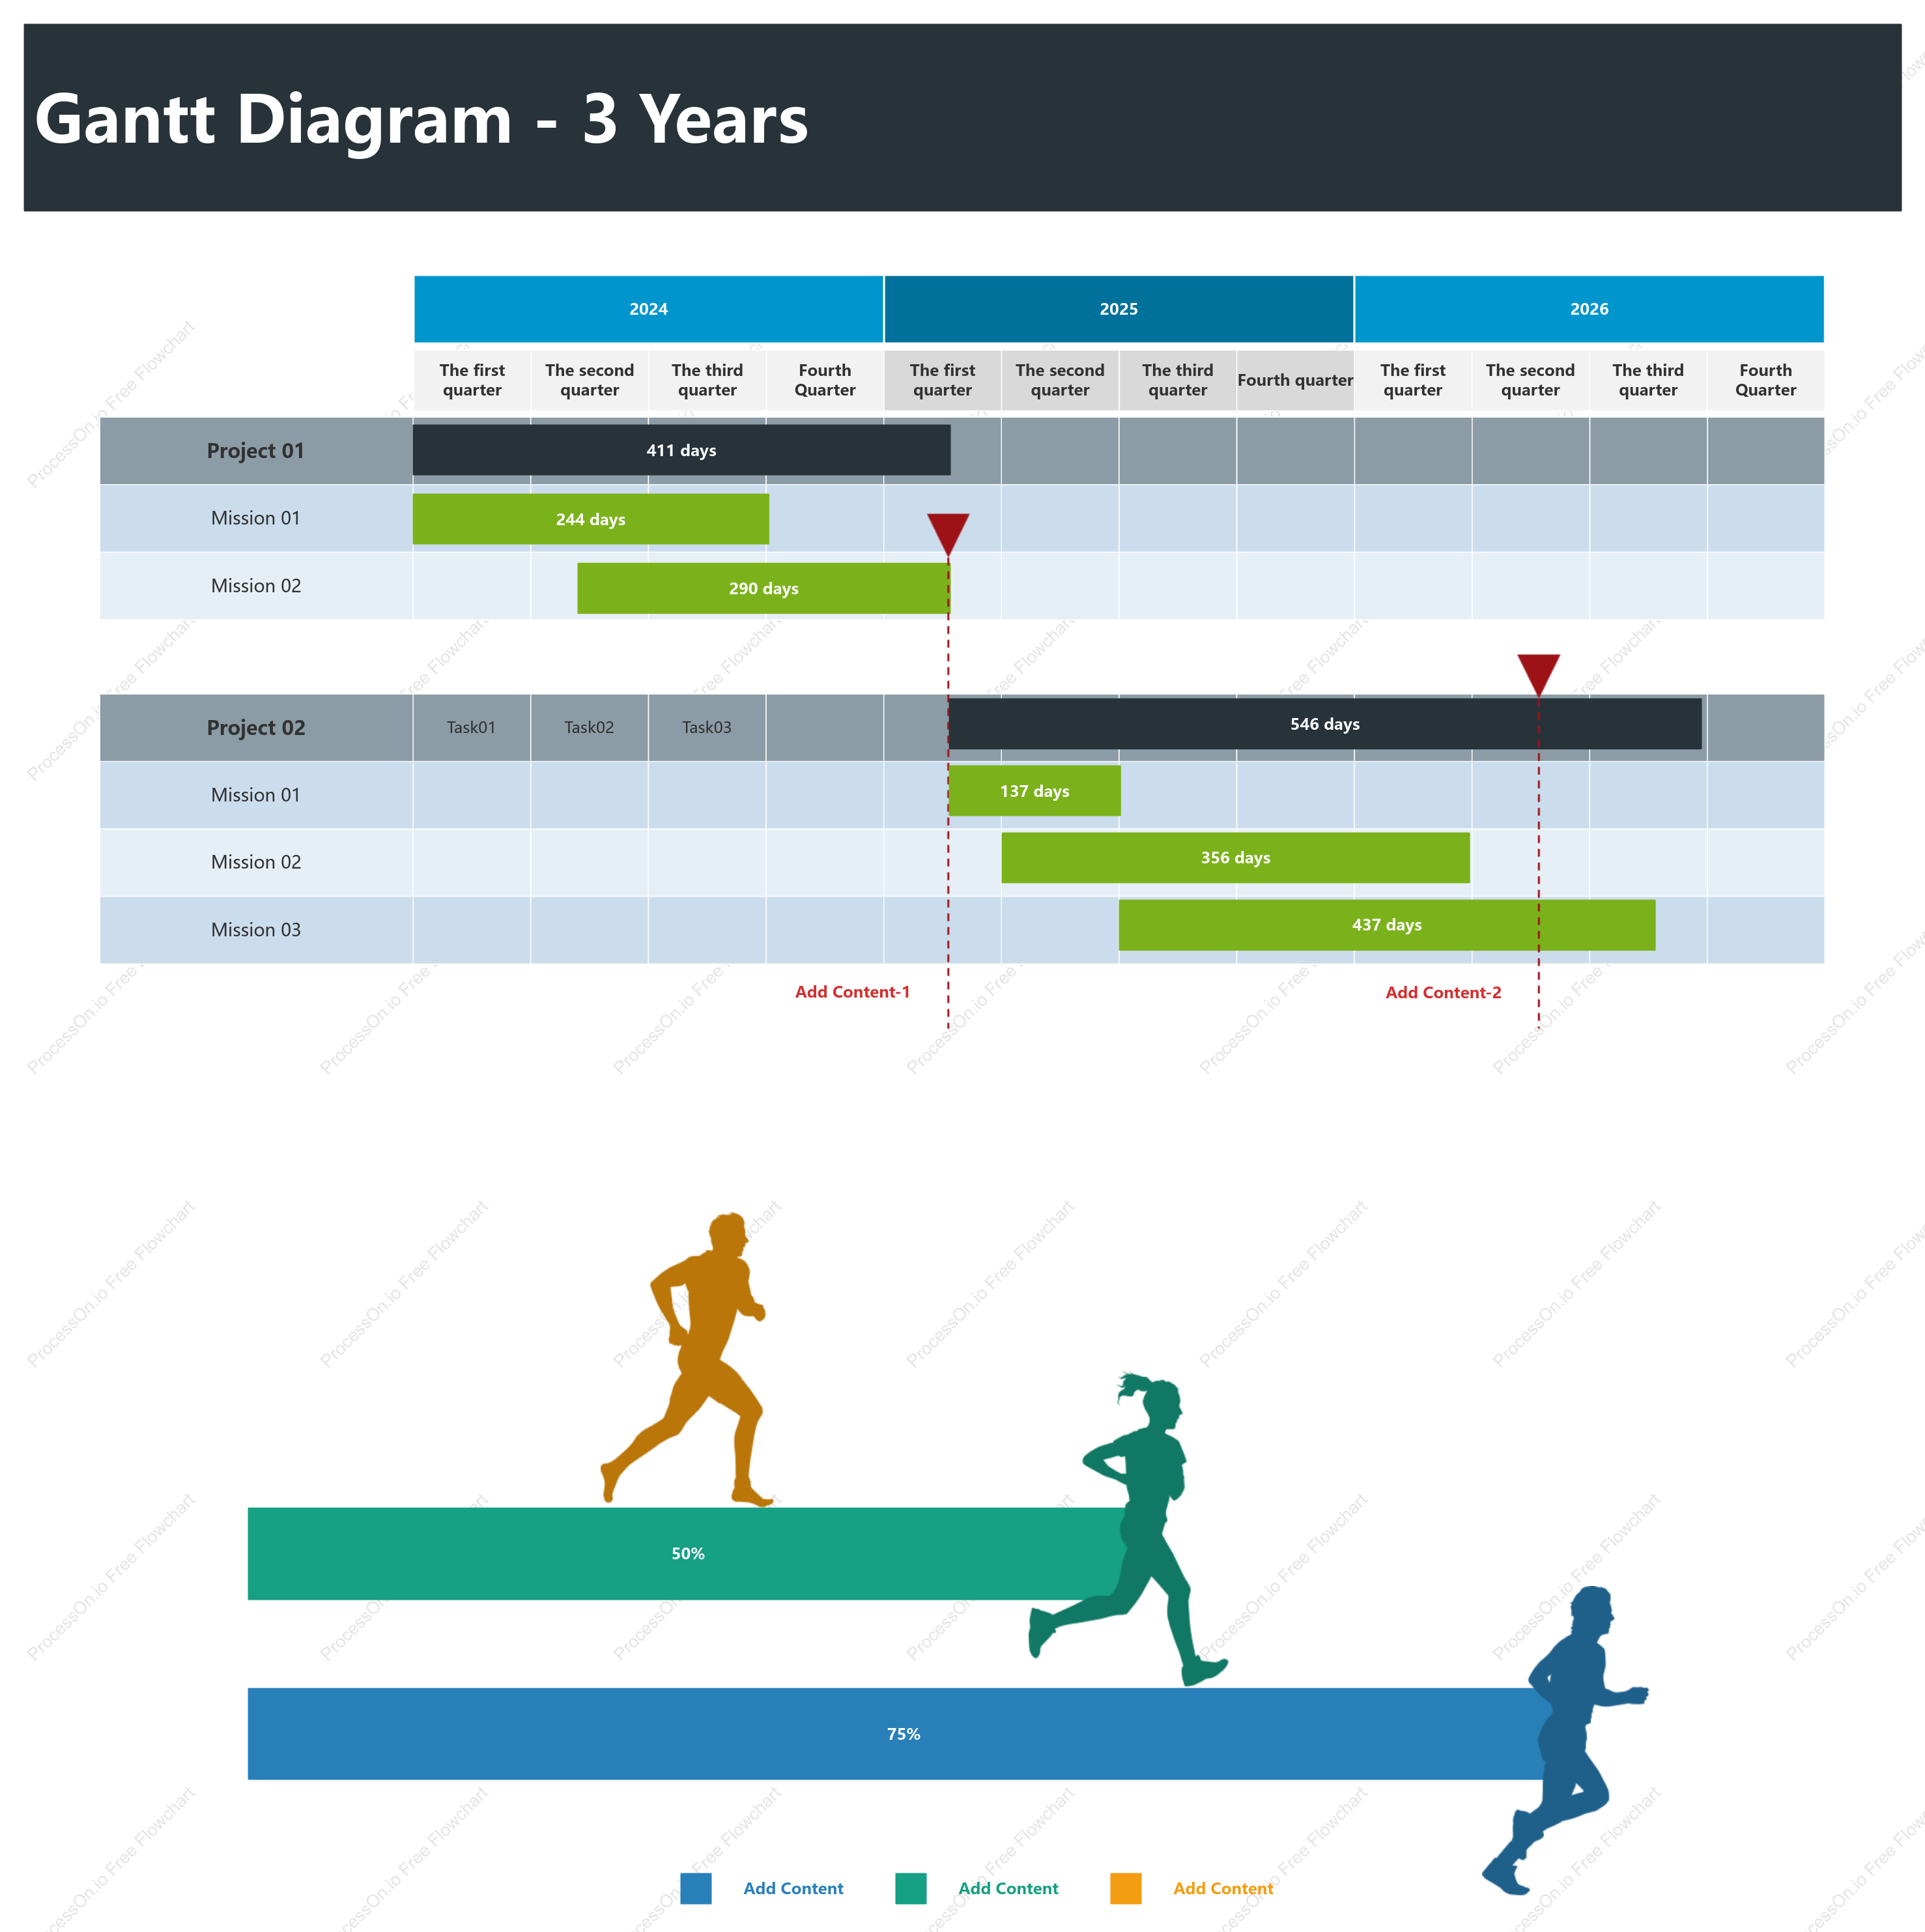
This Gantt chart and horizontal bar chart provide a comprehensive overview of a three-year project timeline spanning from 2024 to 2026. It details the progression of two major projects, Project 01 and Project 02, each comprising multiple tasks and missions. The chart outlines specific durations for tasks and missions, such as Task01 and Task02, and highlights key milestones across quarters. Project 01 includes tasks with durations of 356 and 437 days, while Project 02 encompasses tasks lasting up to 546 days. This visualization aids in tracking project timelines and ensuring efficient project management.
Related Recommendations
Other works by the author
Outline/Content
See more
50%
Add Content
356 days
2024
2025
2026
Gantt Diagram - 3 Years
437 days
Add Content-2
411 days
Add Content-1
Project 01
Task01
Task02
Mission 01
Mission 02
75%
546 days
Project 02
Task03
Mission 03
The first quarter
The second quarter
The third quarter
Fourth Quarter
Fourth quarter
290 days
137 days
244 days


Collect
Collect
Collect

Collect

0 Comments
Next Page