Process Type
Graphical expression
Mind Type
Structured expression
Note Type
Efficient expression
Treemap
Bracket Diagram
Default Mode


In the wave of digital transformation, the amount of data accumulated by enterprises is growing exponentially. However, many organizations face the dilemma of "the more data, the harder the decision-making": data is scattered across different business systems, with inconsistent formats, varying quality, and unclear lineage. How can data be made visible, understandable, and usable? One answer is data architecture diagrams.
A data architecture diagram is a visual model describing the source, storage, flow, transformation, consumption, and governance rules of an enterprise's data assets. It's not just a technical document, but also a "common language" for reaching consensus between business and technology. This article will systematically introduce the definition, function , and drawing methods of data architecture diagrams , helping you to use this tool efficiently in your work.
A data architecture diagram is a graphical representation of an enterprise's data management architecture. It illustrates the systems, components, roles, processes, and their interrelationships involved throughout the entire data lifecycle, from creation to destruction. A data architecture diagram typically includes the following:
Data source: Where does the data come from (business systems, IoT, third-party APIs, log files, etc.)?
Data storage: Where is the data stored (data lake, data warehouse, data mart, relational database, NoSQL, etc.)?
Data processing: How data flows and is transformed (ETL/ELT pipelines, stream processing, batch processing).
Data consumption: Who uses the data (BI reports, data science models, business applications, external systems).
Data governance: data standards, quality rules, metadata management, security and privacy controls.
Unlike software architecture diagrams, which focus on "how the system operates," data architecture diagrams focus on "how data flows and is managed." They are an essential blueprint for projects such as data governance, data integration, and the construction of data platforms.
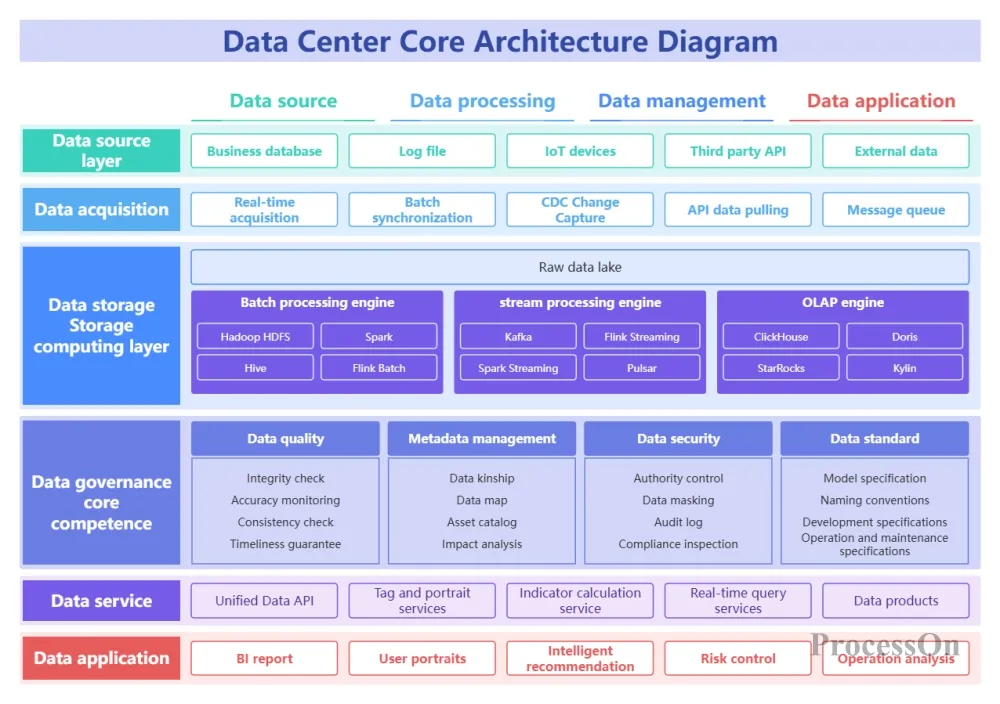
Data Platform Core Architecture Diagram
Many enterprises, after years of IT infrastructure development, have developed multiple independent systems such as CRM, ERP, and SCM, with data isolated from each other. A data architecture diagram can visually demonstrate the data interaction relationships between these systems, helping to identify problems such as redundant data collection, duplicate storage, and inconsistent data definitions.
Without a clear data architecture, data governance is like "the blind men and the elephant." A data architecture diagram clarifies the owner, source, quality indicators, and lifecycle management strategies for each type of data, providing a foundation for data standardization and lineage tracing.
Concepts such as "customer information" and "order details" that business users care about can be mapped to specific tables, fields, and processing logic in the data architecture diagram. A single diagram allows business users and data engineers to communicate on the same page, reducing misunderstandings about requirements.
When enterprises need to build a data middle platform or upgrade their data lake, data architecture diagrams can help architects assess existing data flow bottlenecks and select appropriate storage engines, computing engines, and integration tools.
For industries such as finance, healthcare, and government, regulatory agencies often require companies to provide data flow diagrams to demonstrate their measures for protecting sensitive data. Data architecture diagrams are an important deliverable for compliance audits.
For CTOs: Emphasize the role of data in supporting business value and stress the rationality of technology selection.
For data engineers: Shows detailed information on components, versions, data flow, and dependencies.
Audit-oriented: Reflects data security and privacy protection mechanisms.
System list: All data sources, middleware, databases, and platforms involved.
Data flow description: extraction frequency (real-time/hourly/day), data volume, and transformation rules for each dataset.
Interface information: Connection methods such as API, JDBC, and message queue.
Governance requirements: Data quality SLA, retention period, compliance requirements.
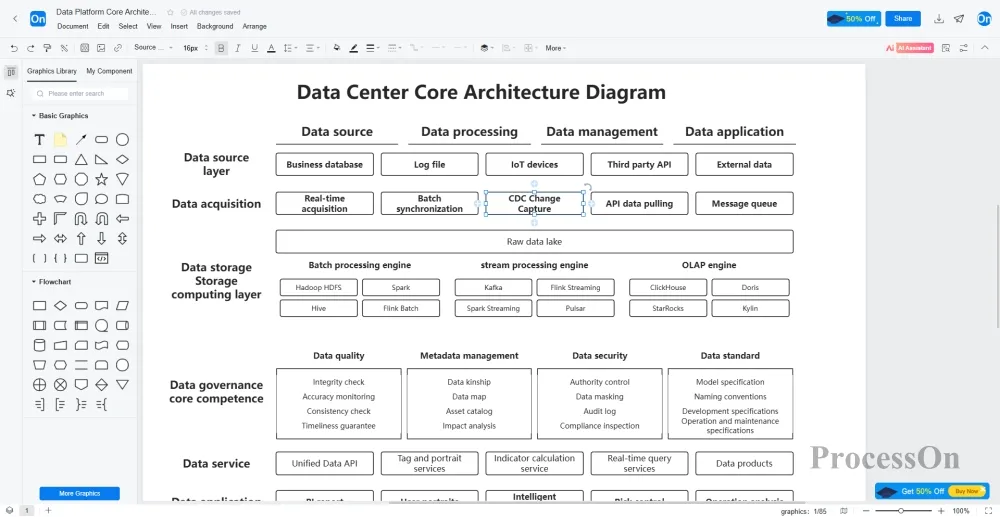
We recommend using online charting tools such as ProcessOn for the following reasons:
It offers a rich set of data architecture diagram templates (data lake, data warehouse, data integration, etc.) that can be reused with one click.
It supports drag-and-drop drawing, automatic alignment, and includes built-in icon libraries from AWS, Azure, and Alibaba Cloud.
Team collaboration features allow multiple people to edit simultaneously and leave comments.
It can export in various formats (PNG, PDF, SVG) for easy embedding in documents.
Determine the layering: Typically, a horizontal layering layout is used, following the sequence "Data Source → Data Acquisition → Data Processing → Data Storage → Data Service → Data Consumption". Alternatively, a vertical stacking approach can be adopted, following the sequence "Bottom Layer → Middle Layer → Application Layer".
Placement of components: Represent each system/tool with a rectangle, labeled with its name and version.
Add comments: For non-standard components or complex conversion logic, add text box descriptions.
Check for completeness: Ensure that the data entry and exit points for each business line are clear and there are no "mysterious black boxes".
Enhancement and Export: Unify color scheme (it is recommended to use different colors to distinguish different technology stacks or environments), add title, legend, date and author.
The ProcessOn community offers a wealth of data architecture diagram templates and examples for reference, and supports cloning for easier drawing. Below are some shared templates.
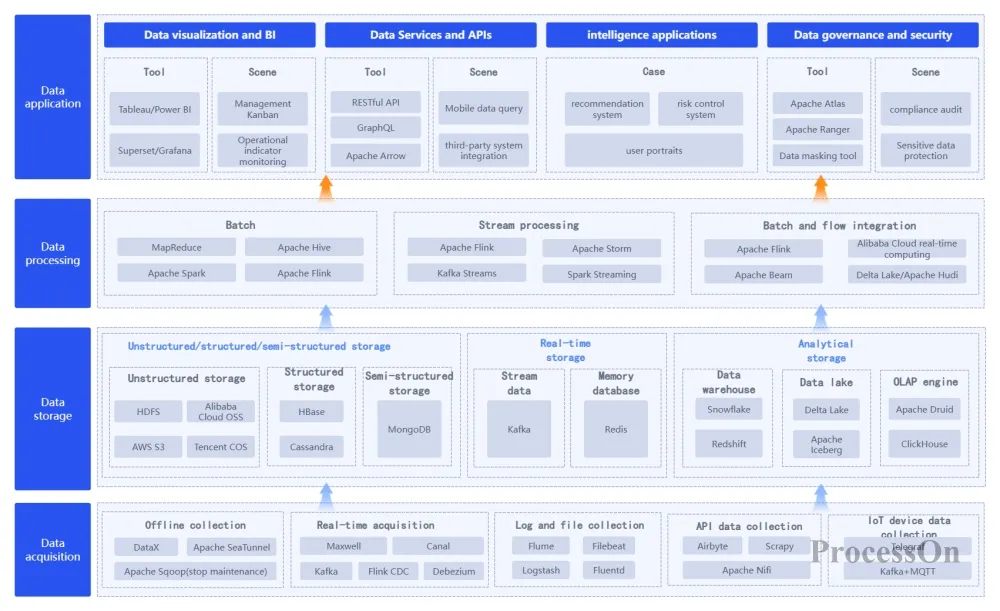
Big Data Product System Architecture Diagram
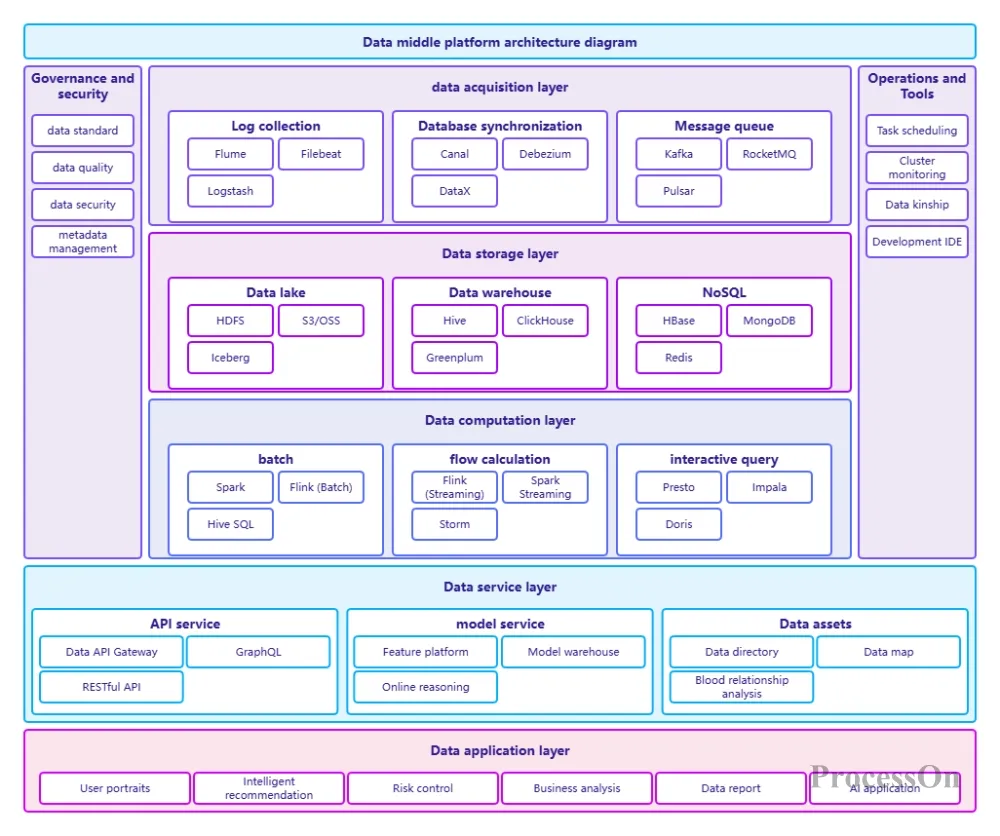
Data Platform Architecture Diagram
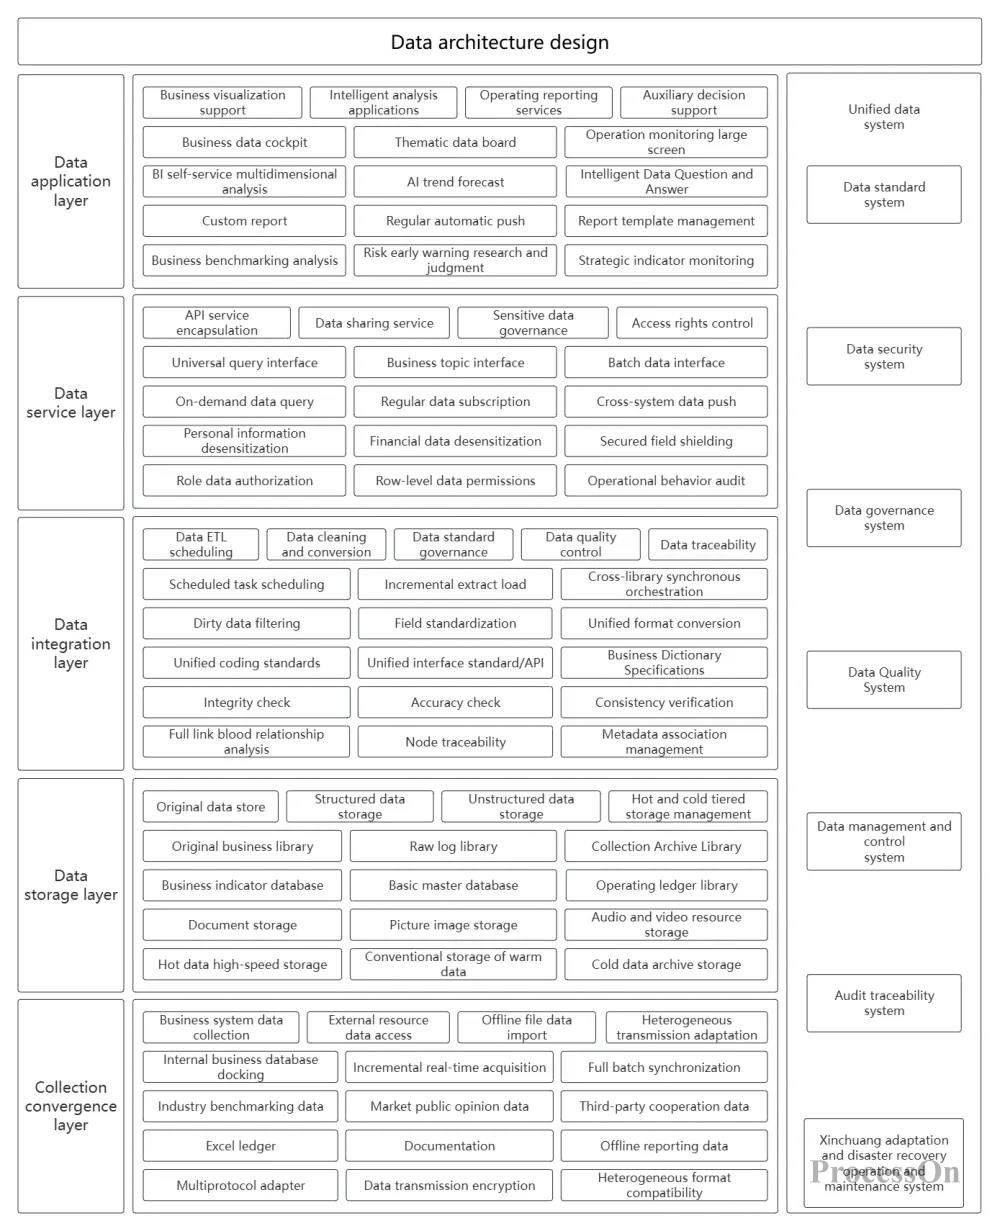
Architecture Diagram - Data Architecture Design
Data architecture diagrams are not one-off creations, but rather lifecycle assets that evolve alongside the data platform. Regularly reviewing data architecture diagrams can uncover data redundancy, performance bottlenecks, and security vulnerabilities, thereby driving technological upgrades and governance optimizations. For individual career development, engineers or analysts who can clearly visualize data architecture diagrams often take the initiative in cross-team collaborations and architecture design reviews.
A well-designed data architecture diagram can make the complex world of data orderly, transparent, and controllable. Why not start today by drawing the first architecture diagram for the data system you're responsible for? You might discover many previously overlooked details and optimization opportunities.