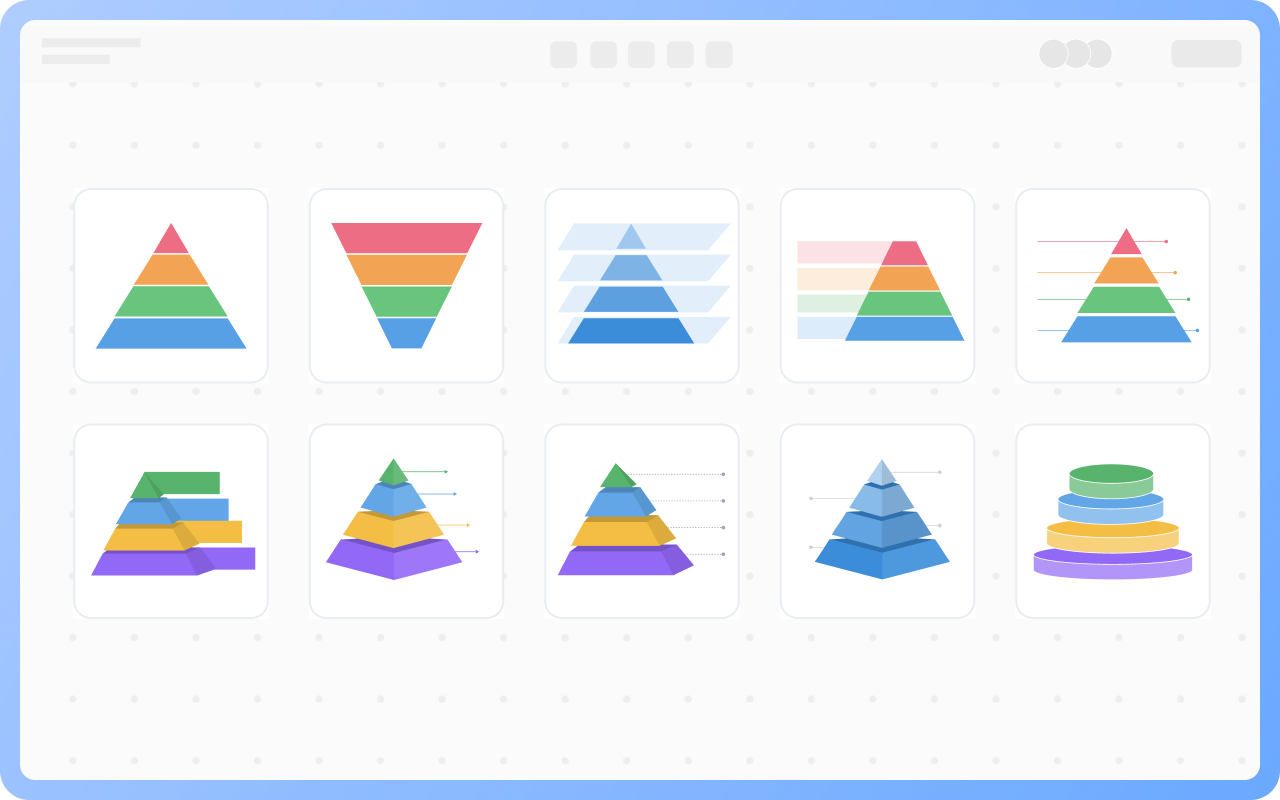
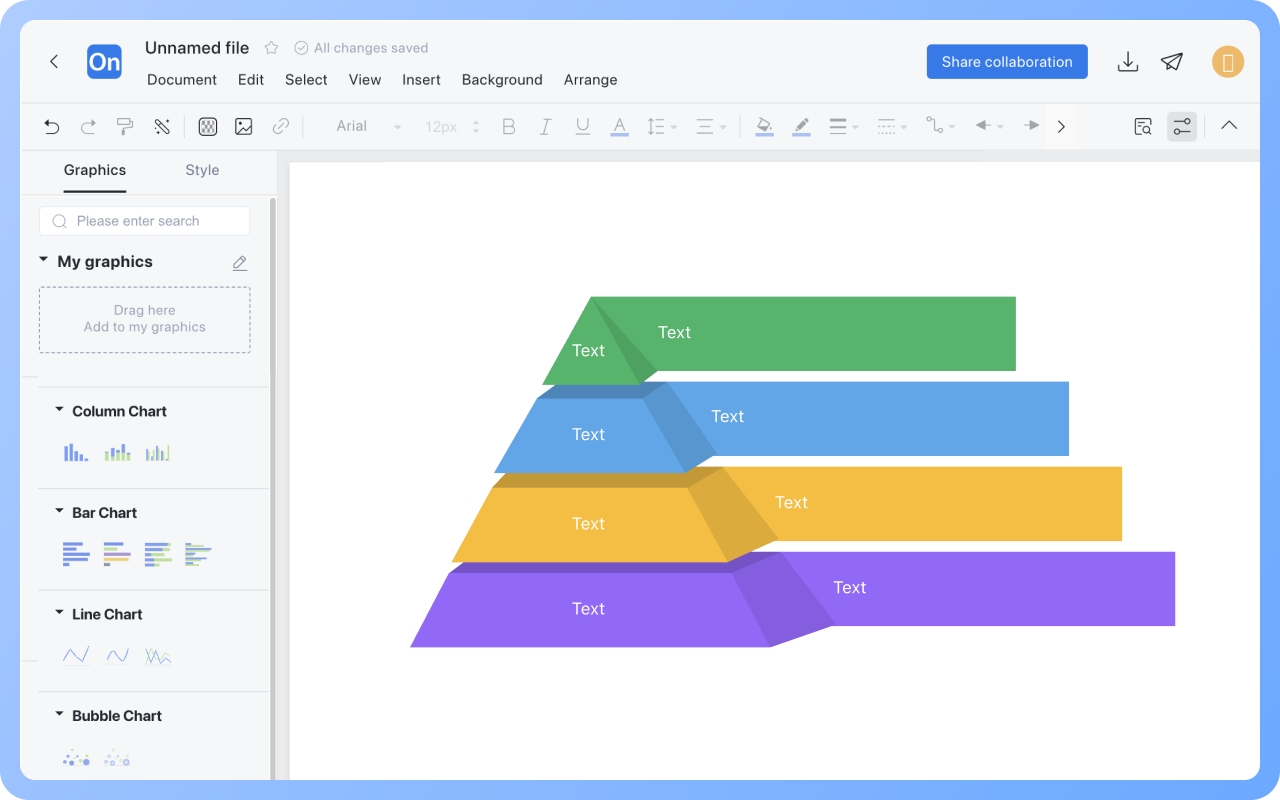
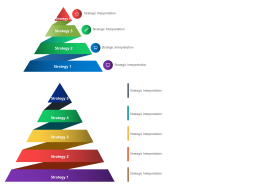
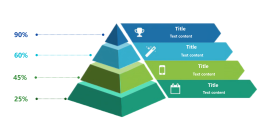
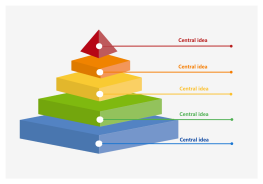
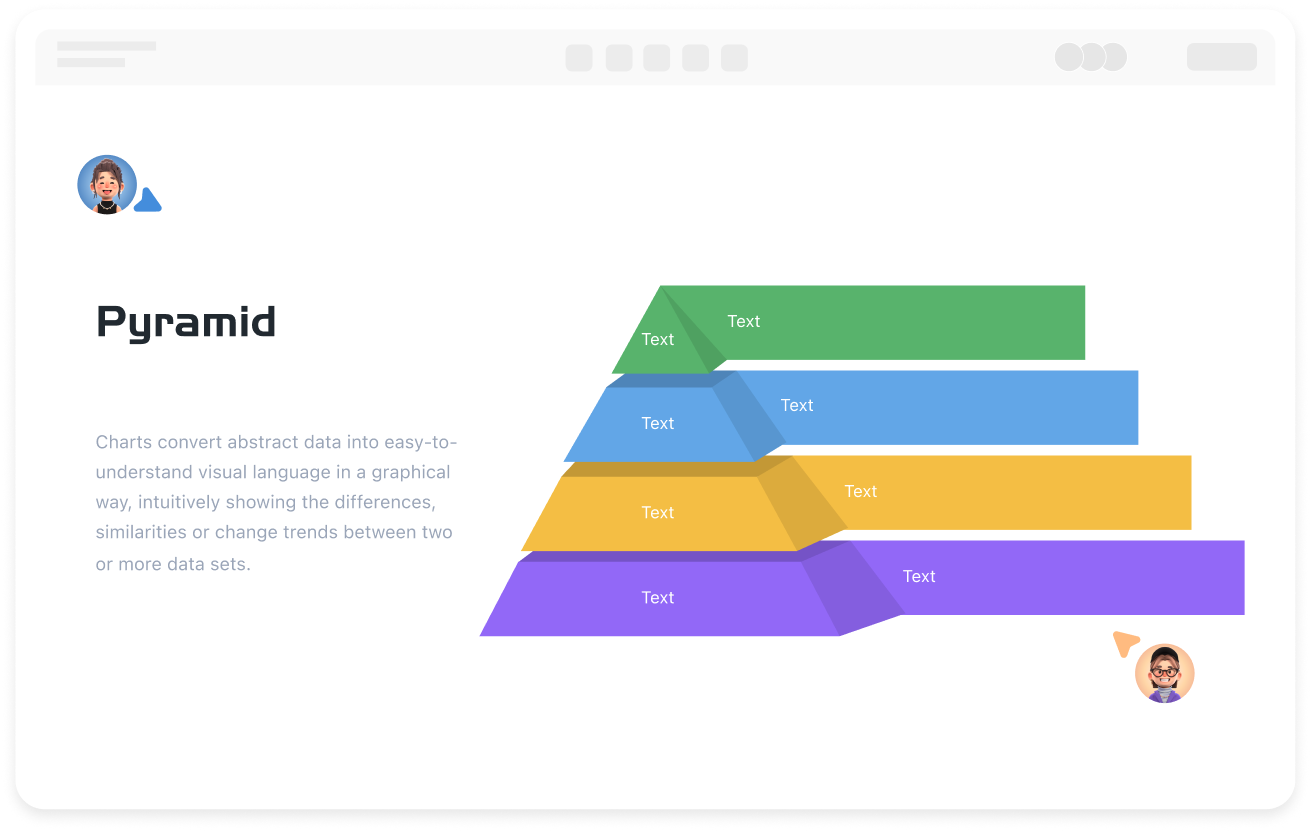
Register
Process Type
Graphical expression
Mind Type
Structured expression
Note Type
Efficient expression

Online Pyramid Chart Maker

Free to use
Online Pyramid Chart Maker
What is Pyramid Chart

A pyramid chart is a type of chart that represents proportional relationships by dividing the height of each block in the chart to show the proportions.
ProcessOn supports online creation of pyramid charts and offers a large number of templates and examples for copying, allowing you to easily draw professional and aesthetically pleasing pyramid charts.

Free to use

ProcessOn Pyramid Chart Key Features

Online Collaboration

Supports real-time multi-user co-creation with shareable links for instant information transfer

Online Collaboration
One-Click AI Generation

Automatically generates graphics from text input and applies style enhancements

One-Click AI Generation
Personalized Style Customization

Prebuilt themes with full customization for personalized designs

Personalized Style Customization
Multiple Component Types

Supports icons, images, labels, LaTeX formulas, code blocks, links, attachments and more

Multiple Component Types
Multi-Format Compatibility

Export: PNG, VISIO, PDF, SVG | Import: VISIO, Mermaid

Multi-Format Compatibility
Cross-Device Sync

Real-time cloud storage, multi-device sync, version history, and secure data protection

Cross-Device Sync
Common Pyramid Diagram Models

Pyramid diagrams have widespread applications in psychology, management, scientific research, and other fields. Common pyramid diagram models include Maslow's Hierarchy of Needs Pyramid Model, Energy Management Pyramid Model, Learning Pyramid Model, and Population Pyramid Model.

Create Charts Online
Common
Structure of the Pyramid Diagram

Base (Bottom Layer): Carries foundational data or core arguments, supporting the upper logic.
Body (Middle Layer): Breaks down detailed dimensions or progressive deductions, reflecting logical connections.
Tip (Top Layer): Presents core conclusions or global insights, guiding decisions.

Create Charts Online
Structure
Maslow's Hierarchy of Needs Pyramid Model

Maslow's theory of needs divides human needs into five levels from basic to advanced: physiological needs, safety needs, social needs, esteem needs, and self-actualization needs. Maslow used a pyramid diagram to visually represent the relationships among these five levels.

Create Charts Online
Maslow's
Learning Pyramid Model

The Learning Pyramid Model is used to describe different levels in the process of human knowledge acquisition. The model divides learning into two major categories: passive learning and active learning, further subdivided into five levels: listening, reading, audiovisual, demonstration, and practice. By progressively upgrading different learning methods, people can master the learned knowledge more effectively.

Create Charts Online
Learning
Best Practices for Designing Pyramid Diagrams

Number of Levels: Recommended ≤5 levels to avoid information overload.
Proportion Annotation: Avoid showing only graphics without specific values; key proportions can be annotated at the base/tip.
Trend Comparison: Overlay historical data to show changes in the pyramid diagram structure over time.

Create Charts Online
Best

Pyramid Chart How to Draw?

Pyramid ChartHow to Draw?
1
Create a new flowchart, check the category of required graphic symbols in the 'More Shapes' below the graphics area.
2
Select the graphic symbols from the symbol library on the left, drag them onto the canvas, and combine them into a pyramid chart.
3
Select the graphic elements of the pyramid chart, and drag the border to set the width and height of the graphic.
4
Drag text labels from the left graphics area into the tower to annotate the representative meaning and proportion of each block.
5
Modify the style of each block in the pyramid chart, such as color, lines, fonts, etc. Different categories of blocks should use different colors to distinguish them.
Free to use

Pyramid Chart Drawing Guide

  • How to make a pyramid chart? Tutorials and templates

    How to make a pyramid chart? Tutorials and templates

    In data visualization and information communication, the pyramid chart is a very effective tool. It displays information through a hierarchical structure, helping people quickly understand complex concepts or data distribution. This article will comprehensively introduce this powerful visualization tool through the concept, examples , drawing methods , templates, etc. of the pyramid chart .
    Skye
    2025-02-13
    1058
  • Comprehensive Guide to Radar Charts - Concepts, Examples, Templates

    Comprehensive Guide to Radar Charts - Concepts, Examples, Templates

    Radar chart, also known as spider chart or polar chart, is a type of chart used to display multivariate data , helping us understand and analyze complex data . It is widely used in business decision-making, financial investment, human resources and other fields. This article will give a comprehensive introduction to radar chart, including its definition, application scenarios, drawing tools, drawing methods , etc.
    Skye
    2025-02-17
    1064
  • How to create a spider diagram? Tutorials and templates

    How to create a spider diagram? Tutorials and templates

    Spider diagrams are similar in appearance to mind maps, but have a more sophisticated and flexible structure. They are centered around a central idea, with other related concepts and details branching out from this central point to form a radial network structure. This type of diagram not only helps to organize and display complex information, but also inspires innovative thinking and deepens understanding. The following is a comprehensive introduction to spider diagrams, including its concepts, drawing tools , drawing methods , and sharing of rich examples and templates .
    Skye
    2025-02-10
    1058

Pyramid Chart Template Recommendations

More Templates

Pyramid Chart Frequently asked questions

How to fill the colors of each block in the pyramid chart?

Select the blocks of the pyramid chart, use the 'Color Fill' in the top toolbar to set the color of each block, and 'Line Color' to set the color of the block borders.

Can the height of the blocks in the pyramid chart be set?

Yes, it can. Select the block, click the small squares at the corners to set the width and height of the block, and click the small square in the middle line of the block to adjust only the height of the block.

How to keep the spacing between blocks in the pyramid chart consistent?

Press 'Ctrl' to select all blocks of the pyramid chart, and click 'Distribute Align' in the top toolbar to adjust the layout of the blocks.

Are there templates or examples of pyramid charts available for reference?

You can visit the ProcessOn template community, where there are a large number of pyramid chart templates and examples available for free cloning and use.

What is the difference between a pyramid chart and a funnel chart?

A pyramid chart focuses on describing the composition and proportion of the overall system, while a funnel chart focuses more on the attrition and retention of data at each stage.

Related Diagrams