Register
Process Type
Graphical expression
Mind Type
Structured expression
Note Type
Efficient expression

Professional Online Matrix Diagram Drawing Tool

Free to use
Professional Online Matrix Diagram Drawing Tool
What is Matrix Diagram

A matrix diagram is a visualization tool that uses a two-dimensional table of rows and columns to cross-display relationships or data distribution among multiple factors. It is often used to analyze the correlation, priority, or contrasting differences of complex issues (such as task allocation, decision evaluation, data comparison, etc.).
ProcessOn supports online creation of matrix diagrams and offers a vast array of matrix diagram templates and examples for easy creation of professional and aesthetically pleasing matrix diagrams.

Free to use

ProcessOn Matrix Diagram Key Features

Online Collaboration

Supports real-time multi-user co-creation with shareable links for instant information transfer

Online Collaboration
One-Click AI Generation

Automatically generates graphics from text input and applies style enhancements

One-Click AI Generation
Personalized Style Customization

Prebuilt themes with full customization for personalized designs

Personalized Style Customization
Multiple Component Types

Supports icons, images, labels, LaTeX formulas, code blocks, links, attachments and more

Multiple Component Types
Multi-Format Compatibility

Export: PNG, VISIO, PDF, SVG | Import: VISIO, Mermaid

Multi-Format Compatibility
Cross-Device Sync

Real-time cloud storage, multi-device sync, version history, and secure data protection

Cross-Device Sync
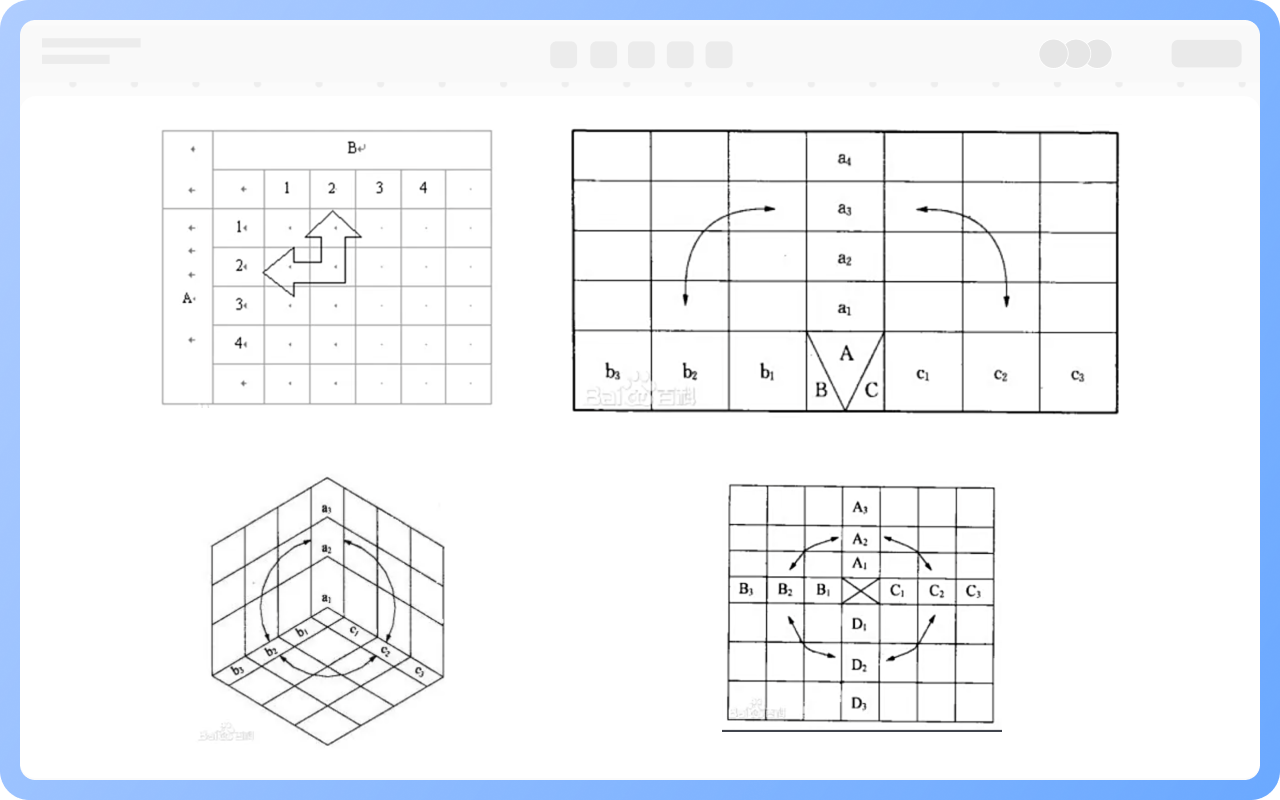
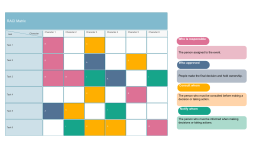
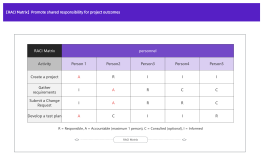
Types of Matrix Diagrams

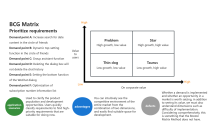
L-shaped matrix: Basic two-dimensional table showing the relationship between two factors.
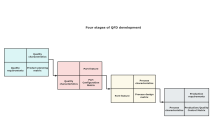
T-shaped matrix: Extends the L-shaped matrix to three factors (e.g., rows, columns, additional information at intersections).
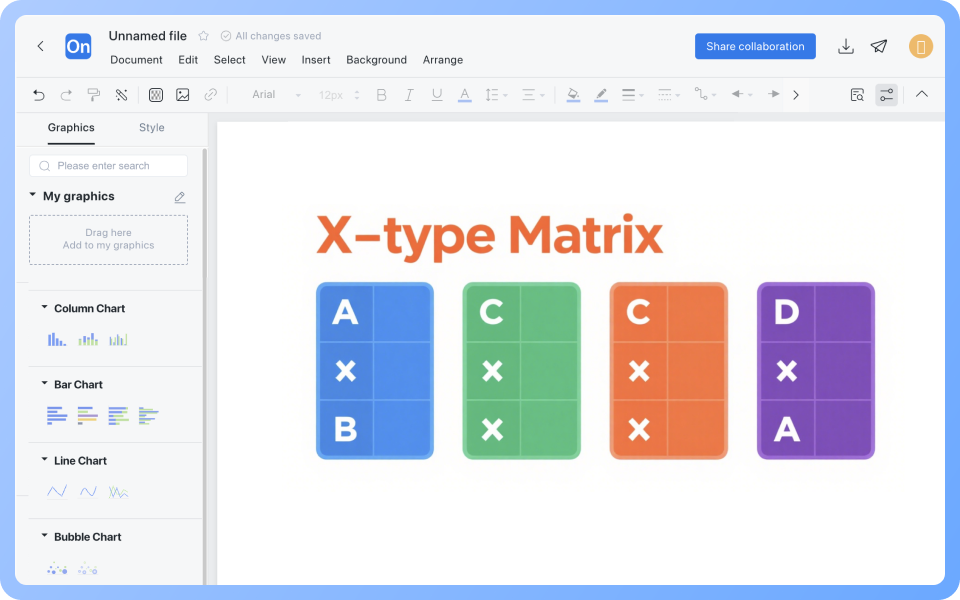
X-shaped matrix: Analyzes the interrelationship of four groups of factors (e.g., balancing quality, cost, time, and risk).
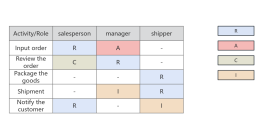
Y-shaped matrix: Shows the bidirectional relationship among three groups of factors (e.g., interaction of suppliers, products, and customers).

Create Charts Online
Types
Functions of Matrix Diagrams

Relationship Analysis: Reveals the correlation between factors (e.g., matching tasks and resources, corresponding issues and causes).
Comparison Display: Horizontally or vertically compares data differences (e.g., sales data comparison by region and product category).
Priority Sorting: Marks importance through symbols or numerical values (e.g., high/medium/low risk in risk assessment matrices).
Decision Support: Assists in multidimensional decision-making (e.g., product portfolio selection, investment project evaluation).

Create Charts Online
Functions
Advantages of Matrix Diagrams

Multidimensional Analysis: Supports analysis from two-dimensional to four-dimensional and even three-dimensional space relationships, adapting to problem scenarios of varying complexity.
Relationship Visualization: Quantifies relationship strength through symbols or numerical values, avoiding the omission of key corresponding relationships.
Focus on Key Points: Quickly identifies key areas or factors to prioritize control based on intersection data, improving problem-solving efficiency.

Create Charts Online
Advantages
Best Practices for Designing Matrix Diagrams

1. Comprehensively list all factors related to the problem through brainstorming, data statistics, or expert judgment.
2. Choose the appropriate matrix type based on the number of factor groups, such as using an L-shaped matrix for analyzing product characteristics and test items.
3. Use symbols (e.g., ●, ○, △) or numerical values (e.g., 1-5 points) at matrix intersections to indicate the degree of association between factors.
4. Identify high-association factors to determine key areas or issues that require priority control.
5. Formulate specific control plans or improvement measures for key factors.

Create Charts Online
Best
RACI Matrix

The RACI matrix is ​​a responsibility assignment matrix used to clearly define the responsibilities and involvement of each role in a project or process.
The four letters in the RACI matrix represent different roles and responsibilities:
R (Responsible): The specific person responsible for executing the task, who is required to complete specific action items.
A (Accountable): The person, usually a single person, who is accountable for the results of the task. They have the final decision-making authority and are responsible for completing the task. The project can only proceed after approval or sign-off.
C (Consulted): People who need to be consulted during the task execution; their opinions and suggestions have a significant impact on the task's completion.
I (Informed): People who need to be informed of the progress and results of the task. They are generally not directly involved in the task execution, but need to be aware of the relevant information.

Create Charts Online
RACI

Matrix Diagram How to Draw?

Matrix DiagramHow to Draw?
1
Create a new blank flowchart, and in the graphics area, check the 'Table' type symbol under 'More Shapes'.
2
Drag the table element from the left side of the graphics area to the canvas, and set the number of rows and columns in the table.
3
Double-click the cell to fill in the analysis factors for the rows/columns (such as product, department, time, etc.).
4
Fill in data or symbols to indicate the corresponding relationship between row and column factors (such as values, levels, existence, etc.).
5
Select a cell, and the top toolbar allows you to set fill colors to highlight key points and increase readability.
6
Once the matrix diagram is completed, it can be downloaded or shared with others.
Free to use

Matrix Diagram Drawing Guide

  • Learn five classic charts to make complex information clear in seconds

    Learn five classic charts to make complex information clear in seconds

    In an era of information explosion, efficiently communicating complex concepts has become a critical skill. Scatter plots , funnel plots, quadrant plots, matrix plots, and iceberg plots—five classic visualization tools—help people overcome cognitive limitations by presenting information in a structured manner. They transform abstract logic into intuitive graphics, revealing the inherent laws of a system while streamlining decision-making processes. They are widely used in fields such as business analysis, educational communication, and project management. The following systematically analyzes the core characteristics and application scenarios of each chart.
    ProcessOn-Skye
    2025-09-17
    147
  • How to make a pyramid chart? Tutorials and templates

    How to make a pyramid chart? Tutorials and templates

    In data visualization and information communication, the pyramid chart is a very effective tool. It displays information through a hierarchical structure, helping people quickly understand complex concepts or data distribution. This article will comprehensively introduce this powerful visualization tool through the concept, examples , drawing methods , templates, etc. of the pyramid chart .
    Skye
    2025-02-13
    1175
  • Comprehensive Guide to Radar Charts - Concepts, Examples, Templates

    Comprehensive Guide to Radar Charts - Concepts, Examples, Templates

    Radar chart, also known as spider chart or polar chart, is a type of chart used to display multivariate data , helping us understand and analyze complex data . It is widely used in business decision-making, financial investment, human resources and other fields. This article will give a comprehensive introduction to radar chart, including its definition, application scenarios, drawing tools, drawing methods , etc.
    Skye
    2025-02-17
    1223

Matrix Diagram Template Recommendations

More Templates

Matrix Diagram Frequently asked questions

What is the difference between a matrix diagram and a quadrant diagram?

A matrix diagram is for multi-dimensional cross-analysis (e.g., product × defect cause) to show complex relationships. A quadrant diagram is a two-dimensional classification tool (e.g., 'importance-urgency' four quadrants) used for prioritization.

Does the Boston Matrix belong to a matrix diagram or a quadrant diagram?

Essentially, it is a quadrant diagram (dividing four types of business using market growth rate and market share), but it incorporates the multi-variable analysis logic of a matrix diagram.

What does 'dimension' mean in a matrix diagram?

Dimensions are the variables that make up the matrix (e.g., factors represented by rows and columns), and the more dimensions there are, the more complex the analysis (but usually no more than 4).

How to avoid information overload in a matrix diagram?

Limit the number of factors (no more than 5 per dimension), and use color/symbol grading annotations.

Are there templates or examples of matrix diagrams available for reference?

You can visit the ProcessOn template community, where there are numerous matrix diagram templates and examples available for free cloning and use.

How to export a matrix diagram to image or PDF format?

Click the 'Download' button in the upper right corner to export the matrix diagram in formats such as PNG, JPG, and PDF.

Related Diagrams