Register
Process Type
Graphical expression
Mind Type
Structured expression
Note Type
Efficient expression

Online Onion Diagram Creation Tool

Free to use
Online Onion Diagram Creation Tool
What is Onion Diagram

The onion diagram, displaying multi-layered, nested relationships in a concentric circle structure, resembles an onion in shape and structure. It is a visualization tool used to display the relationships between different dimensions of a theme.
ProcessOn supports online creation of onion diagrams and offers a large number of templates and examples for copying, allowing you to easily draw professional and aesthetically pleasing onion diagrams.

Free to use

ProcessOn Onion Diagram Key Features

Online Collaboration

Supports real-time multi-user co-creation with shareable links for instant information transfer

Online Collaboration
One-Click AI Generation

Automatically generates graphics from text input and applies style enhancements

One-Click AI Generation
Personalized Style Customization

Prebuilt themes with full customization for personalized designs

Personalized Style Customization
Multiple Component Types

Supports icons, images, labels, LaTeX formulas, code blocks, links, attachments and more

Multiple Component Types
Multi-Format Compatibility

Export: PNG, VISIO, PDF, SVG | Import: VISIO, Mermaid

Multi-Format Compatibility
Cross-Device Sync

Real-time cloud storage, multi-device sync, version history, and secure data protection

Cross-Device Sync
Application of Onion Diagram

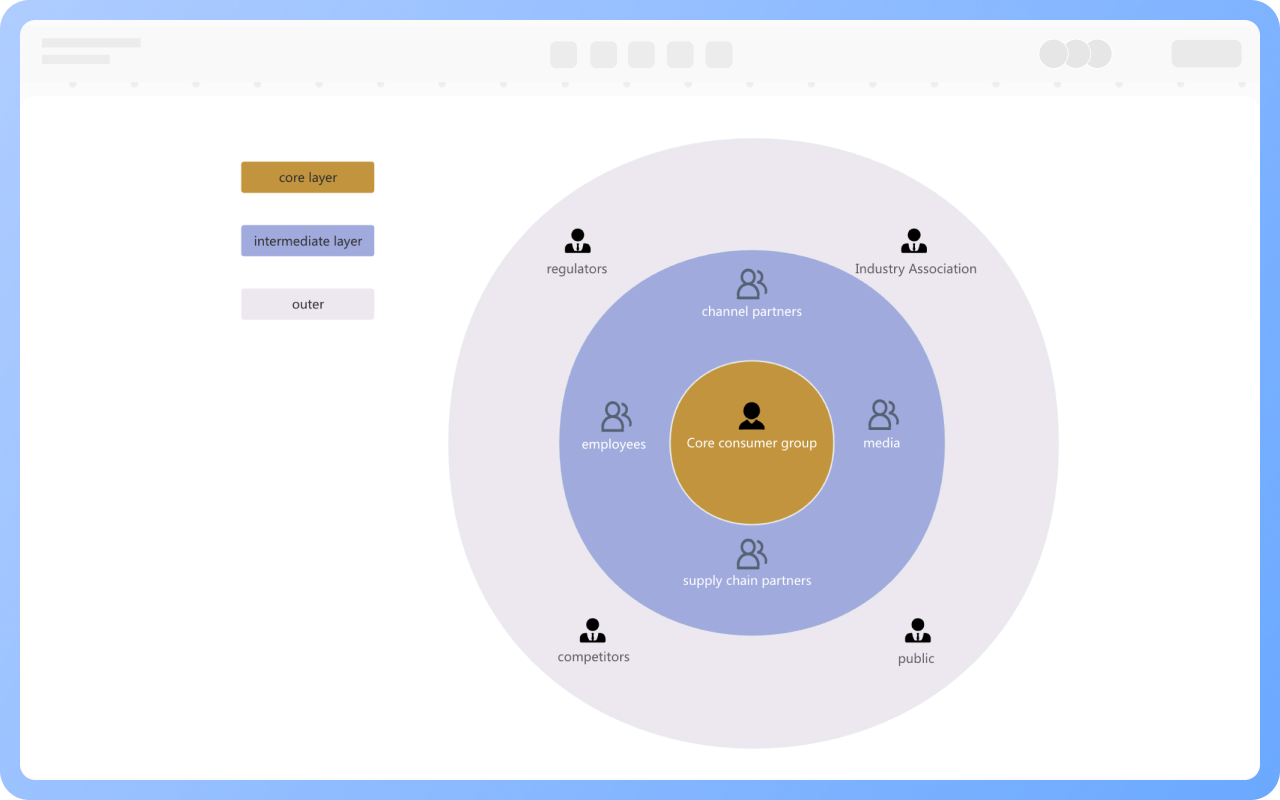
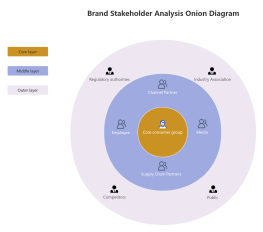
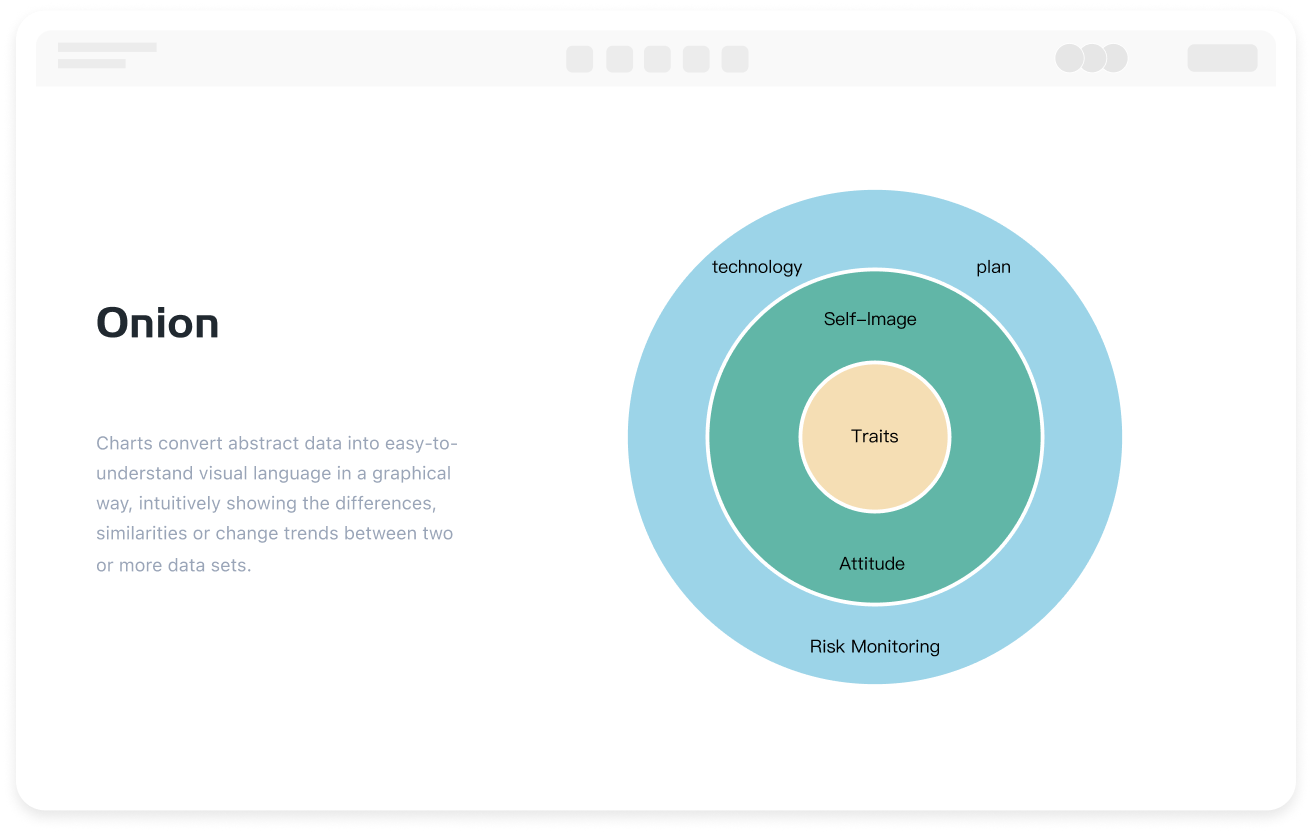
In the business field, onion diagrams are often used to analyze the relationships between brand stakeholders, helping teams identify key stakeholders, optimize product design, and market strategies.
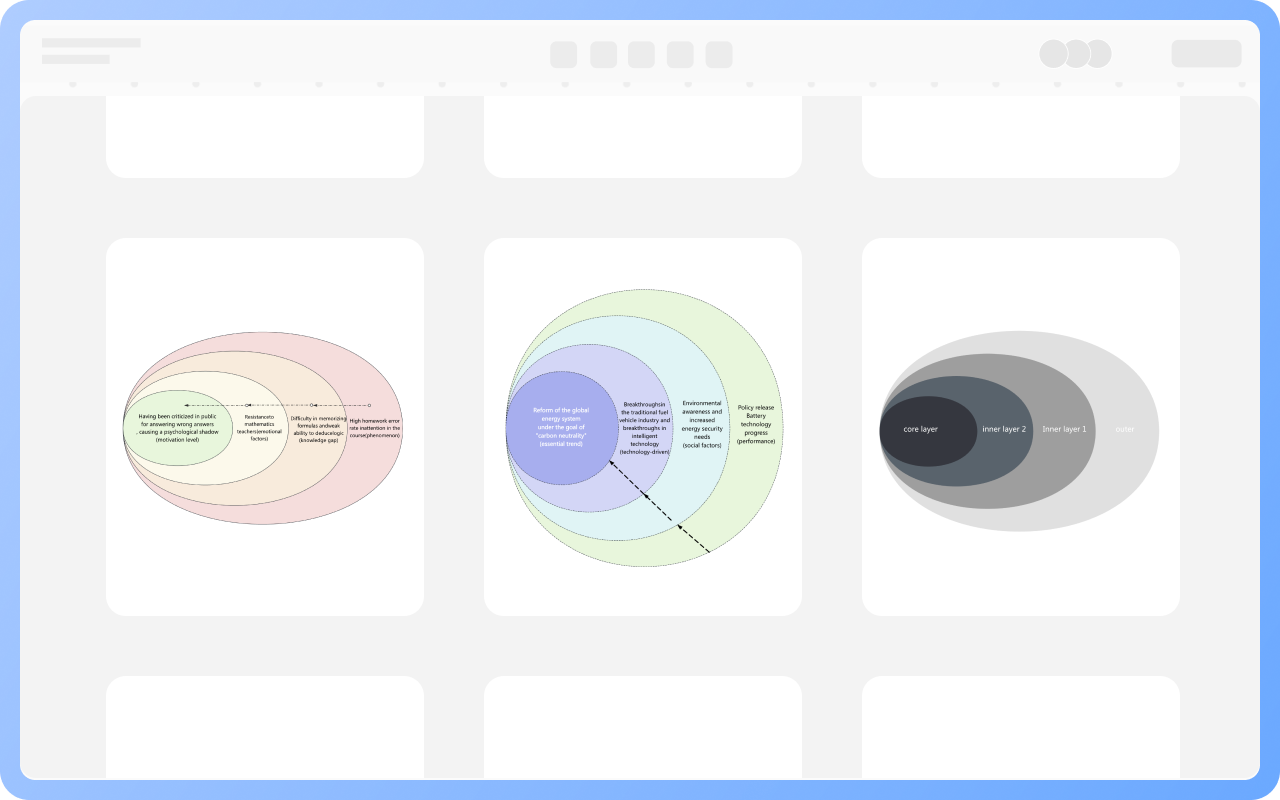
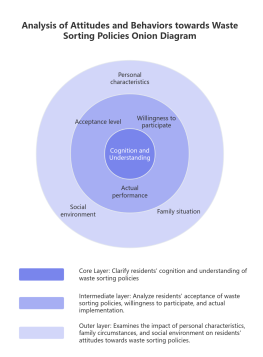
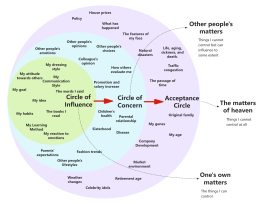
In social science research, onion diagrams can be used to show the relationships between different theories, methods, or strategies, helping researchers gain a deeper understanding of social phenomena.
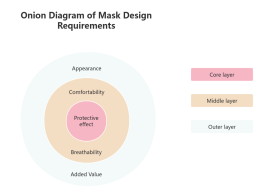
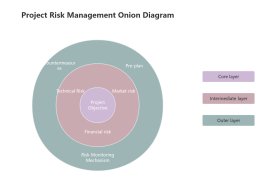
In project management, onion diagrams can assist project managers in planning projects, showing the relationships between different stages, tasks, or resources of a project.

Create Charts Online
Application
Components of Onion Diagram

Concentric ring structure: Composed of 2 or more concentric circles, each ring represents different levels of elements, and the number of rings can be adjusted according to the complexity of the analysis.
Level information annotation: Innermost layer: Core themes or key driving factors; Middle layer: Supportive elements or related dimensions; Outermost layer: External environment or constraints.

Create Charts Online
Components
Best Practices for Creating Onion Diagrams

Clearly define the central theme and association rules for each level before creating;
It is recommended to control the levels to 3-4, with no more than 5 elements per level to avoid information overload;
Use contrasting colors to distinguish levels, with higher levels having larger font sizes and deeper colors, and symbols can be used to mark key elements.

Create Charts Online
Best
Onion Model Diagram

The onion model diagram was proposed by American scholar Richard Boyatzis and evolved from the iceberg model diagram to demonstrate the core elements of competence composition. This model summarizes competencies from the inside out as a layered structure, with the core being motivation, followed by personality, self-image and values, social roles, attitudes, knowledge, and skills. The further outward, the easier the elements are to develop and evaluate; the further inward, the harder the elements are to evaluate and acquire, as motivation and personality are mainly shaped by innate and early experiences, with strong stability. The onion model emphasizes the differential impact of elements at different levels on behavior prediction and is widely used in the field of human resource management, such as job competency analysis and personnel assessment, providing theoretical support for talent selection and evaluation.

Create Charts Online
Onion

Onion Diagram How to Draw?

Onion DiagramHow to Draw?
1
Create a new flowchart, check the categories of graphic symbols needed in the graphic area under 'More Shapes'.
2
Drag the circular element from the left side of the graphic area to the canvas, then drag the text box element onto the circle to name the central theme.
3
Continue dragging circular elements to the canvas, enlarge the size of the middle and outermost circles to make them gradually larger by hierarchy, and add related dimensions and external environment elements.
4
Enhance the logical relationship between layers through colors, lines, or icons.
5
After the onion diagram is drawn, it can be downloaded or shared with others.
Free to use

Onion Diagram Drawing Guide

  • How to create an onion diagram? Tutorials, templates

    How to create an onion diagram? Tutorials, templates

    Onion diagrams, in a layered way, show different stakeholders, influencing factors or research levels one by one, so as to help people understand the internal relationship of complex problems or systems more clearly. They are widely used in business analysis, social science research, project management and other fields. This article will introduce onion diagrams from the aspects of their functions, examples, and production tutorials, and share multiple onion diagram templates.
    Skye
    2025-01-22
    1593
  • How to make a pyramid chart? Tutorials and templates

    How to make a pyramid chart? Tutorials and templates

    In data visualization and information communication, the pyramid chart is a very effective tool. It displays information through a hierarchical structure, helping people quickly understand complex concepts or data distribution. This article will comprehensively introduce this powerful visualization tool through the concept, examples , drawing methods , templates, etc. of the pyramid chart .
    Skye
    2025-02-13
    1106
  • Comprehensive Guide to Radar Charts - Concepts, Examples, Templates

    Comprehensive Guide to Radar Charts - Concepts, Examples, Templates

    Radar chart, also known as spider chart or polar chart, is a type of chart used to display multivariate data , helping us understand and analyze complex data . It is widely used in business decision-making, financial investment, human resources and other fields. This article will give a comprehensive introduction to radar chart, including its definition, application scenarios, drawing tools, drawing methods , etc.
    Skye
    2025-02-17
    1116
  • How to create a spider diagram? Tutorials and templates

    How to create a spider diagram? Tutorials and templates

    Spider diagrams are similar in appearance to mind maps, but have a more sophisticated and flexible structure. They are centered around a central idea, with other related concepts and details branching out from this central point to form a radial network structure. This type of diagram not only helps to organize and display complex information, but also inspires innovative thinking and deepens understanding. The following is a comprehensive introduction to spider diagrams, including its concepts, drawing tools , drawing methods , and sharing of rich examples and templates .
    Skye
    2025-02-10
    1084

Onion Diagram Template Recommendations

More Templates

Onion Diagram Frequently asked questions

If the outer layer of the onion diagram covers the inner layer, how can the layering order be modified?

Select the outer circle of the onion diagram, right-click the canvas "Send to Back", to place the inner layer above the outer layer.

How to scale the size of the hierarchical elements of the onion diagram proportionally?

Select the hierarchical elements of the onion diagram, hold the shortcut keys "ctrl+Alt" and drag the corners of the elements to scale proportionally.

How to set different colors for different layers?

Select the shape, use the "Color Fill" in the top toolbar to set the color of the shape, and "Line Color" to set the color of the shape's border.

How to center distribute the layers of the onion diagram?

You can hold the shortcut key "Ctrl" to select all layers, then click "Distribute Align" - "Center Distribute" in the top toolbar.

Are there any templates or examples of onion diagrams available for reference?

You can visit the ProcessOn template community, where there are a large number of onion diagram templates and examples available for free cloning and use.

Related Diagrams