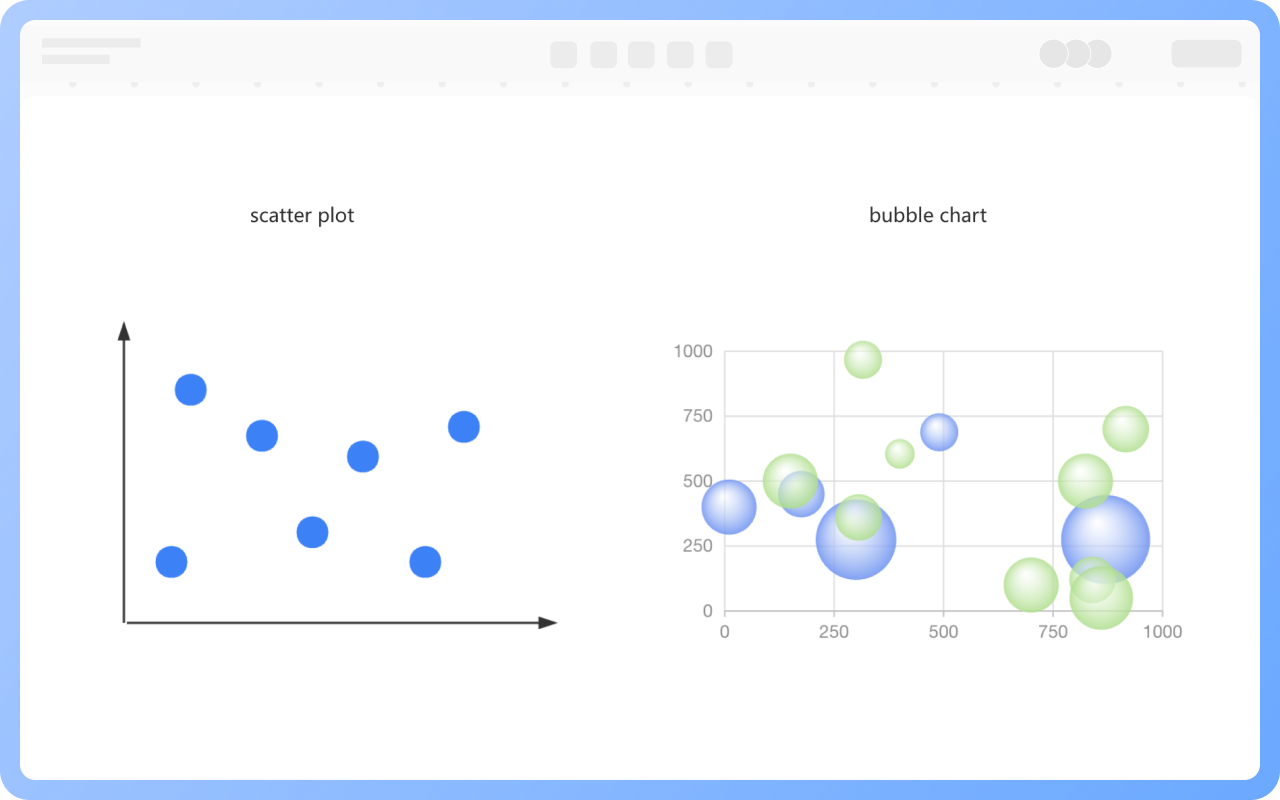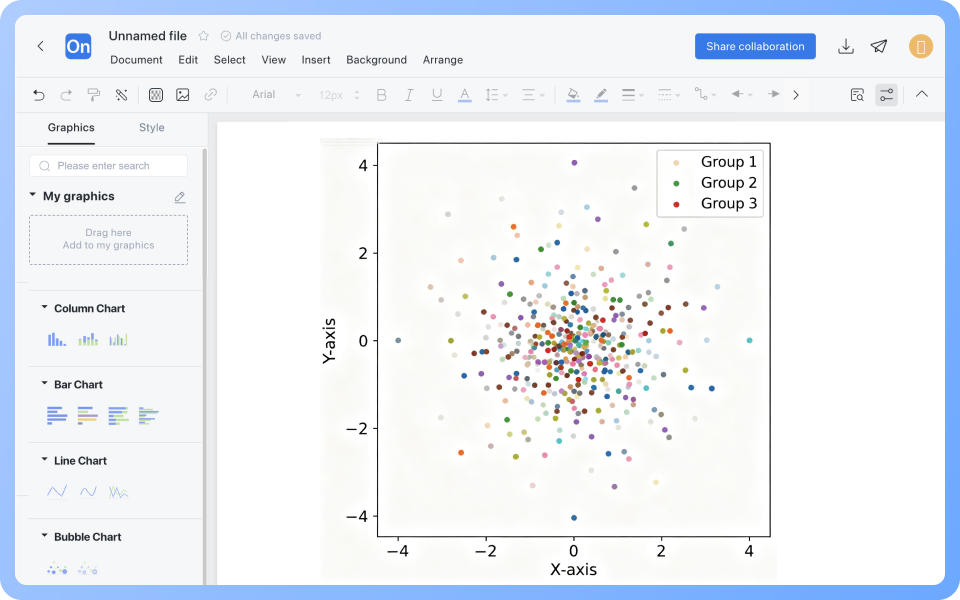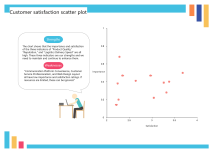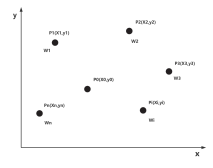


1. Explore variable correlations
Determine whether two variables change in sync, providing a basis for subsequent modeling (such as regression analysis).
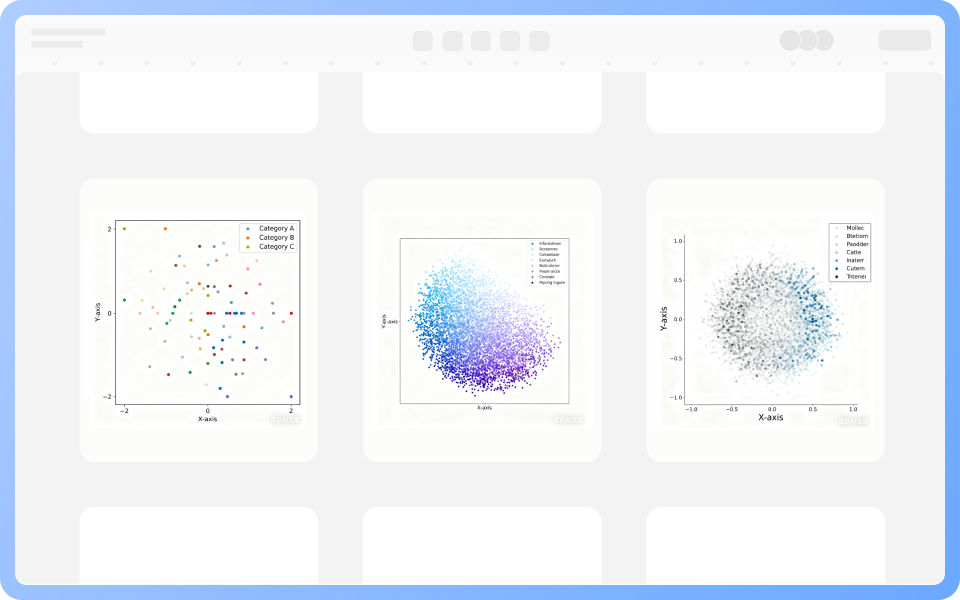
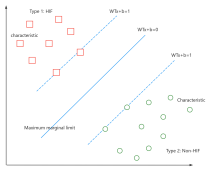
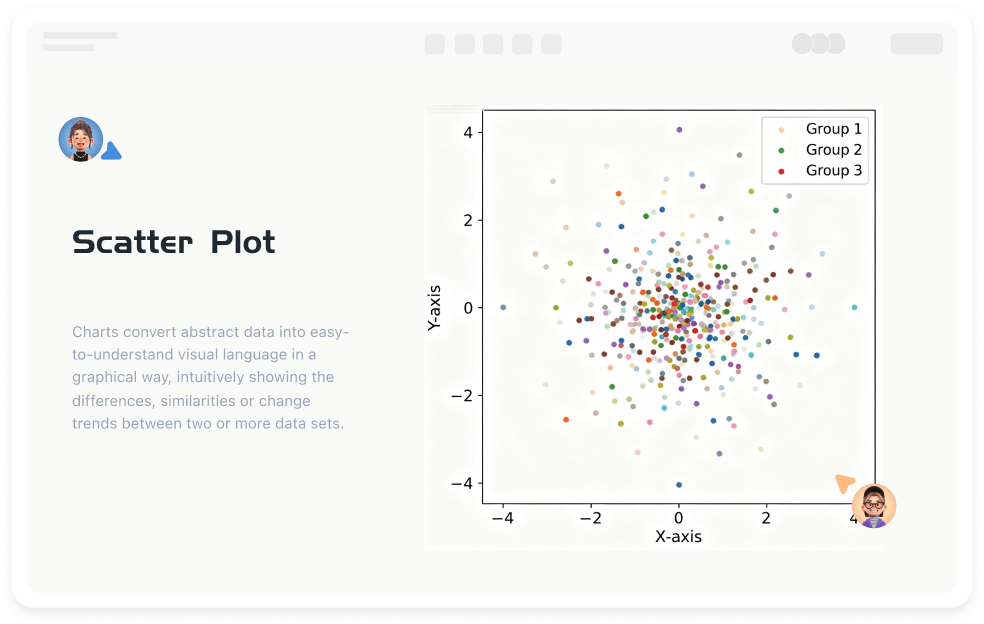
2. Detect data distribution patterns
Identify linear, exponential, logarithmic, and other relationship types. For example, population growth and time may show an exponential distribution, while car speed and fuel consumption may show a U-shaped relationship.
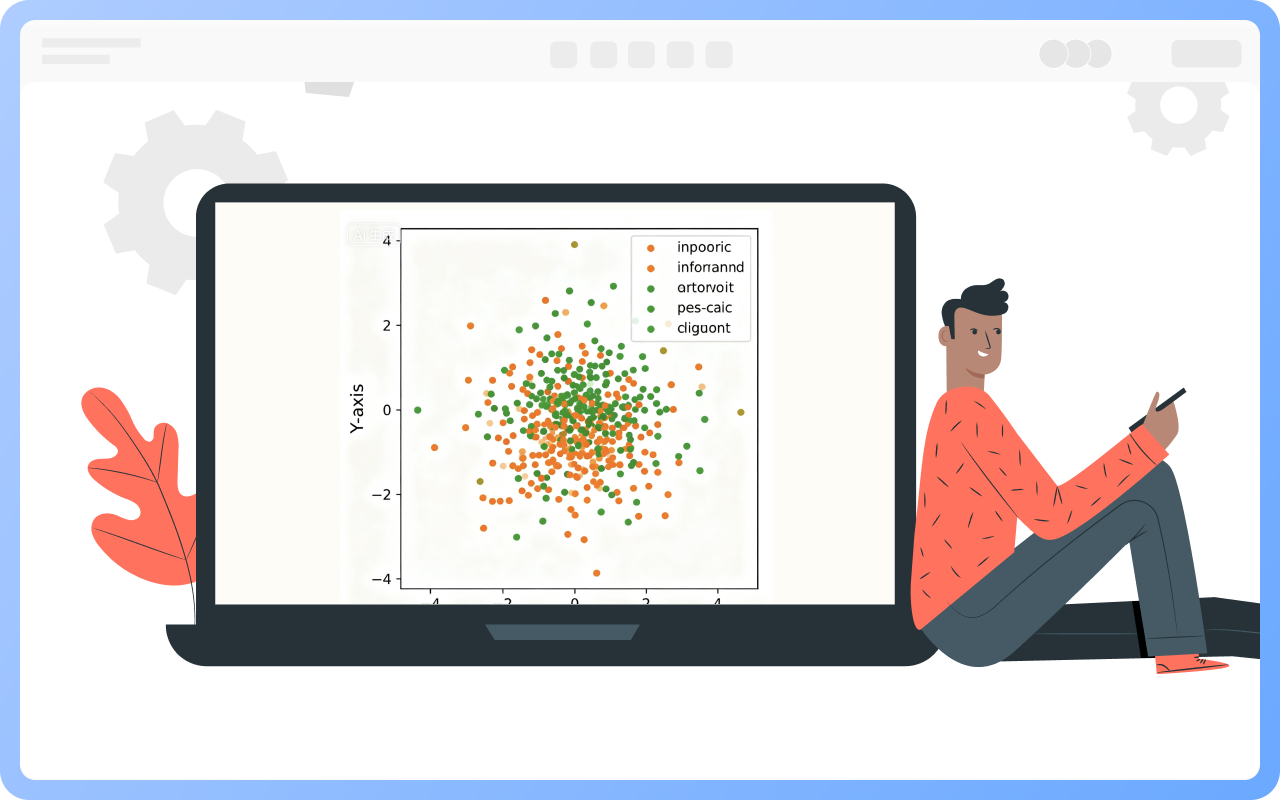
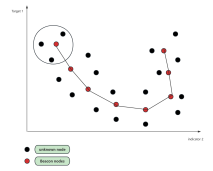
3. Identify outliers and abnormal values
Outliers may affect model accuracy and require further investigation (such as data entry errors or special events).
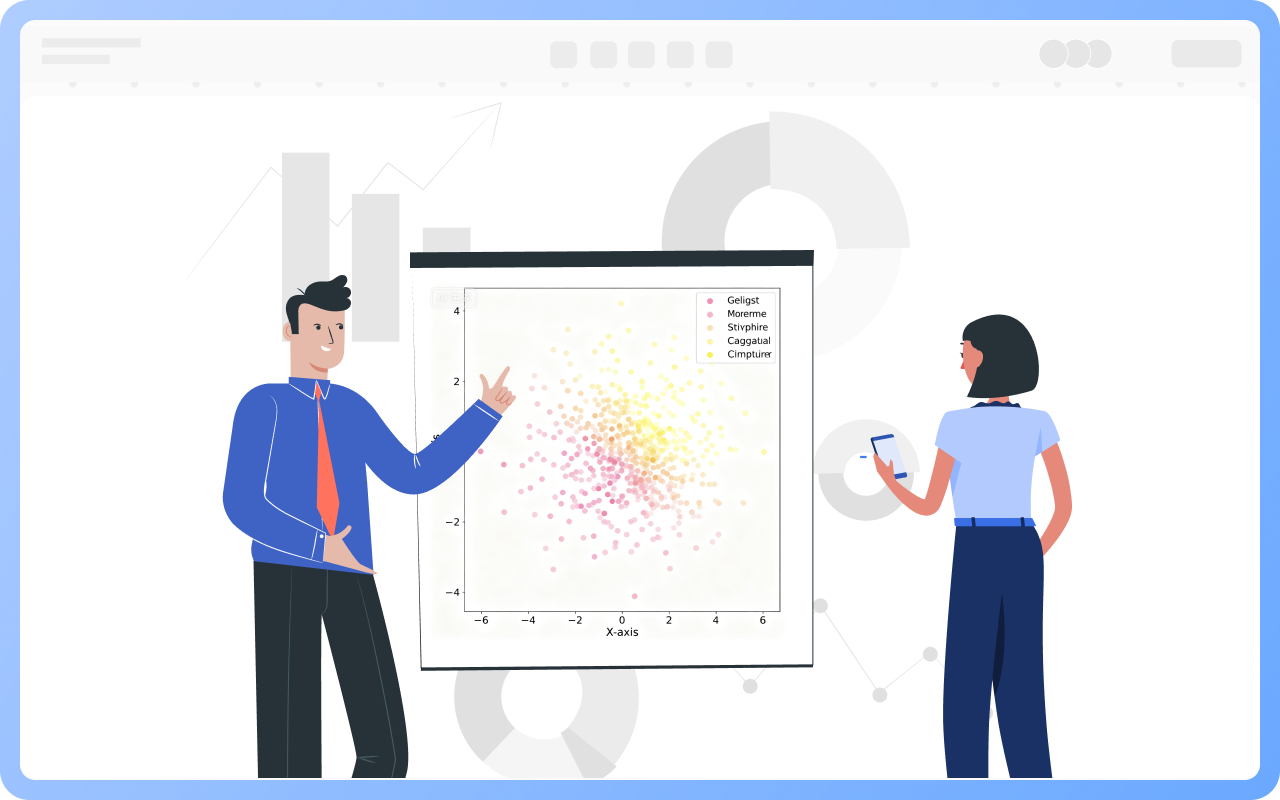
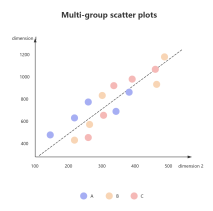
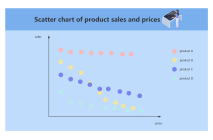
4. Compare differences between multiple groups of data
Use group labels (such as different colors) to compare the differences in variable relationships between different groups (such as different age groups).
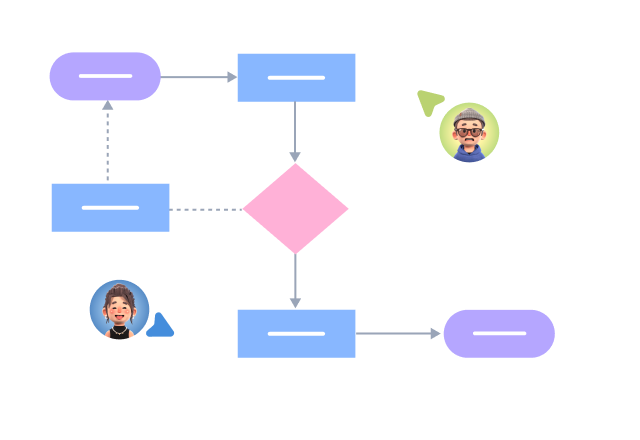
Process Type
Graphical expression
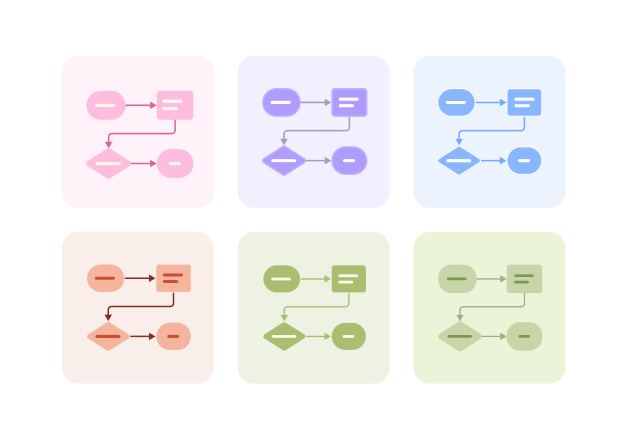
Mind Type
Structured expression
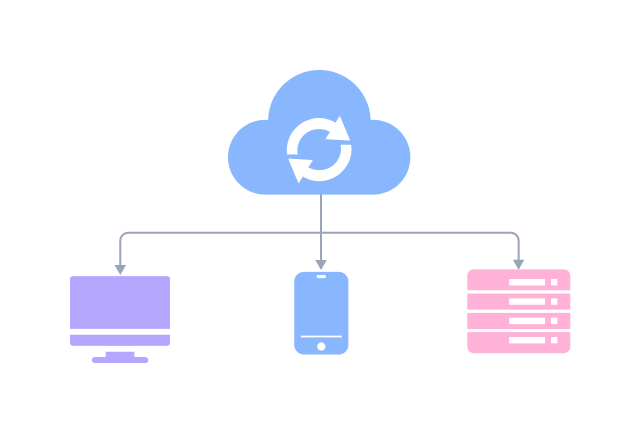
Note Type
Efficient expression
Treemap
Bracket Diagram
Default Mode