
Scatter plot template
0 Report
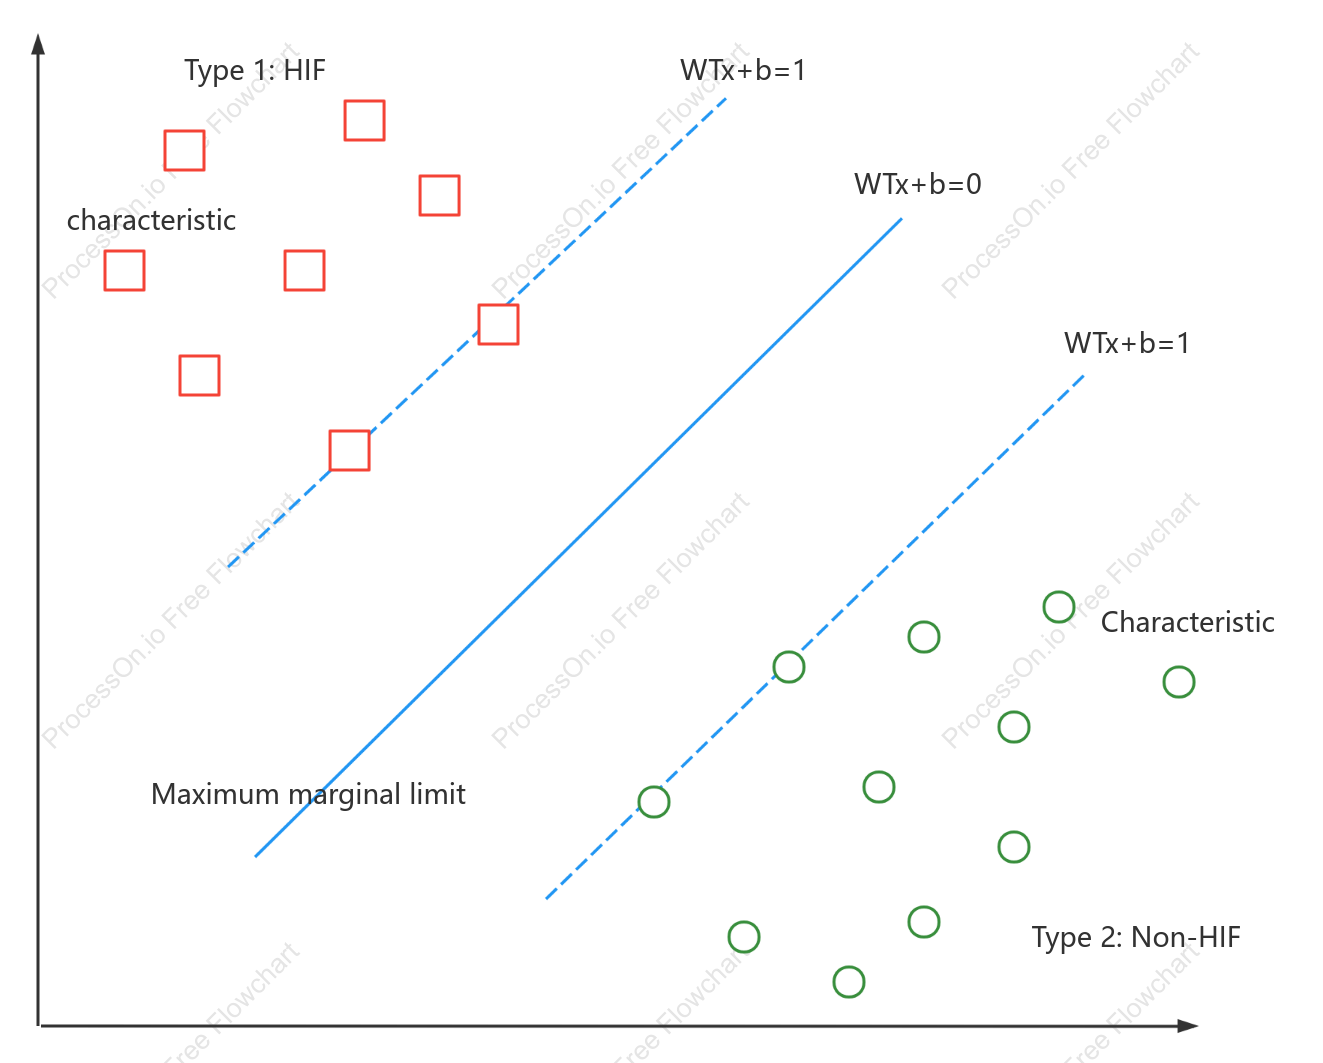
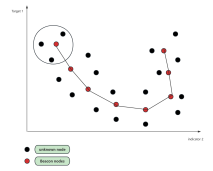
This scatter plot template provides a visual representation of two types of data classifications: Type 1 (HIF) and Type 2 (Non-HIF). It illustrates the decision boundaries defined by the equations WTx+b=1 and WTx+b=0, which help in distinguishing between the two types. The plot emphasizes the maximum marginal limit to optimize classification accuracy. This template serves as a useful tool for visualizing and analyzing data characteristics, aiding in the understanding of how different data points are categorized based on their features.
Related Recommendations
Other works by the author
Outline/Content
See more
Type 2: Non-HIF
WTx+b=1
WTx+b=0
Characteristic
characteristic
Type 1: HIF
Maximum marginal limit
Collect
Collect
Collect
Collect

0 Comments
Next Page