
Multiple scatter plot templates
2 Report
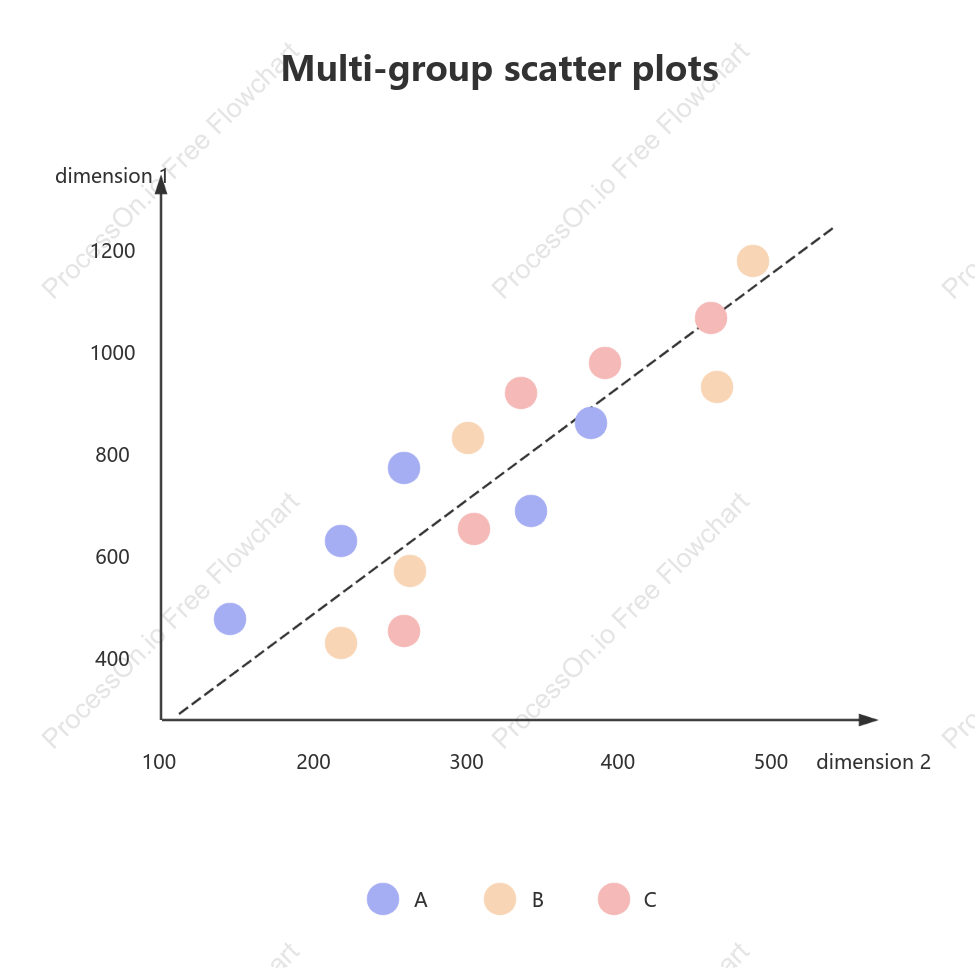
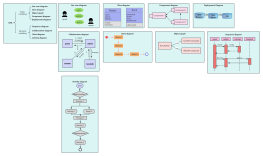
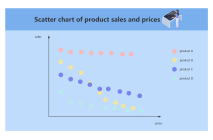
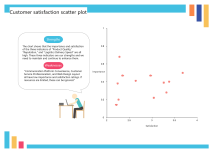
This flowchart titled 'Multiple Scatter Plot Templates' illustrates the structure and components necessary for creating multi-group scatter plots. It features data points and dimensions, such as dimension 1 and dimension 2, with values ranging from 100 to 1200. The flowchart categorizes data into groups labeled A, B, and C, and provides a visual guide for plotting these data points effectively. This tool is essential for visualizing relationships between variables across different groups, aiding in data analysis and interpretation.
Related Recommendations
Other works by the author
Outline/Content
See more
1000
800
A
C
dimension 2
1200
400
300
dimension 1
B
500
Multi-group scatter plots
600
100
200
Collect
Collect
Collect
Collect

0 Comments
Next Page