
Product sales and price scatter plot
0 Report
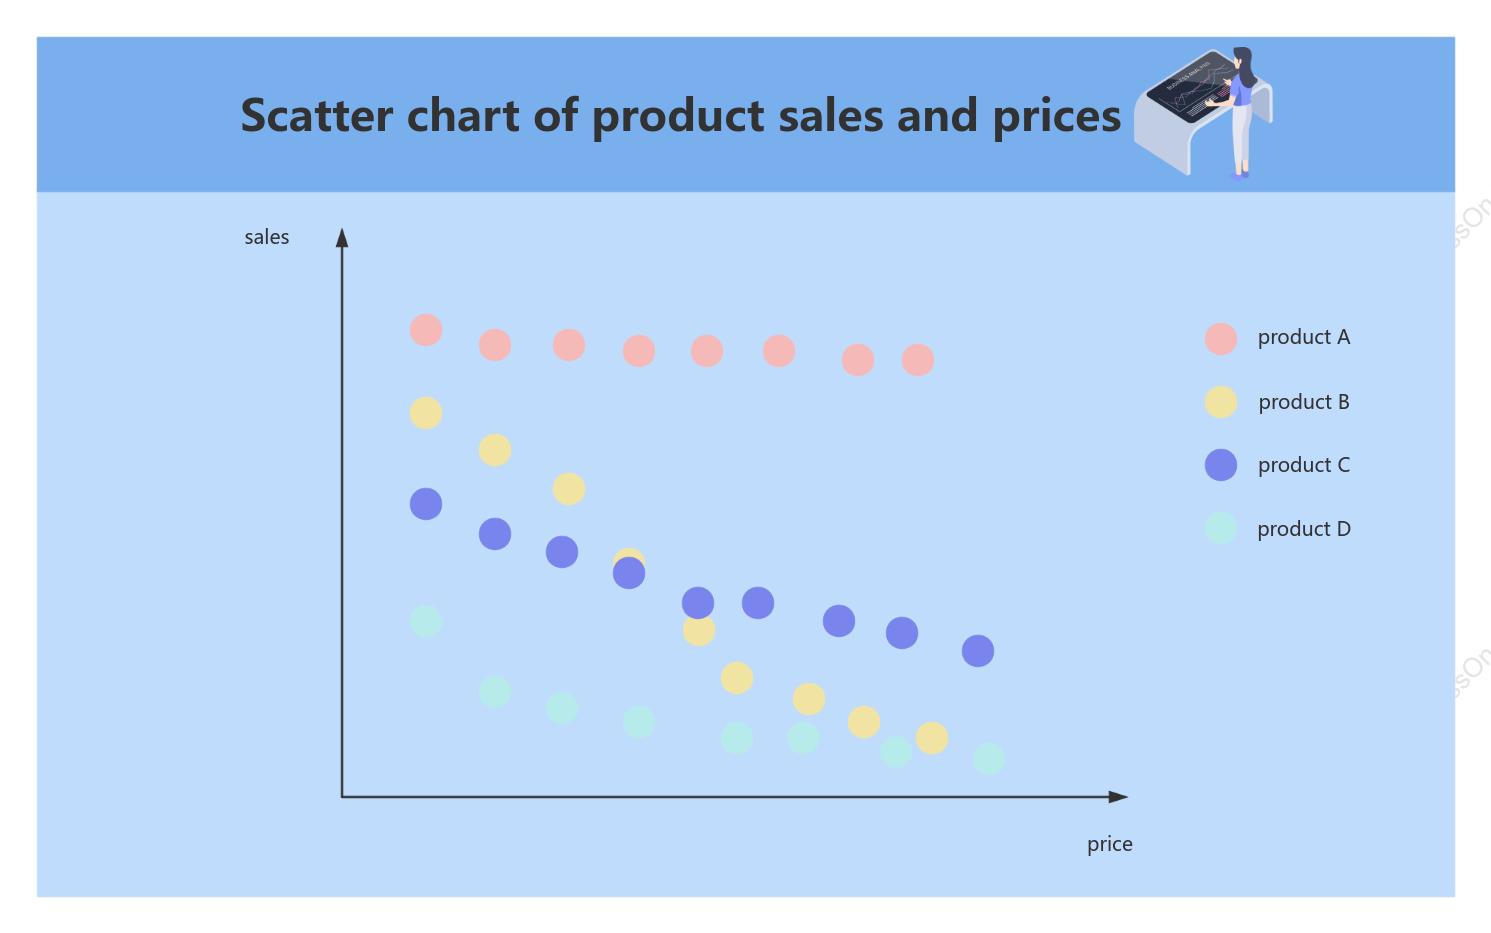
The scatter plot titled 'Product Sales and Price' provides a visual representation of the relationship between sales and prices for four distinct products: A, B, C, and D. By plotting these variables, the chart offers insights into how pricing strategies may influence sales volume across different products. This scatter chart serves as a valuable tool for analyzing market trends and making informed pricing decisions. It allows businesses to identify patterns and correlations, ultimately aiding in optimizing both sales performance and pricing strategies.
Related Recommendations
Other works by the author
Outline/Content
See more
product C
sales
price
product B
product D
Scatter chart of product sales and prices
product A

Collect
Collect

0 Comments
Next Page