Register
Process Type
Graphical expression
Mind Type
Structured expression
Note Type
Efficient expression

UML Activity Diagram Software

Free to use
UML Activity Diagram Software
What is Activity Diagram

Activity diagrams are similar to flowcharts and are a model view used to describe the behavior of a system. They can be used to describe the workflow and concurrent behavior of a system, showing the sequence of activities performed by objects participating in a certain behavior of the system, and are another form of state machine representation.

Activity diagrams are used to analyze processes, utilizing visualization tools to depict the operation of specific real-world tasks, producing content that is both easy for people to understand and convenient for computer development and implementation.

Free to use

ProcessOn Activity Diagram Key Features

Online Collaboration

Supports real-time multi-user co-creation with shareable links for instant information transfer

Online Collaboration
One-Click AI Generation

Automatically generates graphics from text input and applies style enhancements

One-Click AI Generation
Personalized Style Customization

Prebuilt themes with full customization for personalized designs

Personalized Style Customization
Multiple Component Types

Supports icons, images, labels, LaTeX formulas, code blocks, links, attachments and more

Multiple Component Types
Multi-Format Compatibility

Export: PNG, VISIO, PDF, SVG | Import: VISIO, Mermaid

Multi-Format Compatibility
Cross-Device Sync

Real-time cloud storage, multi-device sync, version history, and secure data protection

Cross-Device Sync
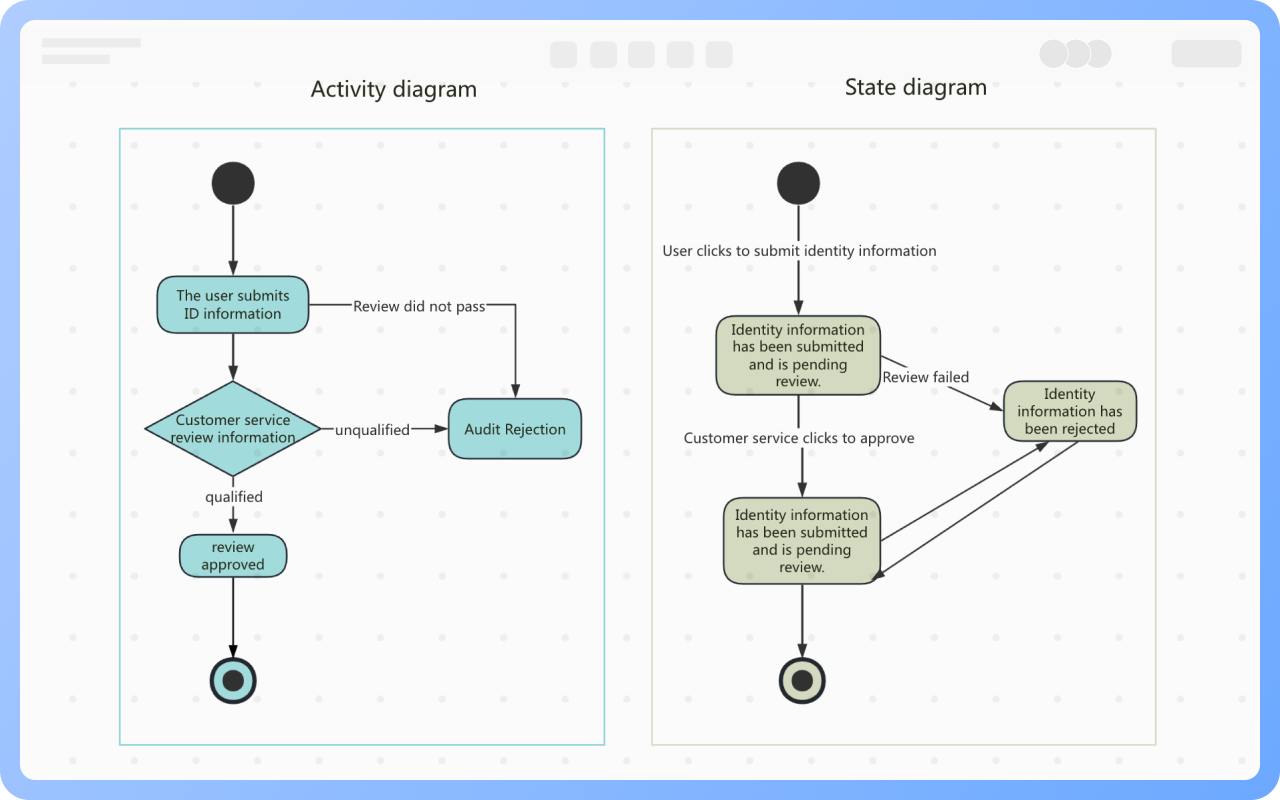
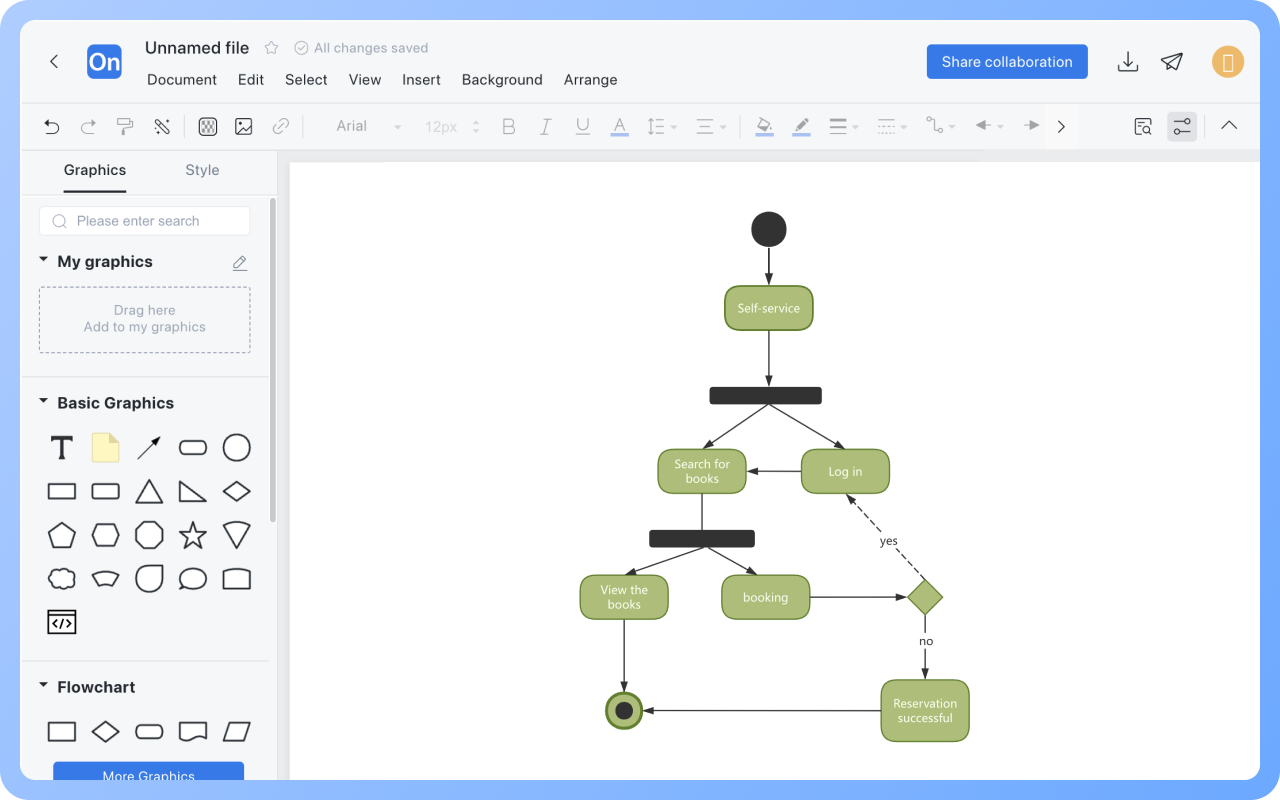
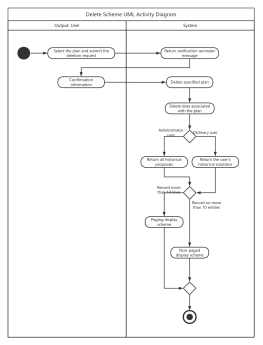
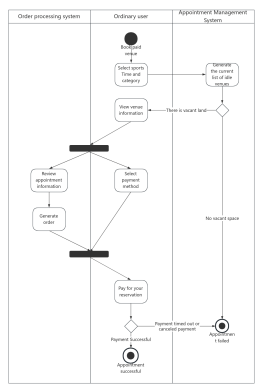
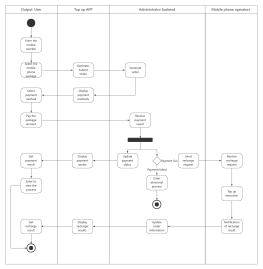
Difference between Activity Diagram and State Diagram

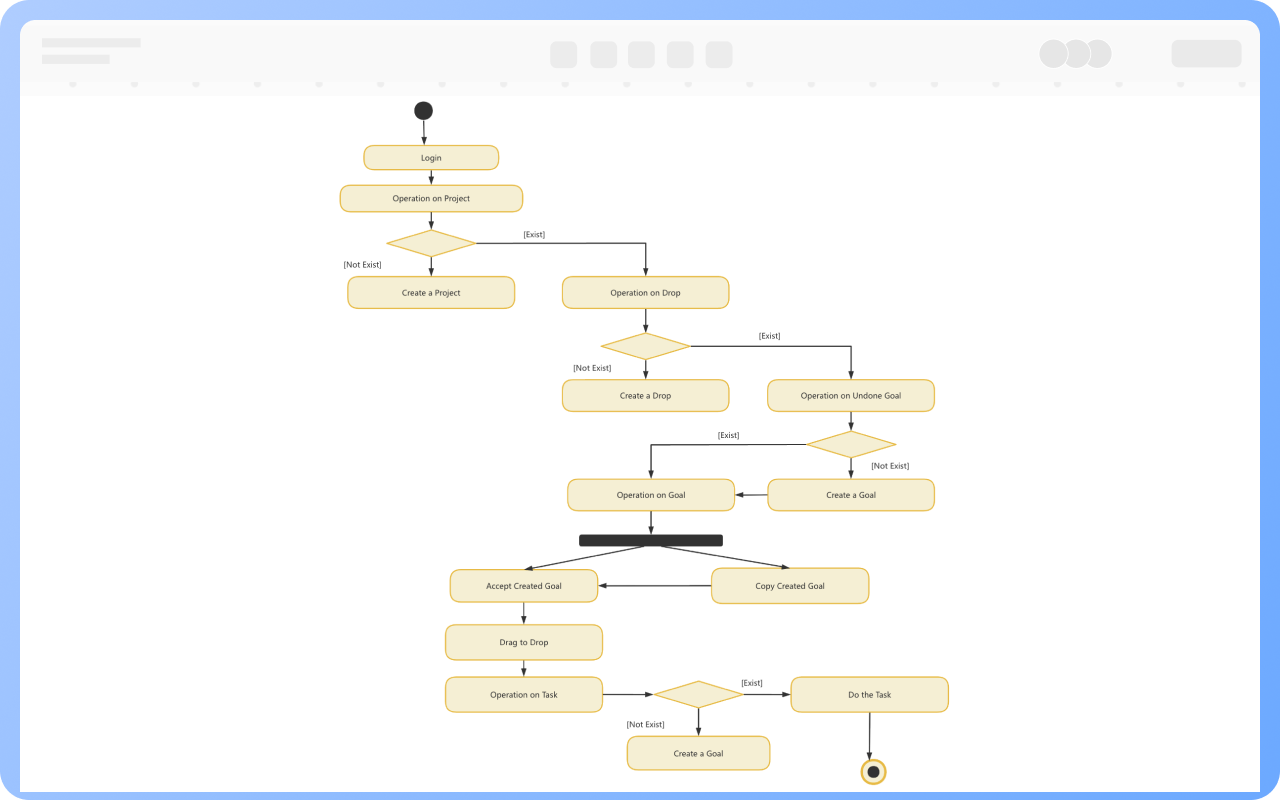
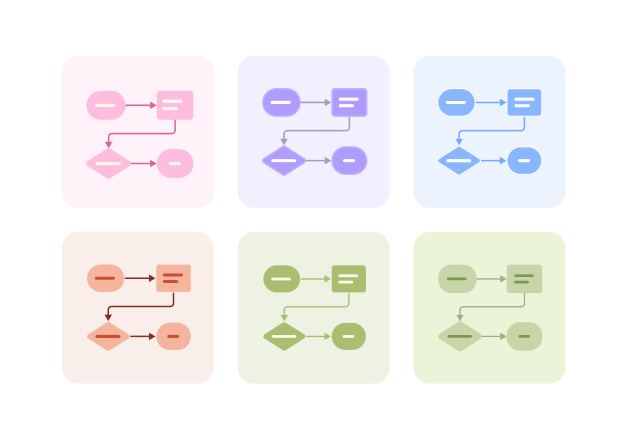
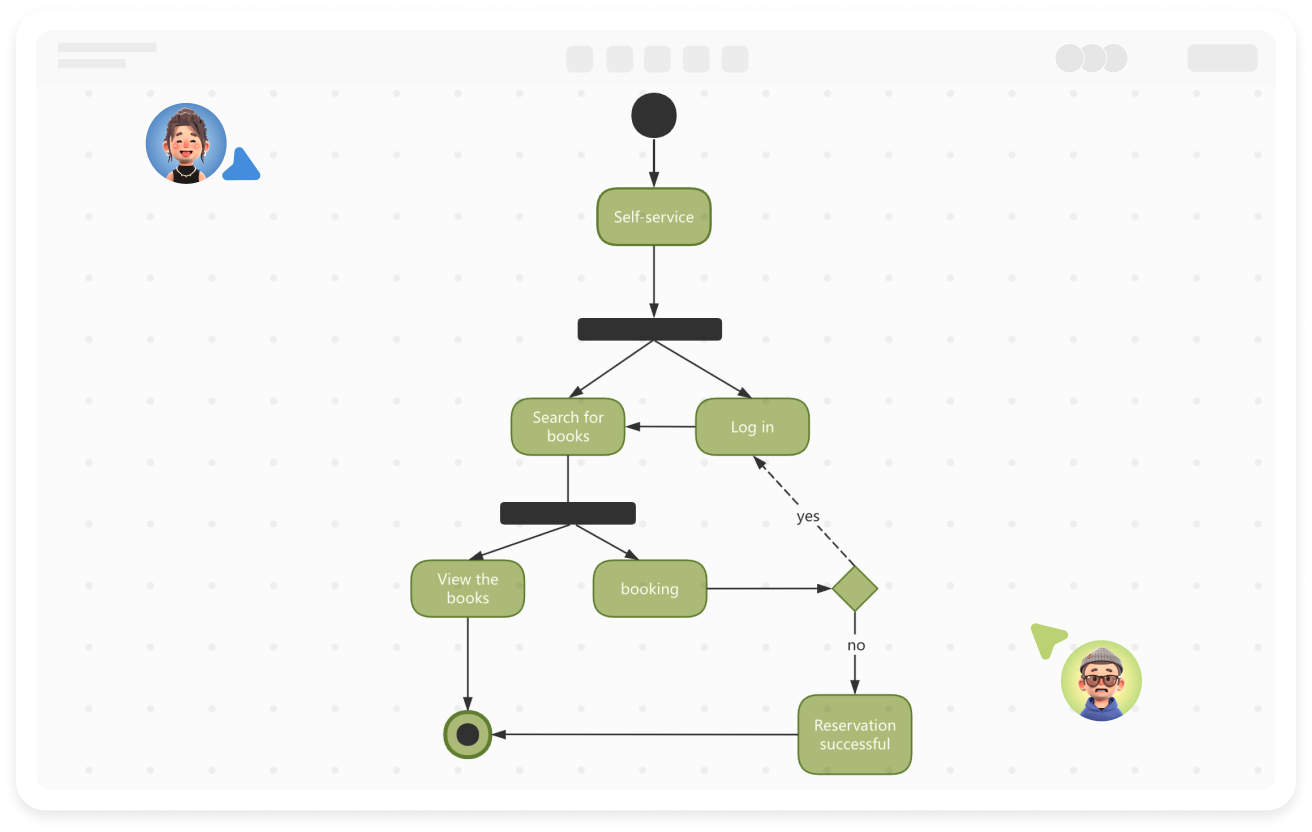
An activity diagram is centered around activities, with rounded rectangles representing activities. Transition lines usually do not contain content, except when making judgments, where the condition is written on the line.

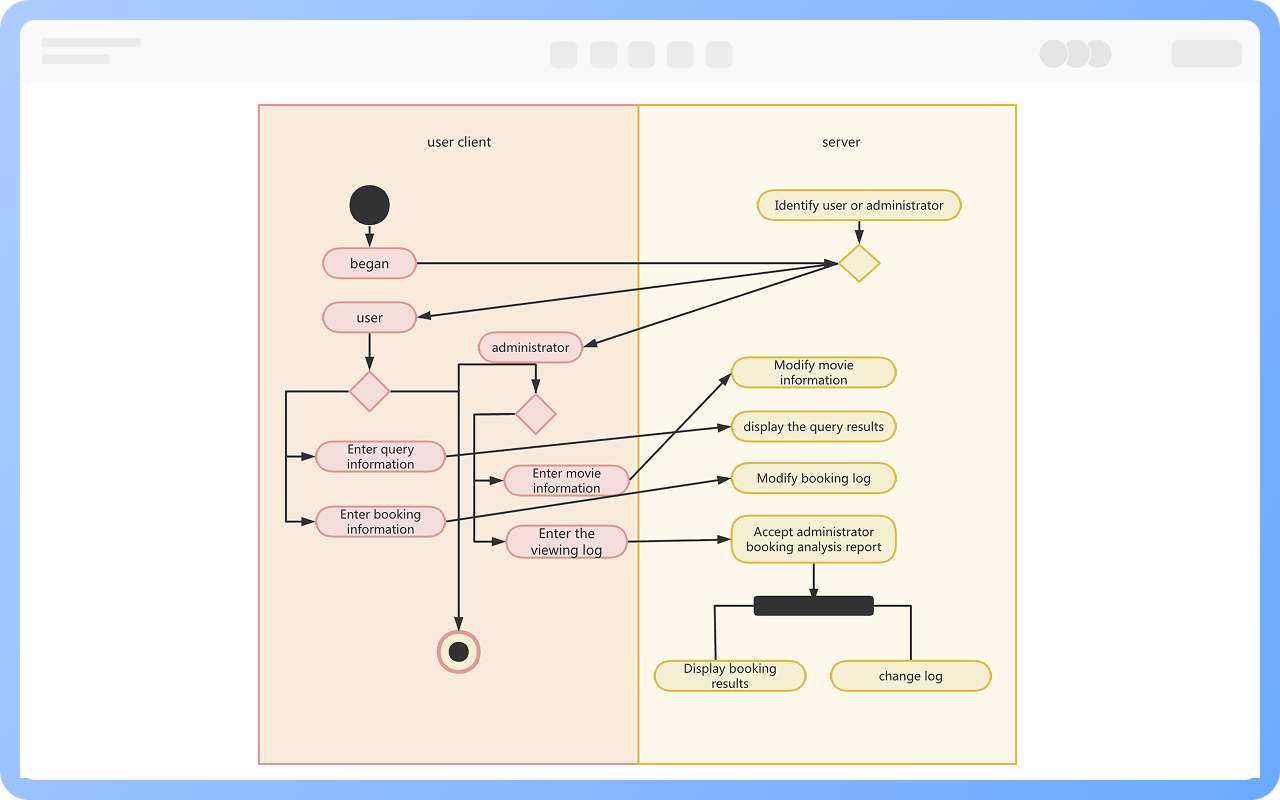
A state diagram is centered around states, with rounded rectangles representing states. The content written on the transition line corresponds to the activities in the activity diagram.
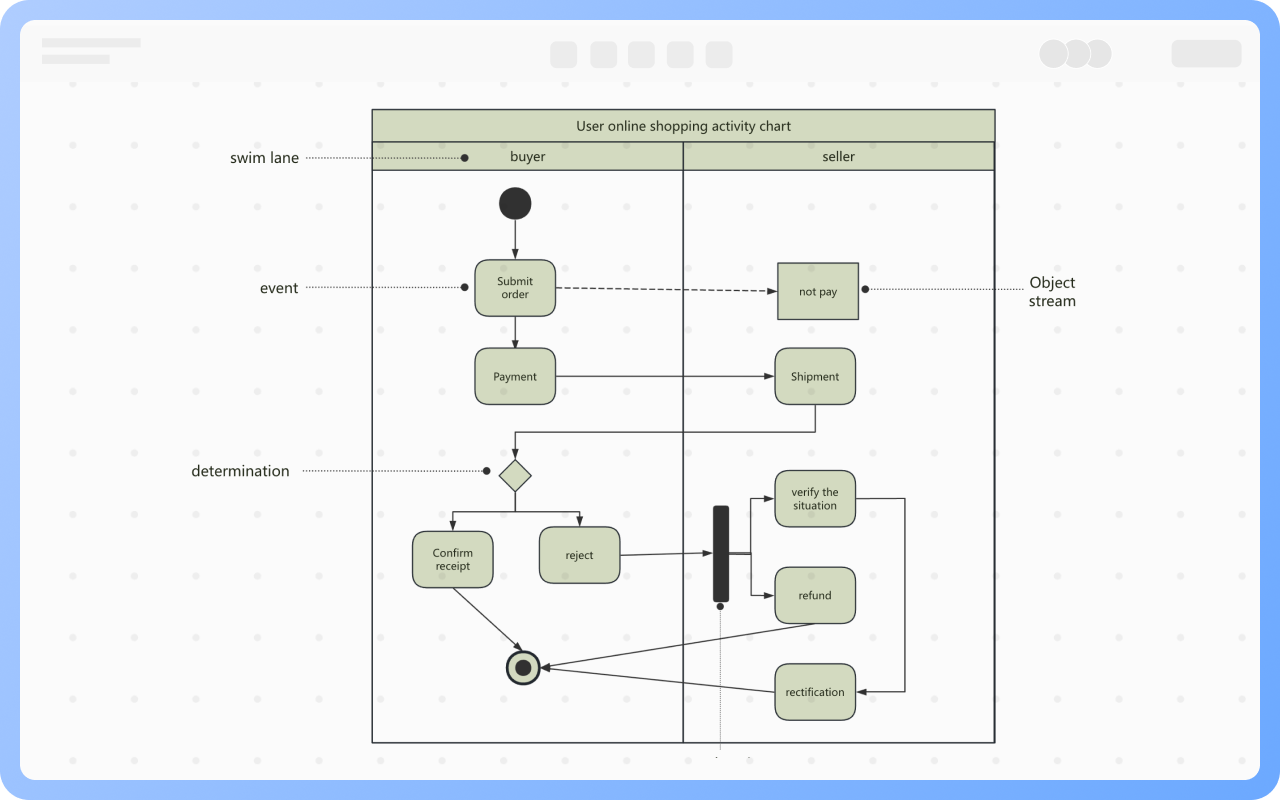
Create Charts Online
Difference
Components of Activity Diagram

Starting Point: An activity diagram begins with a starting point, represented by a solid circle.

Activity: Represents a step or task in the system or business process, indicated by a rounded rectangle with the activity name inside.

Decision: Represented by a diamond shape, also known as branching and merging. A decision has one incoming path and two or more outgoing paths.

Synchronization: Represented by a solid narrow rectangle, also known as fork and join, used to describe parallel processes. A fork indicates the start of parallel activities, while a join indicates the end of parallel activities.

Swimlane: Swimlanes group activities or actions by the executing entity, with each group separated by swimlanes. This clearly describes the transfer of activities or actions and clarifies who completes them.

Object Flow: Represented by a rectangular box for an object, with dashed arrows indicating the dependency between activities and objects.

Create Charts Online
Components
Activity Granularity

The granularity of all activity nodes should be roughly the same:

“Logging into the system” and “Clicking a button” appearing together is incorrect.

“Entering username and password” -> “Verifying identity” -> “Entering the main interface” is correct.

Create Charts Online
Activity
Fork and Join

At the same time, there are two or more concurrent control flows. A fork indicates a control flow splitting into two or more concurrent control flows, while a join indicates synchronization of two or more concurrent control flows.

In an activity diagram, synchronization bars are used to illustrate the forking and joining of these control flows, represented by solid narrow rectangles.

Create Charts Online
Fork
Application Scenarios of Activity Diagram

Business Process Modeling: Procurement approval, leave process

System Function Operation Flow Modeling: Login, order placement, report generation

Behavior Modeling of Classes (in conjunction with state diagrams): User registration process, order processing process

Concurrent or Collaborative Behavior Modeling: Multithreaded collaboration, task distribution

Create Charts Online
Application
Suggestions for Drawing Activity Diagrams

1. Keep the graphics simple and avoid excessive nesting

2. Clearly identify the executor of each action

3. Use decision and concurrency structures appropriately

4. Can be used in conjunction with other UML diagrams

Create Charts Online
Suggestions

Activity Diagram How to Draw?

Activity DiagramHow to Draw?
1
Before starting to draw, it is necessary to organize all elements in the activity diagram such as activities, decisions, synchronizations, etc.
2
Create a 'UML Diagram', or first create a 'Flowchart', then add 'UML State Diagram/Activity Diagram' symbols to the drawing area
3
Starting from the initial point, add all activities to the canvas in sequence according to the order of activities, connect activity states, and add decisions and synchronizations to describe special and parallel activities
4
Connect activity states and add decisions and synchronizations to describe special and parallel activities
5
According to the business situation, if there are many activity executors, you can add swimlanes; if you need to describe the situation of objects, you can add object flows
6
Check and confirm that the diagram is correct, and thus, a professional activity diagram is completed
Free to use

Activity Diagram Drawing Guide

  • What is a UML activity diagram? Definition and components

    What is a UML activity diagram? Definition and components

    Activity diagram is one of the diagrams in UML that describes the dynamic behavior of the system. It is mainly used to show the activities or actions of the classes involved in the behavior and describe the execution process of various activities in the system, including business processes, software operations or interactions between objects. The following will explain the UML activity diagram from three aspects: the concept and importance of activity diagram, the difference between activity diagram and flow chart, and the components of activity diagram.
    Skye
    2024-11-18
    1894
  • How to draw UML Activity Diagrams? Tutorials and examples in software development

    How to draw UML Activity Diagrams? Tutorials and examples in software development

    Activity diagram is an important behavior modeling tool in UML . It is mainly used to describe a series of activities or operations in a system or business process . It emphasizes the control flow between objects, can clearly show how a series of activities or operations are executed in a specific order, and supports the representation of concurrency and synchronization. This article will mainly explain the practical application and drawing tutorial of UML activity diagram in software development.
    Skye
    2025-03-20
    1266
  • UML diagram complete guide: Master 14 types of UML diagrams in 10 minutes

    UML diagram complete guide: Master 14 types of UML diagrams in 10 minutes

    This article uses the ProcessOn drawing tool to quickly and comprehensively explain what a UML diagram is? UML diagrams are divided into types and the conceptual uses of each diagram. Learn to use this tool efficiently to improve development efficiency and quality.
    Melody
    2025-03-03
    2377
  • A must-read for beginners: UML Introduction

    A must-read for beginners: UML Introduction

    UML (Unified Modeling Language) is a universal visual modeling language standard used to describe, visualize, construct and document software system artifacts. This article will explain UML from the perspective of its concept, meaning, and composition. Through this basic introduction, I believe that you will not only be able to deeply understand the historical context of UML, but also master its wide application in demand analysis, system design, and documentation.
    Skye
    2025-04-03
    738

Activity Diagram Template Recommendations

More Templates

Activity Diagram Frequently asked questions

Are the initial and end points unique?

In an activity diagram, there is only one initial point, but there may be multiple end points.

Can activities be named arbitrarily?

Activity diagrams require activity naming to follow verb-object phrases, avoiding issues like treating objects as activities or unclear operation objects.

Do synchronization forks and joins exist simultaneously?

No. Typically, forks and joins coexist, but there are situations where only forks exist without joins.

Why include swimlanes in an activity diagram?

Swimlanes group activities or actions by the executing object, using lanes to separate each group. This clearly describes the transfer of activities or actions and clarifies who completes these activities or actions.
Each swimlane is named after the object's name or the actor's name, and these names are unique within an activity diagram.

What rules should be followed when drawing an activity diagram?

1. From top to bottom, from left to right
2. Align activities as much as possible
3. Avoid crossing activity lines
4. Limit the number of activities to 10-15

What is the difference between an activity diagram and a flowchart?

1. Activity diagrams can represent concurrent activities, whereas flowcharts cannot.

2. Activity diagrams are object-oriented, whereas flowcharts are process-oriented.

3. Activity diagrams describe the rules followed by the sequence of object activities, focusing on system behavior rather than the processing process; flowcharts focus on describing the processing process, with their main structure being sequence, branching, and looping, with strict order and timing relationships between processes.

What is the difference between an activity diagram and a BPMN diagram?

1. Activity diagrams are technical, a type of dynamic view in UML modeling, usually used in the design phase of software systems, and are a diagram for participant communication. BPMN is business-oriented, used to describe program execution processes, can generate executable declaration files, and can be used for dynamic execution by process engines;
2. As a whole, BPMN diagrams are easier for business stakeholders to understand than activity diagrams;
3. BPMN contains special modeling elements that make it more suitable for business purposes. Activity diagram modeling elements are relatively simpler and more singular;
4. BPMN models B2B interactions better than activity diagrams.

Related Diagrams