Process Type
Graphical expression
Mind Type
Structured expression
Note Type
Efficient expression
Treemap
Bracket Diagram

Default Mode





In front-end development, code only accounts for one-third of the workload—the remaining two-thirds are about understanding requirements, designing architecture, aligning solutions, and troubleshooting. Diagrams are the core tool for transforming these "invisible thoughts" into "visible consensus."
Many front-end developers are used to "opening the IDE and writing code directly," relying on rote memorization and verbal communication when faced with complex requirements. However, when a project grows to dozens of pages, hundreds of components, and involves cross-team collaboration, the loss of information transmission increases exponentially without the support of diagrams—leading to communication difficulties during technical solution reviews , difficulty finding dependency chains during troubleshooting, and new employees not understanding what the system looks like even after three months on the job.
Charts are not "reports for the boss," but rather a thinking tool and communication language for front-end developers. This article takes a practical approach, outlining eight essential chart types to master throughout the entire front-end development process—from requirements analysis to architecture design, from code modeling to deployment and maintenance—and telling you when to draw them, what to draw, and how to draw them.
Use case diagrams are diagrams in UML (Unified Modeling Language) used to describe the functional boundaries of a system and the interaction between users and the system. They don't care how the functions are implemented, but only who can "do what" in the system.
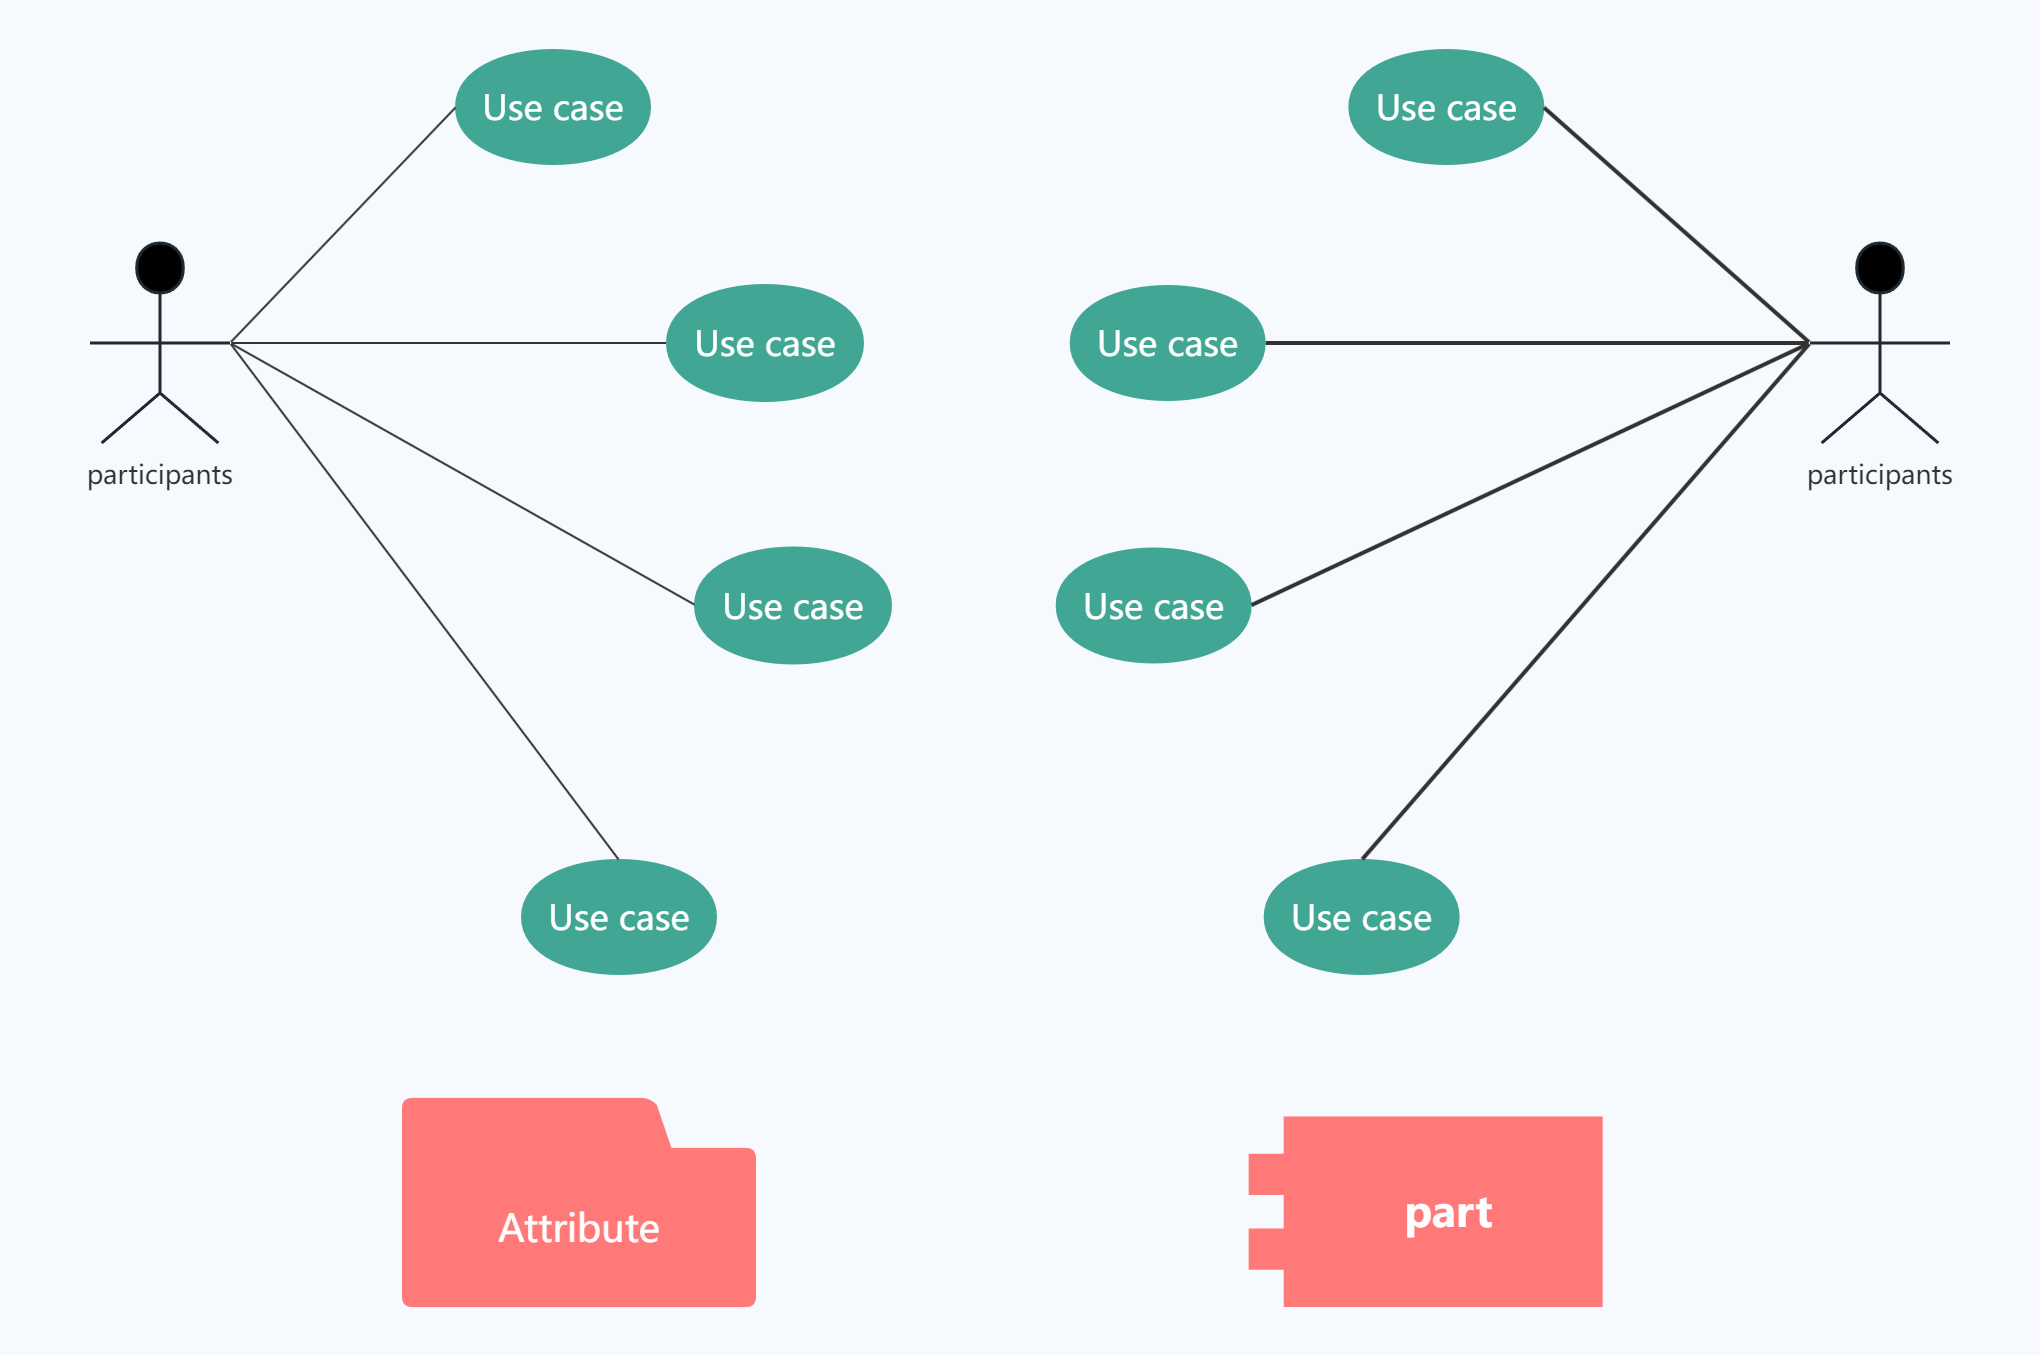
The root cause of unclear requirements in many front-end projects is not that the requirements document is not detailed enough, but that all parties have not reached a consensus on "what the system should do". Use case diagrams solve this problem in the simplest way - they draw the correspondence between "user roles" and "functional points", making it easy for product, design and development teams to understand at a glance.
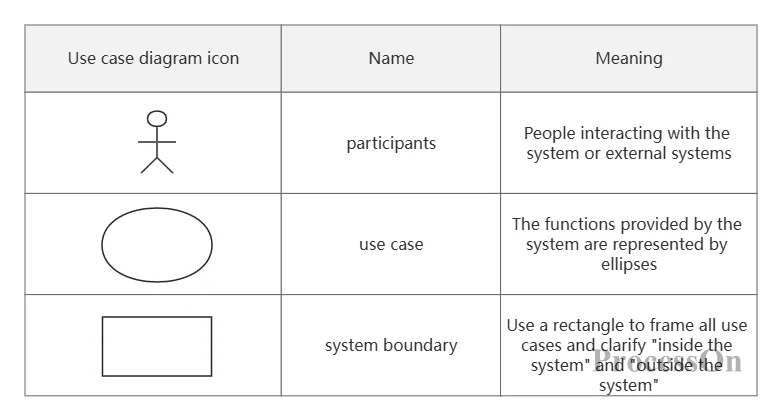
Core elements of use case diagrams
The core value of use case diagrams is defining the scope; they don't need to be drawn in too much detail .
Each use case is named using a phrase consisting of a verb and a noun, such as "Submit Order" or "Reset Password" .
If there is an inheritance relationship between participants (such as "VIP user" inheriting from "regular user"), it is indicated by a generalized arrow .
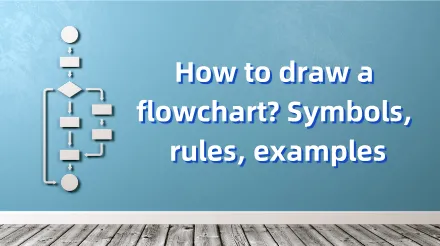
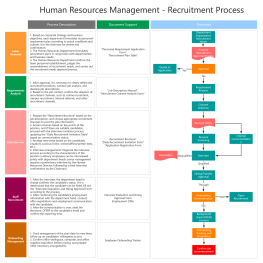
A flowchart is a diagram used to describe a business process, operational steps, or algorithmic logic. It uses graphic symbols and arrows to show the complete execution path from start to finish.
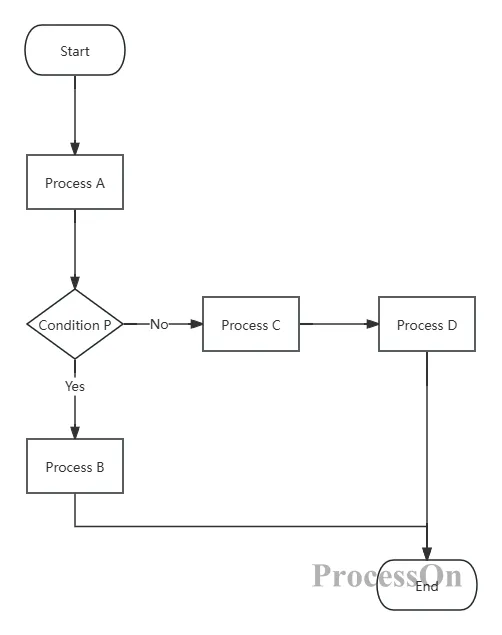
In front-end development, flowcharts are used in a wide range of scenarios:
Business logic breakdown: For example, the "user registration process"—fill in information → mobile phone verification → email verification → registration success/failure
Interaction flow design: For example, the "shopping cart checkout process"—select address → select payment method → confirm order → pay → result feedback
Front-end algorithm design: such as the rendering logic of "virtual scrolling of lists" and the decision tree for form validation.
The greatest value of flowcharts lies in making implicit "logical judgments" explicit—each diamond (judgment node) is a potential bug spot, and drawing it out allows the team to review it together.
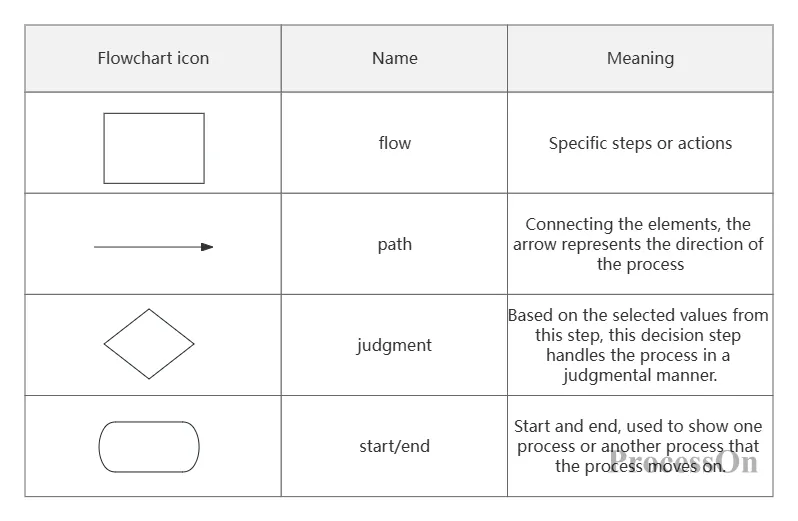
Core elements of a flowchart
Each decision node must have exactly two exits (yes/no or specific conditions).
The flow should be kept from top to bottom and from left to right as much as possible, avoiding arrow intersections.
Complex processes are recommended to be broken down into multiple sub-processes, which can be referenced using "sub-process" nodes.
Sequence diagrams are the most important type of UML interaction diagrams, used to show the message passing process between multiple objects in chronological order. They clearly present "who sent what to whom first, and then who did what" using a vertical timeline and a horizontal lifeline.
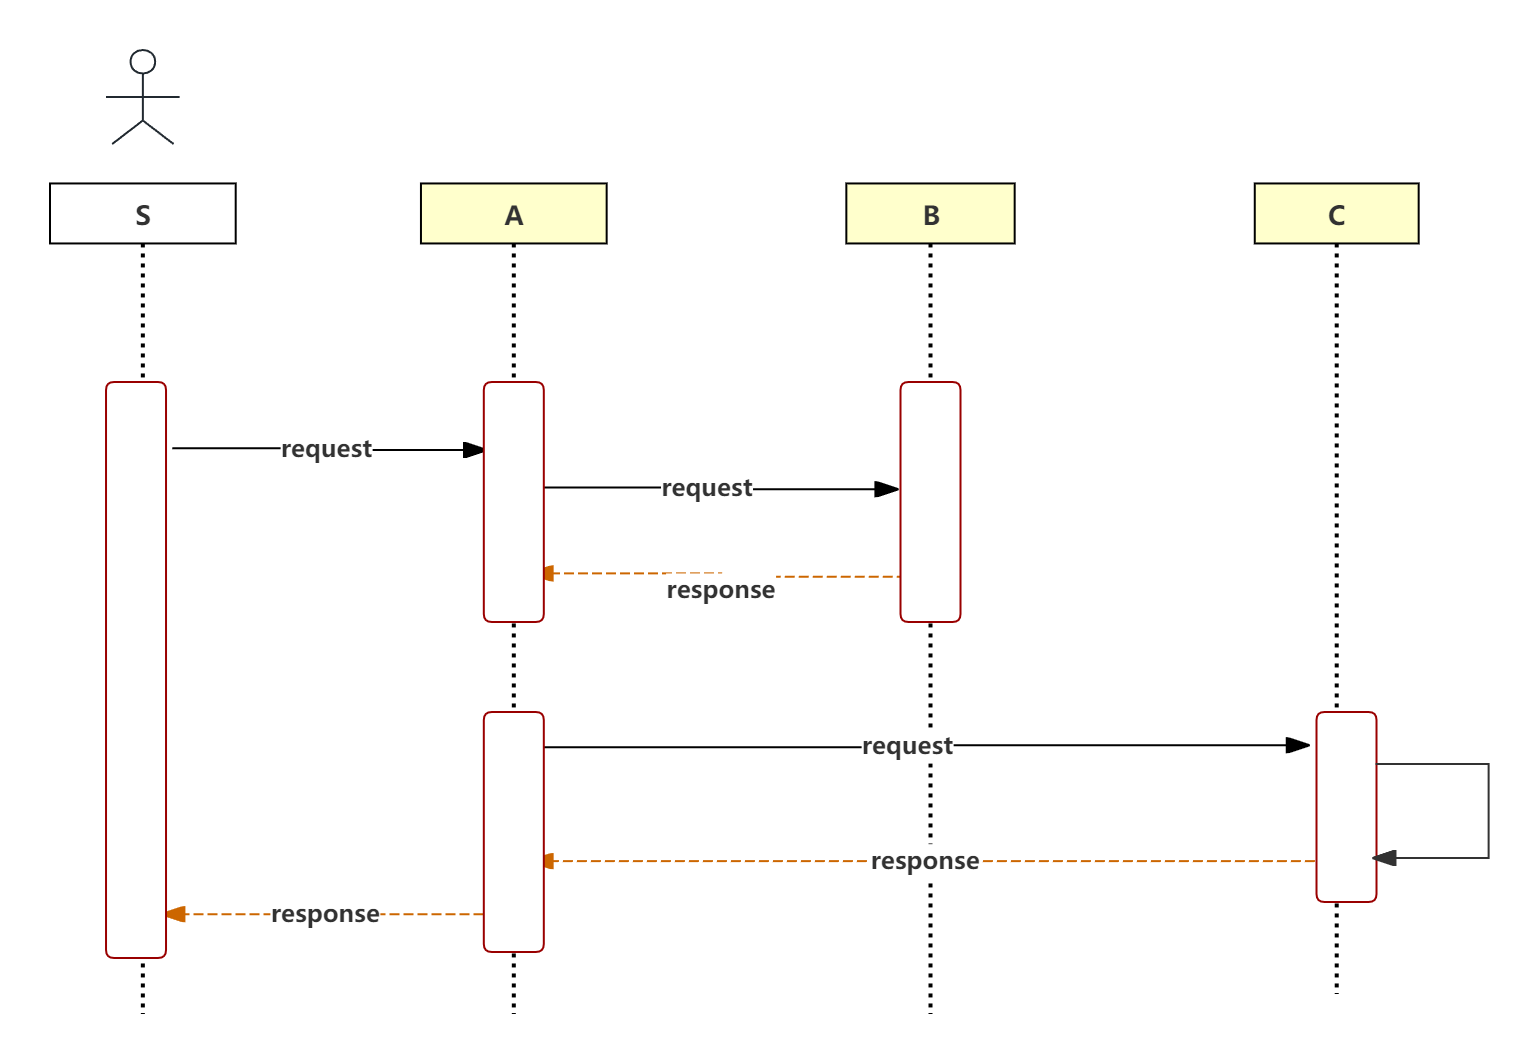
Sequence diagrams are the most important diagrams in front-end development, bar none.
The most buggy places in front-end development are often not inside a specific function, but rather in the timing of asynchronous processes. For example:
OAuth2 login process: User clicks login → Frontend sends request → BFF layer forwards → Authentication service verifies → Returns Token → Sets Cookie → Redirects to homepage
Payment callback process: User payment → Third-party callback → Backend processing → Frontend status polling → Order status update → Result display
These processes involve multiple systems (frontend, BFF, backend services, third-party APIs), and any timeout, failure, or disordered sequence in any step can lead to a crash in user experience. Sequence diagrams visualize all participants, message order, and return results in the entire call chain, making them the best tool for aligning interface protocols between the frontend and backend.
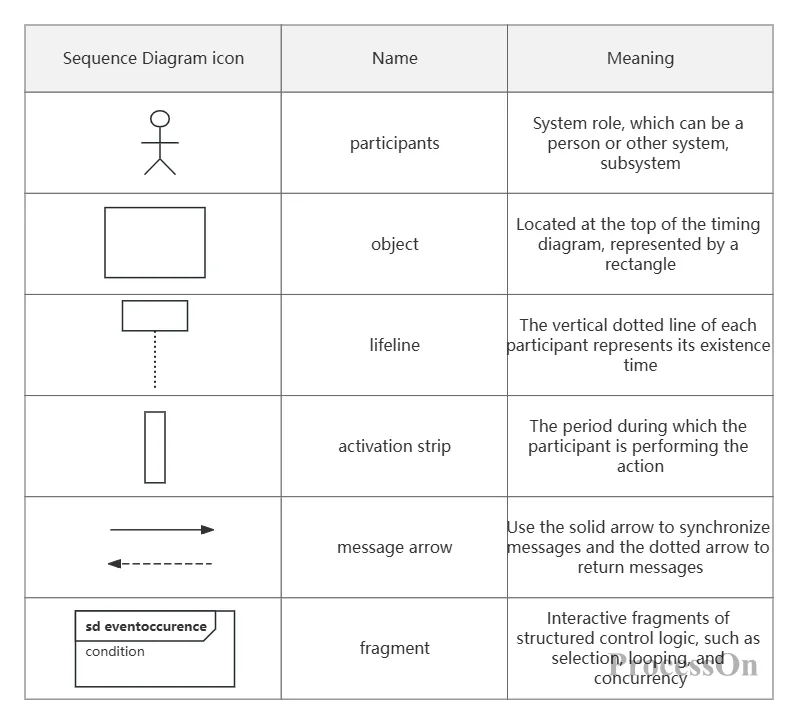
Core elements of a time sequence diagram
Participants are arranged from left to right, with the initiator usually on the far left.
The arrow direction indicates the message flow; the return arrow is represented by a dashed line.
Each message should include a brief description, such as "POST /api/login" or "Returns Token".
When conditional branches are involved, wrap them with alt and opt fragments.
A class diagram is a diagram in UML used to describe the static structure of a system, showing the attributes, methods, and relationships between classes (or interfaces).
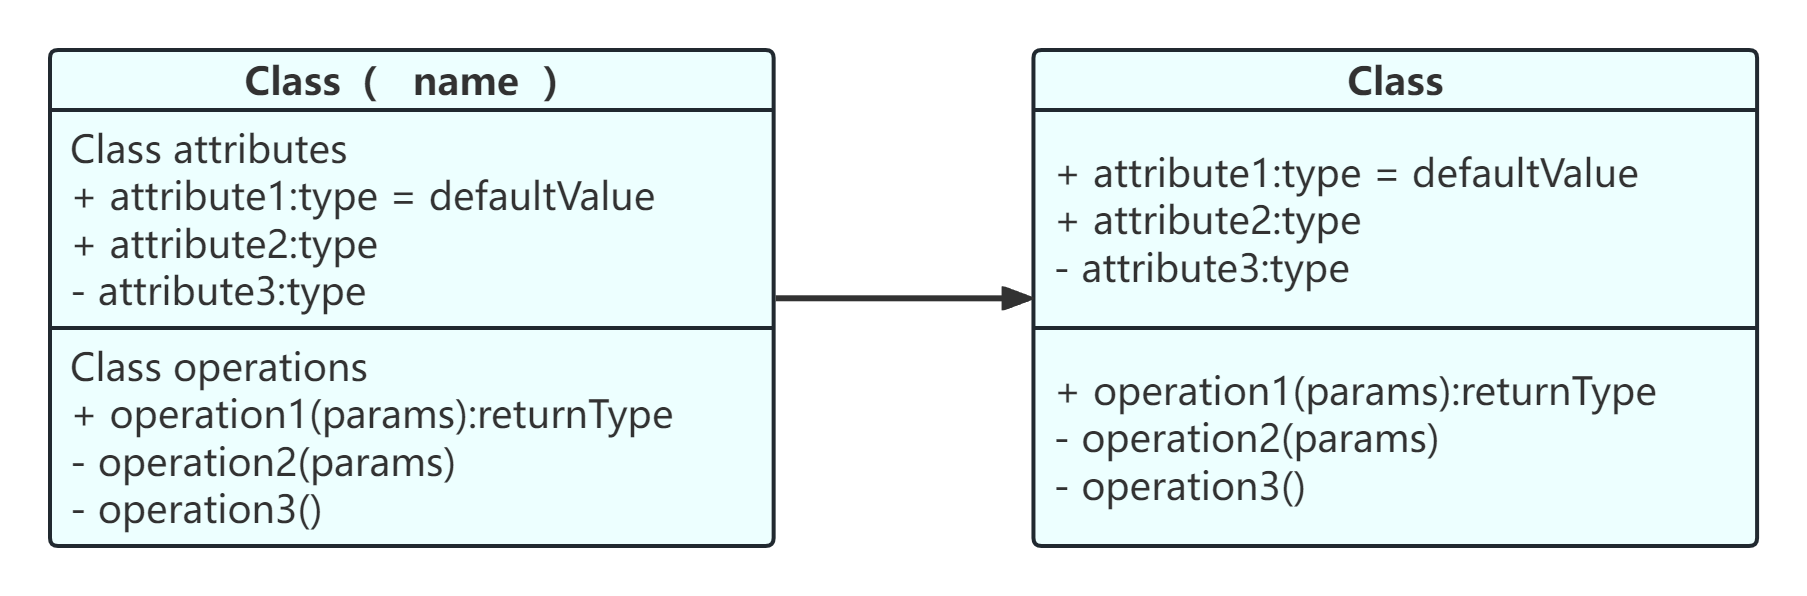
TypeScript has become a standard feature in front-end development, and class diagrams are tools that visualize the relationships between TypeScript's interface definitions, type declarations, and component props.
In large-scale front-end projects, the design of the data model directly determines the maintainability of the code. Class diagrams help the team determine "what the data structure should look like and how the modules should reference each other" before writing code, avoiding the discovery of type definition conflicts and interface mismatches halfway through development.
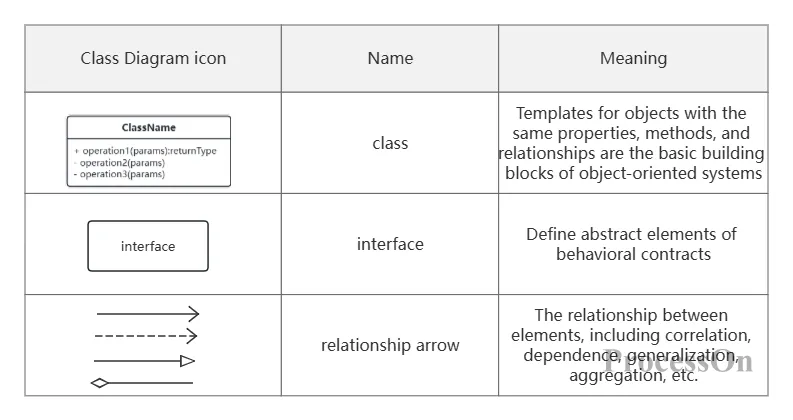
Core elements of class diagrams
In a class diagram, a "class" corresponds to an interface or class in TypeScript.
+ before an attribute indicates public, - indicates private, and # indicates protected.
Inheritance is represented by a hollow triangle arrow (e.g., "VIPUser inherits from User"), while interface implementation is represented by a dashed hollow triangle.
A component diagram is used to illustrate the physical components of a system (such as modules, libraries, and services) and the dependencies between them. It answers the question, "What independently deployable units make up the system, and how do they depend on each other?"
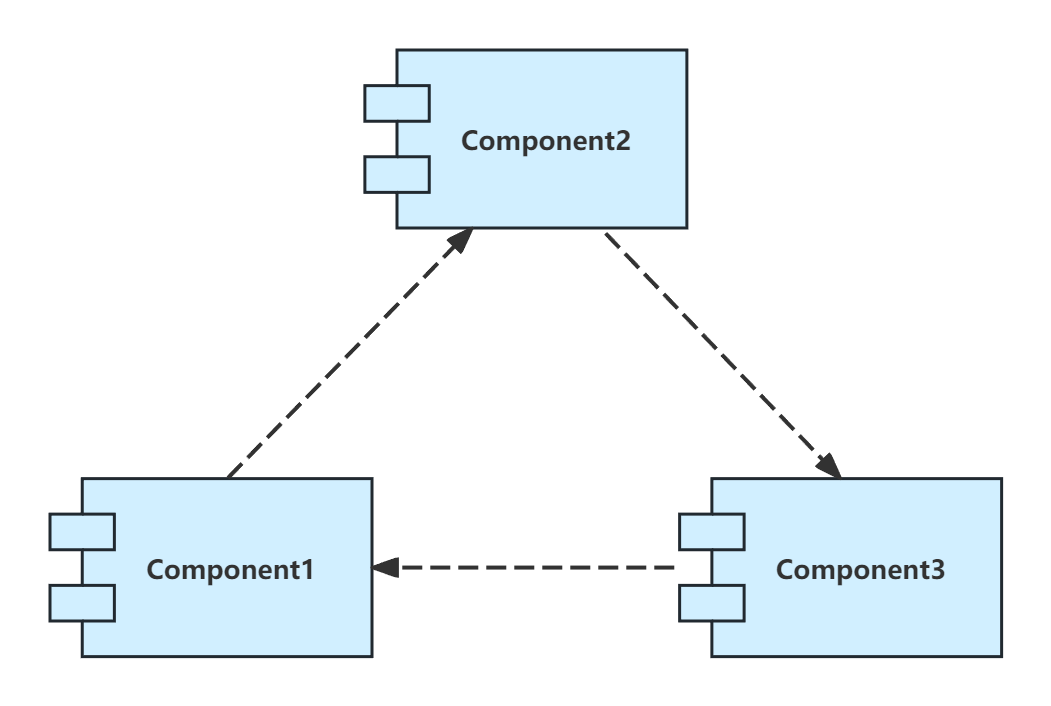
Modern front-end projects are almost entirely developed using components—React/Vue components, NPM packages, micro-frontend sub-applications, BFF layers, third-party SDKs… If the dependencies between these “components” are not visualized, problems such as circular dependencies, version conflicts, and disordered build orders can easily arise. Component diagrams help teams identify dependency risks in advance during the architecture design process.
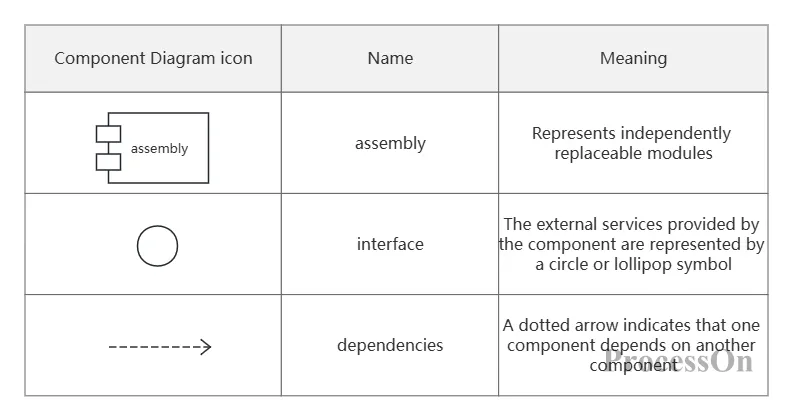
Core elements of component diagram
Component graphs focus on "module-level" dependencies and do not delve into classes or functions.
Dependencies should be kept unidirectional as much as possible to avoid circular dependencies.
Interfaces exposed to the outside world are labeled with a lollipop symbol.
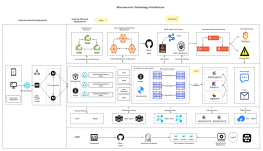
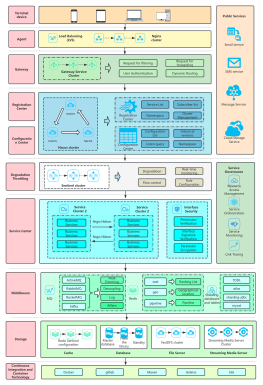
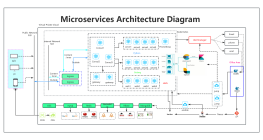
Architecture diagrams are one of the most common diagram types in front-end development, used to illustrate the overall structure, layered design, module division, and technology selection of a system. While not a standard UML diagram, it is the most frequently used in practice.
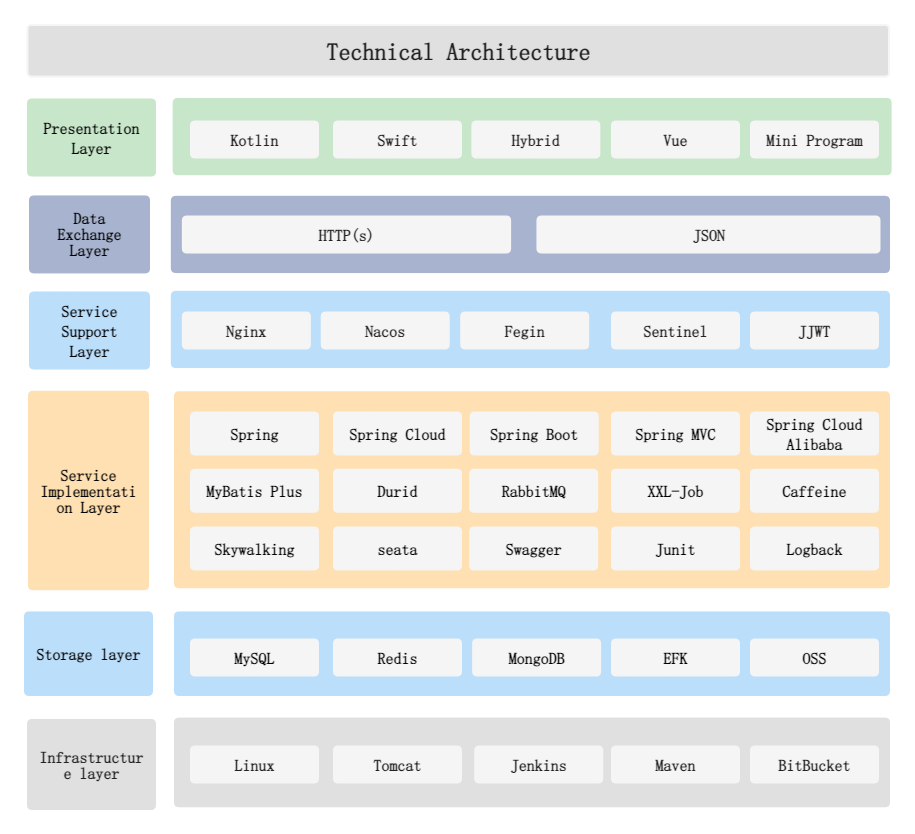
Technical architecture diagram
An architecture diagram is the "overall map" of a front-end project. Whether it's for technical solution reviews, new employee onboarding training, or providing a global perspective during troubleshooting, the architecture diagram is always the first diagram used. A good architecture diagram should allow the reader to understand "how many layers the system has, what each layer does, and where the key modules are" within 10 seconds.
Layered structure: From top to bottom, it is typically "User access layer → Application layer → Service layer → Data layer".
Module division: Each layer is divided into independent modules based on business domain or function.
Technology stack annotation: Annotate the technology selection (e.g., React, Node.js, Redis) on key modules.
External dependencies: Mark third-party services and cloud services with dashed boxes or different colors.
Layering is the core of an architecture diagram—each layer has a single responsibility and clear boundaries.
The direction of the arrow indicates the direction of data flow or call; they should be kept consistent.
Don't cram every detail into a single diagram; strive for "macro-level clarity" in architecture diagrams.
A deployment diagram is a UML diagram used to show the physical deployment structure of a system, including the distribution of servers, containers, network devices, and software components on the hardware.
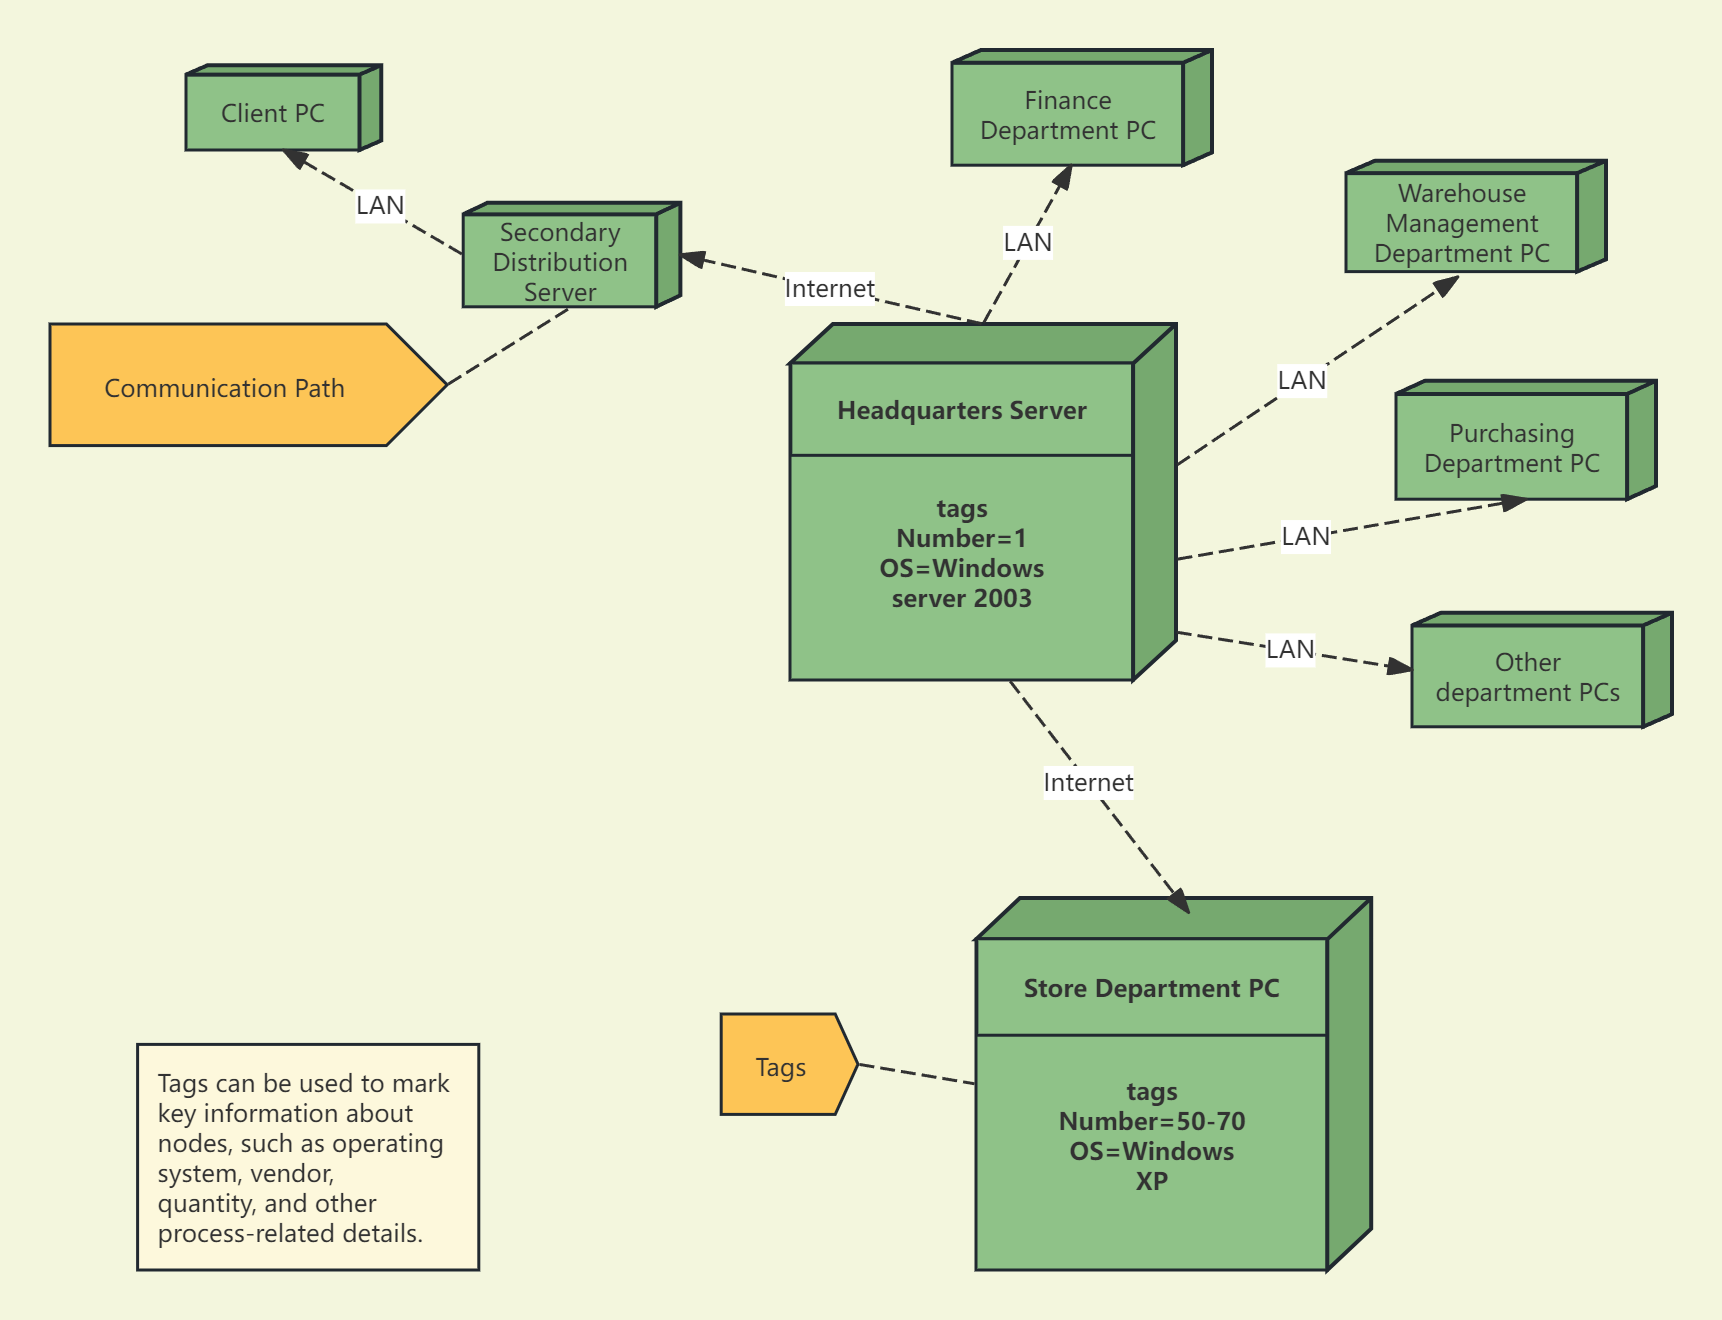
While deployment is typically handled by the operations team, it's equally important for front-end developers to understand the deployment diagram:
CI/CD Configuration: Understanding which environment frontend build artifacts are deployed to and how they are distributed to the CDN.
Troubleshooting Environmental Differences: Development, testing, pre-release, and production environments have different deployment structures. Deployment diagrams help pinpoint "why the testing environment works correctly but the production environment throws errors."
Containerized Deployment: Understanding how front-end applications are deployed in Docker containers or Kubernetes clusters
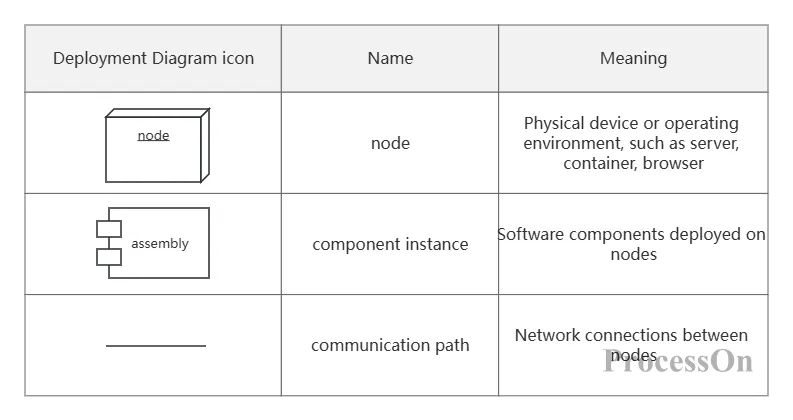
Deployment diagram core elements
Nodes are represented by cubes, and the components within a node are represented by rectangles.
The annotation nodes contain key information such as the operating system and runtime environment.
The communication path is labeled with the protocol (e.g., HTTP/HTTPS, WebSocket).
A state diagram is used to describe all the states that an object may go through during its lifecycle, as well as the events and conditions that trigger state transitions.
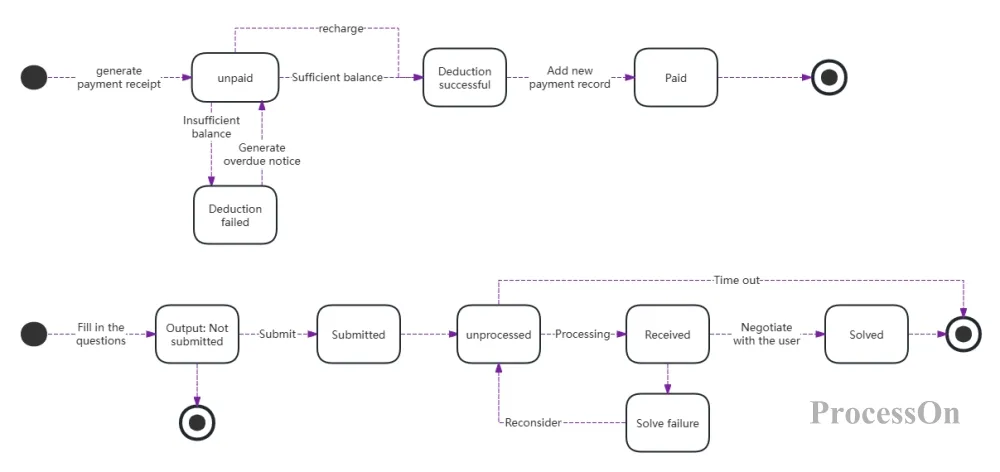
Recharge and feedback status diagram
In front-end development, state management is one of the most complex topics. Whether it's React's useState/useReducer, Vue's reactive data, or global state libraries like Redux/Zustand, they are all essentially managing "state" and "state transitions".
State diagrams provide a clear overview of the states of a UI component or business entity and the conditions under which they transition, making them a prerequisite tool for designing state management solutions.
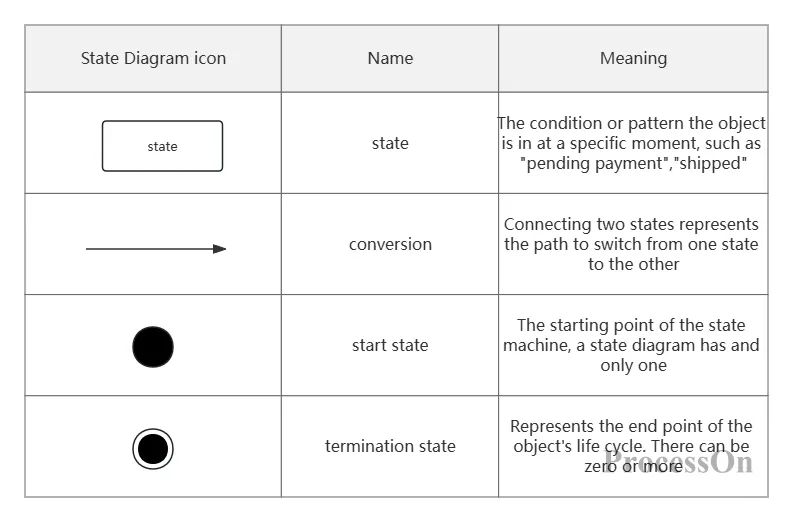
Core elements of a state diagram
Each status is named using the format "adjective + noun", such as "Logged in" or "Loading".
Each conversion is triggered by a condition, such as "user clicks the submit button".
A state diagram represents the lifecycle of a single object; avoid mixing in multiple objects.
The above eight chart types cover the entire front-end development process from requirements analysis to deployment. However, knowing "what to draw" is only the first step; choosing the right tools is equally crucial.
ProcessOn, a professional online charting and collaboration platform, provides front-end developers with a one-stop charting solution:
Extensive Template Library: The ProcessOn template community covers a variety of frequently used front-end diagram types, including sequence diagrams, class diagrams, use case diagrams, flowcharts, and architecture diagrams. Simply clone and use them with one click.
Multiple diagram types supported: ProcessOn supports professional drawing of standard UML diagrams (sequence diagrams, class diagrams, use case diagrams, state diagrams, deployment diagrams) as well as frequently used flowcharts, architecture diagrams, and mind maps.
AI-generated diagrams: Simply enter a text description to generate flowcharts, mind maps, sequence diagrams, and more with a single click, significantly lowering the barrier to diagram creation.
Team Collaboration: Supports real-time online collaboration among multiple users. The front-end team can jointly maintain architecture diagrams and technical documents, and each modification automatically saves historical versions.
Q1: What charts must front-end developers master?
A: Based on usage frequency and importance, it is recommended to prioritize mastering: sequence diagrams (most important, for clarifying asynchronous processes), flowcharts (for daily business logic), architecture diagrams (essential for solution review), and class diagrams (for data modeling in TypeScript projects). Building upon this foundation, supplement with use case diagrams (for requirements analysis), component diagrams (for module design), state diagrams (for state management), and deployment diagrams (for deployment) according to project phases.
Q2: Why is the sequence diagram the most important diagram in front-end development?
A: The most buggy places in front-end development aren't inside any specific function, but rather in the timing of asynchronous processes. Login, payment, polling, WebSocket reconnection… these processes involve multiple systems, and any timeout or disorder in the sequence of any step will cause problems. Sequence diagrams visualize all participants in the call chain, the message order, and the return results, making them the best tool for aligning front-end and back-end interfaces and troubleshooting asynchronous issues.
Q3: How do I use class diagrams in a TypeScript project?
A: In TypeScript projects, class diagrams correspond to interface definitions and type declarations. Defining the data model (such as User, Order, Product) and their relationships using class diagrams before starting coding can prevent repeated modifications to type definitions and inconsistencies between front-end and back-end interfaces during development. Class diagrams are also an important reference for assessing the scope of impact during code refactoring.
Q4: What is the difference between an architecture diagram and a component diagram?
A: Architecture diagrams focus on "macro-level layering"—how many layers the system has, what technologies each layer uses, and where the key modules are located; it's a global view for everyone. Component diagrams focus on "module dependencies"—which components depend on which components, and whether there are circular dependencies; it's a detailed view for architects and core developers. The two complement each other—architecture diagrams answer "what the system looks like," while component diagrams answer "how modules depend on each other."
Q5: What is the difference between a flowchart and a sequence diagram?
A: Flowcharts focus on the control flow and decision logic within a single system—input → processing → judgment → output. Sequence diagrams focus on the message passing order between multiple systems—who sends a message to whom first, and who replies with what. Simply put: flowcharts are a "single-machine" perspective, while sequence diagrams are a "networked" perspective. Both are needed in front-end development—use flowcharts for business logic and sequence diagrams for API calls.
Q6: Can ProcessOn draw UML diagrams?
A: Yes. ProcessOn supports a full range of UML diagram types, including sequence diagrams, class diagrams, use case diagrams, state diagrams, and deployment diagrams. The template community offers a large number of templates that can be directly cloned. It also supports frequently used diagrams in front-end development, such as flowcharts, architecture diagrams, Gantt charts, and mind maps, covering all needs on one platform. ProcessOn's AI capabilities also allow for one-click diagram generation from text descriptions, further lowering the barrier to entry for diagram creation.