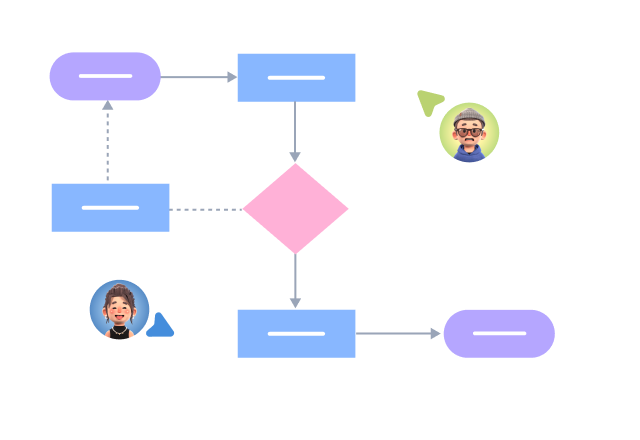


Supports real-time multi-user co-creation with shareable links for instant information transfer
Automatically generates graphics from text input and applies style enhancements
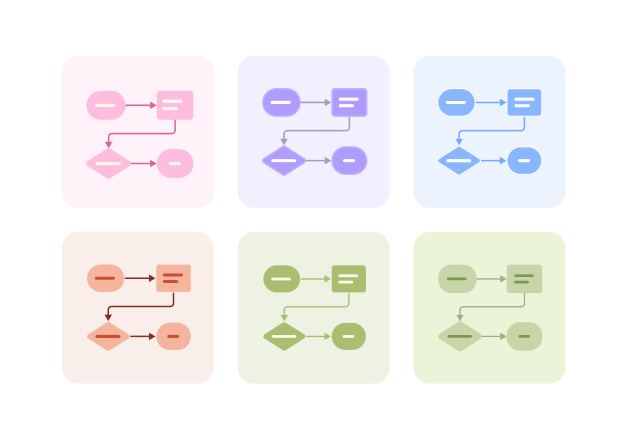
Prebuilt themes with full customization for personalized designs
Supports icons, images, labels, LaTeX formulas, code blocks, links, attachments and more
Export: PNG, VISIO, PDF, SVG | Import: VISIO, Mermaid
Real-time cloud storage, multi-device sync, version history, and secure data protection
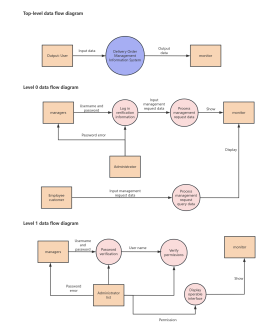
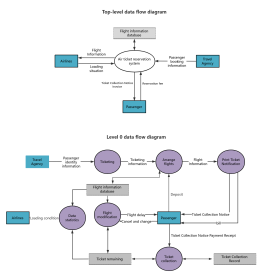
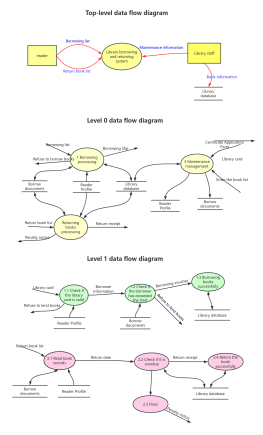
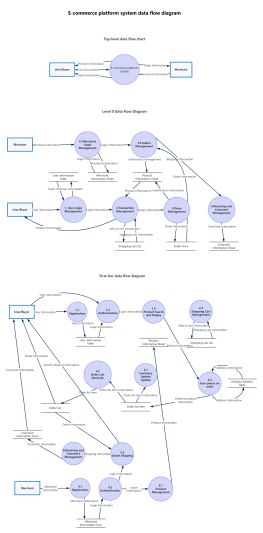
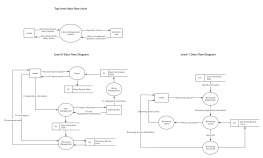
A data flow diagram emphasizes the flow and processing of data, while a flowchart mainly describes the execution flow of a program.
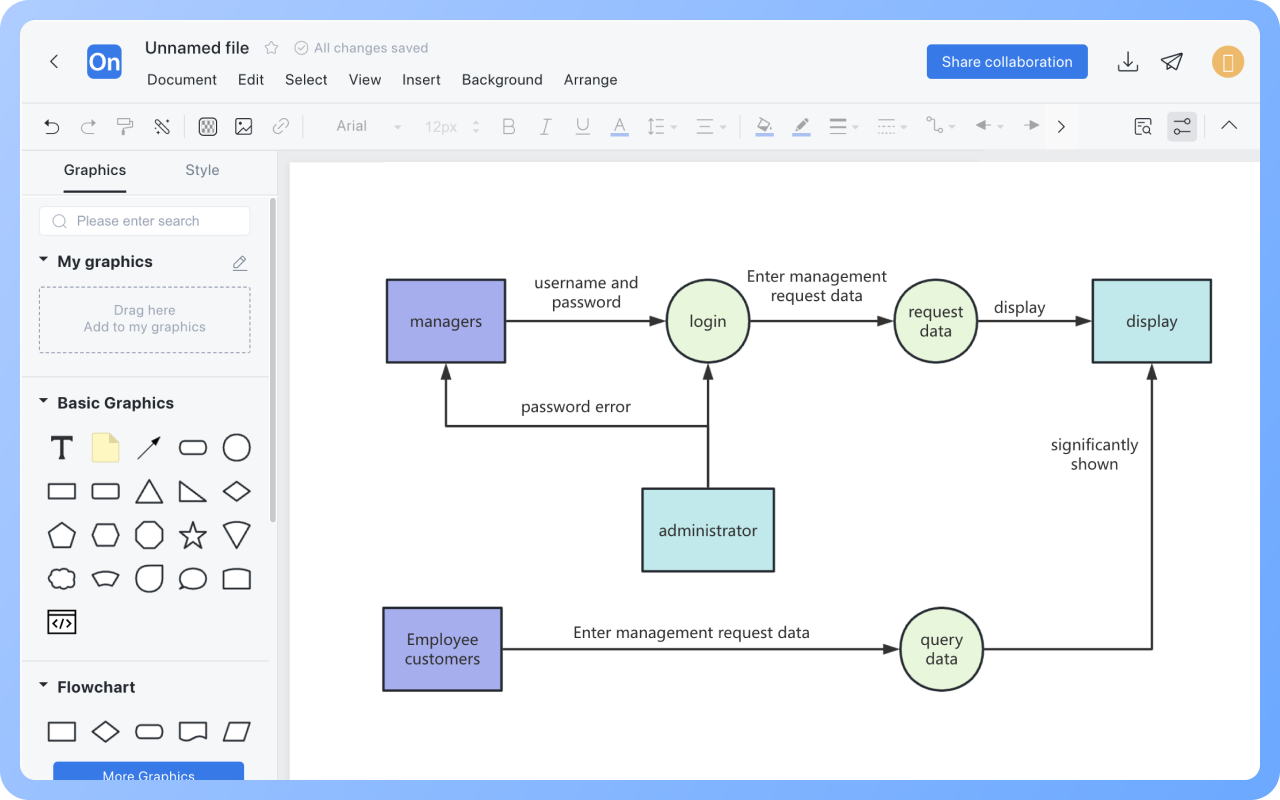
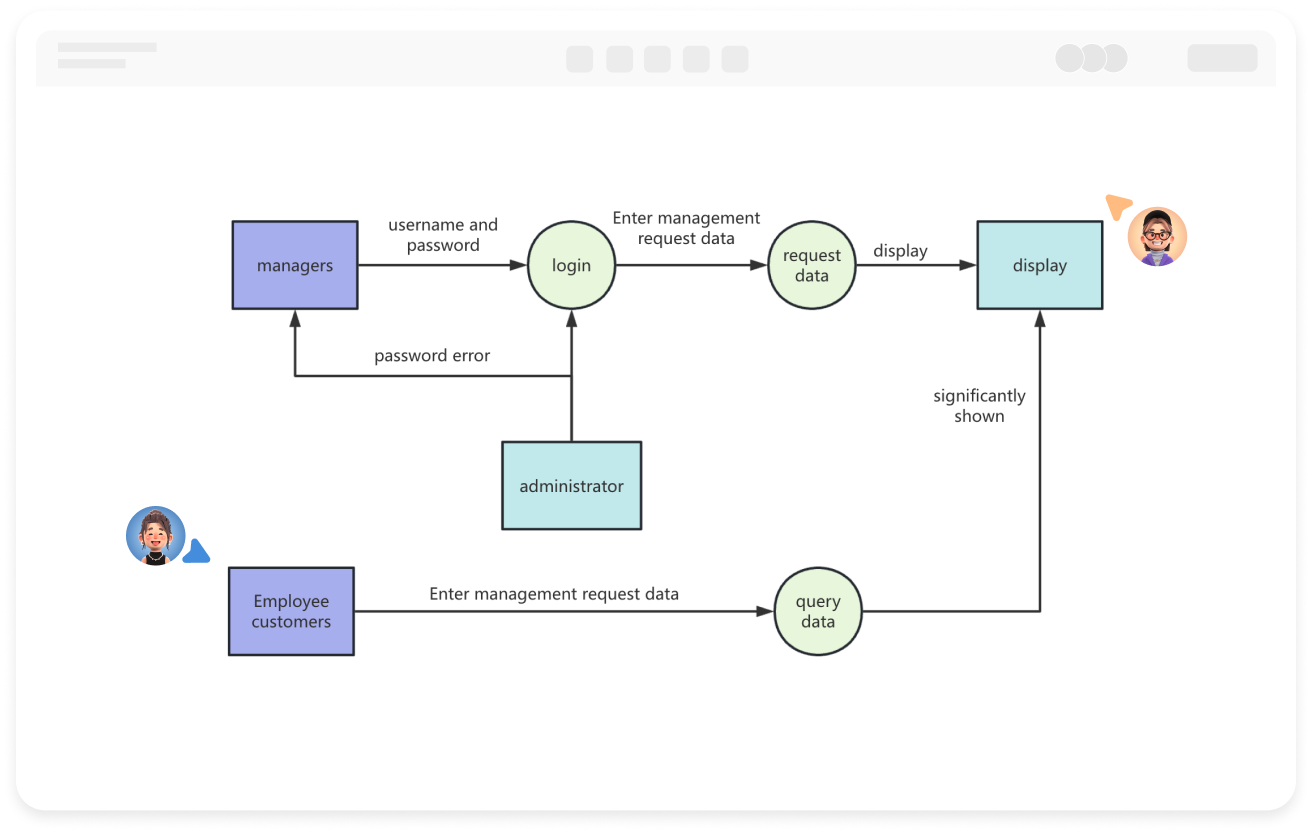
Select the connection line, click 'Line Type' in the top toolbar, change the line to a curve, and click the hollow circle on the curve to adjust the curve's arc.
Double-click the connection line to enter text content. Left-click and drag the text to move its position.
Select the connection line, and the 'Start/End Arrow' in the top toolbar can set the direction of the arrow.
Select the shape in the data flow diagram, and the top toolbar can modify the color, font, and other styles of shapes, lines, and text.
Can control flow appear in a data flow diagram?
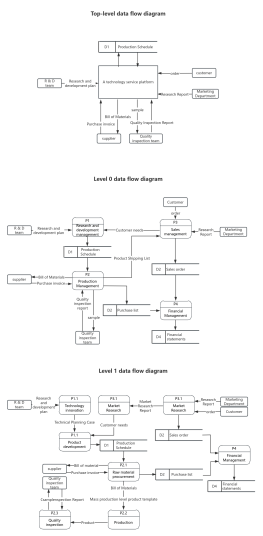
Follow the top-down, stepwise decomposition principle, ensure consistent data flow direction, have clear input and output in the process, avoid intersecting data flows, and make the diagram clear and understandable.