Process Type
Graphical expression
Mind Type
Structured expression
Note Type
Efficient expression
Treemap
Bracket Diagram
Default Mode


In the 19th century, British mathematician John Venn invented a tool to show the relationship between sets with geometric figures - the Venn Diagram. This diagram, which uses overlapping circles to express the intersection, union and complement of sets, has not only become a basic tool in the field of mathematics, but also has shown strong practicality in logical reasoning, probability statistics and data analysis. This article will systematically analyze the core value of the Venn Diagram in mathematics from five dimensions: definition, mathematical application scenarios, typical cases, production tools and drawing methods.
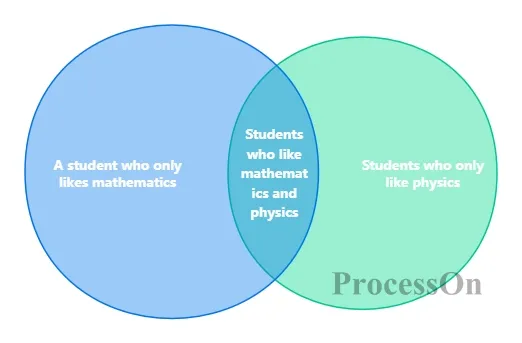
The Venn diagram uses circular or elliptical overlapping areas to intuitively present the logical relationship between multiple sets. Its core elements include:
Set representation: Each circle represents an independent set, and the area inside the circle is the set element;
Intersection (∩): The overlapping area represents the common elements of two or more sets;
Union (∪): The total area covered by all circles represents the result of the union of the sets;
Complement: The area within the rectangular box (domain) not covered by the circle represents the elements that do not belong to any set.
For example, in the Venn diagram of set A (students who like mathematics) and set B (students who like physics), the overlapping part represents "students who like both mathematics and physics", and the non-overlapping part represents "students who only like mathematics" and "students who only like physics" respectively.
1. Intuitive set operations
Venn diagrams transform abstract set operations into visual operations. For example, when proving De Morgan's law ((A∪B)' = A'∩B'), by drawing the complement and intersection of two sets, you can visually verify that the equation holds. This graphical proof method is widely used in elementary mathematics education to help students break through the cognitive barriers of symbolic logic.
2. Modeling tools for probabilistic problems
In probability theory, Venn diagrams are a powerful tool for solving problems involving independent events, mutually exclusive events, and conditional probability. For example, when calculating the probability of "rolling a dice and getting an even number greater than 3", you can directly obtain the probability value of the intersection area {4,6} by drawing a Venn diagram of event A (even number: {2,4,6}) and event B (>3: {4,5,6}). Research at the University of Cambridge shows that students who use Venn diagrams are 40% more efficient in solving probability problems.
3. The derivation framework of logical propositions
Venn diagrams can transform logical propositions such as "all A is B" and "no A is C" into geometric relationships. For example, in the syllogistic reasoning "all metals are conductors, copper is metal, therefore copper is a conductor", by drawing the inclusion relationship circle of "metal" and "conductor", the inevitability of the conclusion can be quickly verified. This graphical reasoning method is also widely used in Boolean algebra in computer science, database query optimization and other fields.
Student course selection statistics
Among the 50 students in a class, 28 took math competitions, 23 took chemistry competitions, and 5 did not participate in any competitions. The following model can be established through the Venn diagram:
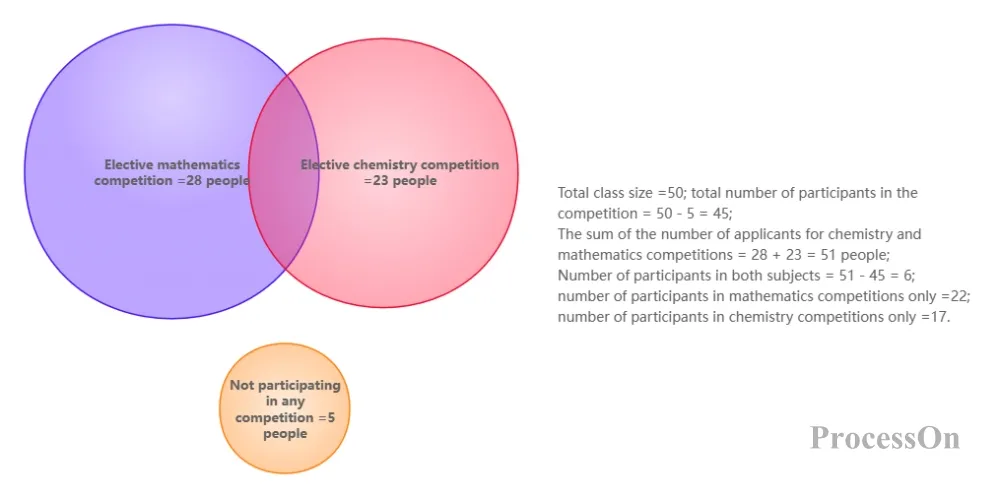
Student course selection statistics - Venn diagram
Total number of participants = 50 - 5 = 45;
the Chemistry and Mathematics competitions = 28 + 23 = 51;
Number of participants in both subjects = 51 - 45 = 6.
The final Venn diagram shows that 22 people participated in the math competition alone, 17 people participated in the competition alone, and 6 people participated in both subjects. This case verifies the efficiency of the Venn diagram in solving the "overlap counting problem".
PPT/SmartArt: Suitable for quickly drawing Venn diagrams of 2-3 groups of data. You can generate basic graphics through "Insert → SmartArt → Relationship → Basic Venn Diagram", which supports color and transparency adjustment.
Origin/R language: When processing more than 3 sets of complex data, Origin's Venn Diagram plug-in or R language's ggVennDiagram package can generate high-precision graphics.
Online tool: ProcessOn, which does not require data to be filled in and supports directly dragging graphics to the canvas , is suitable for users without programming knowledge.
Next , taking ProcessOn as an example , we will introduce how to draw a Venn diagram:
Define a set: Enter the ProcessOn file page, create a new flow chart, and specify the set to be analyzed (such as subject A, subject B);
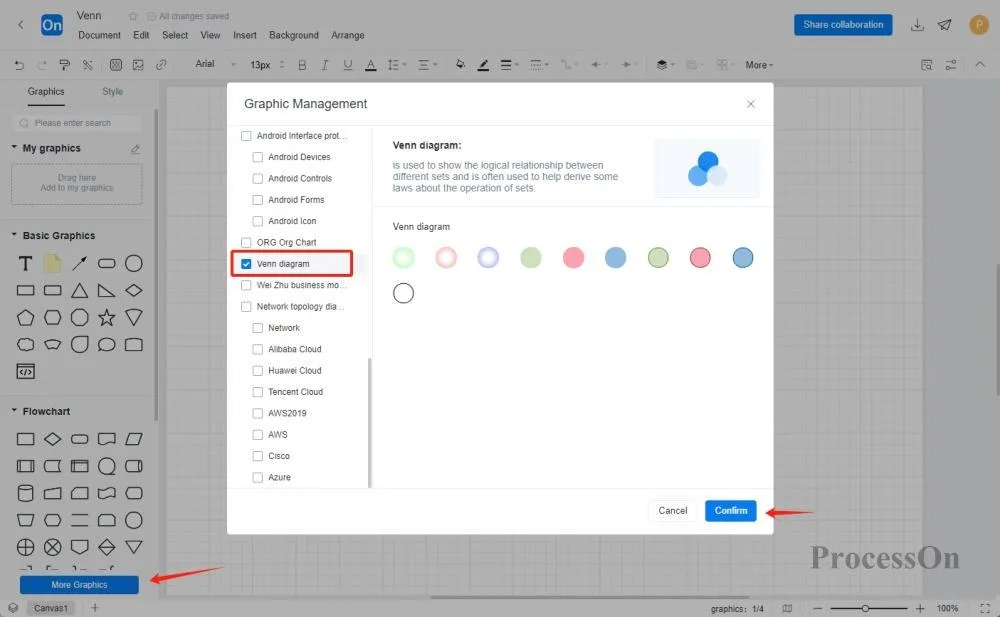
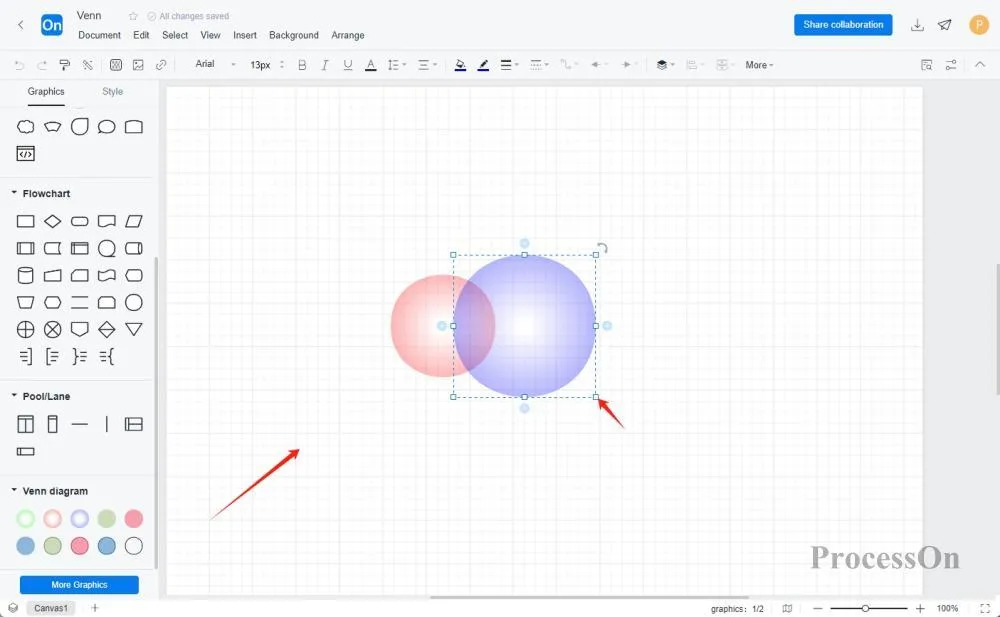
Draw basic shapes: Click "More Shapes" on the left, select Venn Diagram, drag two circles from the shape area to the canvas , and adjust the positions so that they partially overlap;
Marking area: fill non-overlapping areas and intersection areas with different colors, and add element quantity labels;
Optimize display: adjust color, transparency , etc. , and add text descriptions such as "only A", "only B", "A∩B", etc.
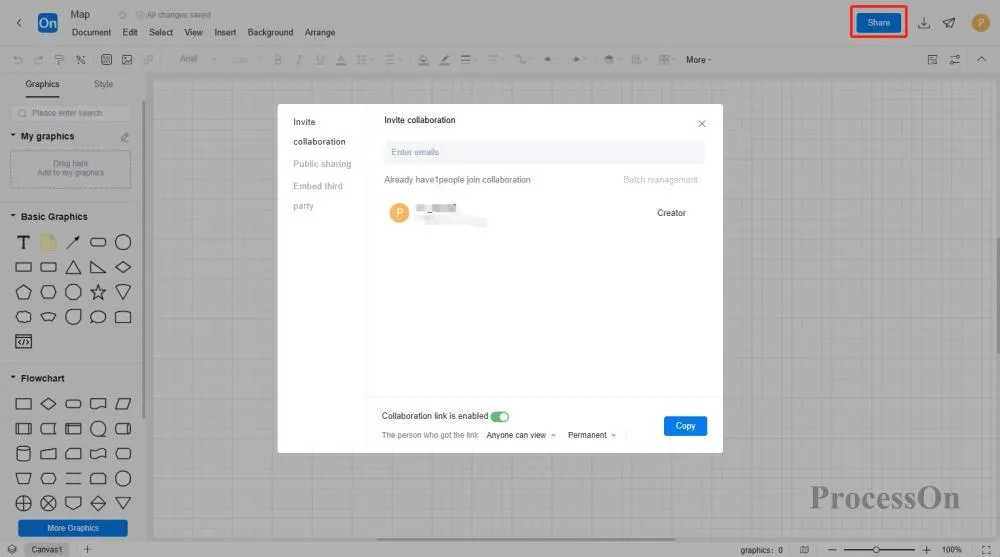
Download or share: After drawing the Venn diagram, you can click the download button in the upper right corner to export it to image, PDF or other formats, or generate an online link to share with others.
Although the Venn diagram has the advantage of being intuitive, its limitations should also be noted:
Limitation on the number of sets: Traditional Venn diagrams can clearly display up to 5 sets of data. If the number exceeds this, it is recommended to use UpSet diagrams instead;
Risk of area distortion: The area of the circle may not be proportional to the size of the set, and the specific number of elements needs to be marked in the figure;
Not applicable for continuous data: For continuous data such as time series, temperature changes, etc., you need to use a line chart or heat map instead.
From set operations in the classroom to differential analysis in genomics, Venn diagrams, with their concise geometric language, transform abstract mathematical logic into perceptible visual models. As data complexity increases, the integration of Venn diagrams with tools such as UpSet diagrams and tree diagrams is driving mathematical visualization to a higher dimension. For learners, mastering the drawing and application of Venn diagrams is not only about mastering a tool, but also an important way to cultivate structured thinking and interdisciplinary analysis capabilities.