
Application of Venn Diagram in Mathematics
0 Report
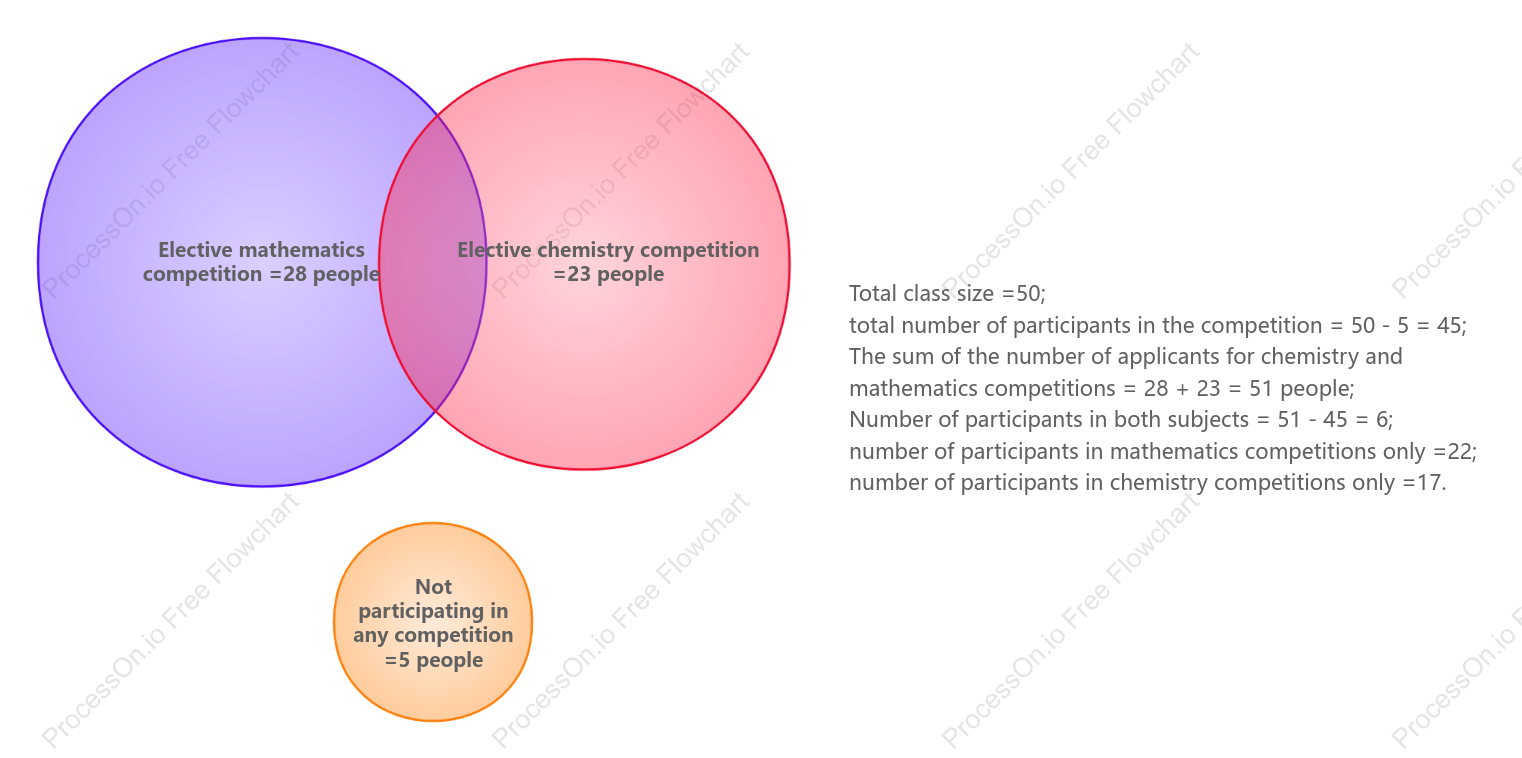
This flowchart illustrates the application of Venn diagrams in mathematics, specifically in analyzing participation in elective competitions. It provides a visual representation of a class of 50 students, where 5 students do not participate in any competition. Among the participants, 28 are involved in the mathematics competition, and 23 in the chemistry competition. The Venn diagram helps identify that 6 students participate in both competitions, while 22 are exclusive to mathematics and 17 to chemistry. This tool effectively breaks down the distribution of participants, offering a clear understanding of overlapping and unique entries.
Related Recommendations
Other works by the author
Outline/Content
See more
Not participating in any competition =5 people
Elective mathematics competition =28 people
Elective chemistry competition =23 people
Total class size =50; total number of participants in the competition = 50 - 5 = 45; The sum of the number of applicants for chemistry and mathematics competitions = 28 + 23 = 51 people; Number of participants in both subjects = 51 - 45 = 6;number of participants in mathematics competitions only =22;number of participants in chemistry competitions only =17.


Collect

Collect

0 Comments
Next Page