Register
Process Type
Graphical expression
Mind Type
Structured expression
Note Type
Efficient expression

Create decision tree diagram models online

Free to use
Create decision tree diagram models online
What is Decision Tree Diagram

Decision tree models are a type of supervised learning algorithm based on a tree structure. Given the probabilities of various scenarios, they use a tree structure to calculate the probability that the expected net present value is greater than or equal to zero, providing a graphical tool for evaluating project risk and conducting decision analysis.

ProcessOn supports online creation of decision tree models and offers a vast library of copyable templates and examples, allowing you to easily create professional and aesthetically pleasing decision tree models. Once completed, you can export them as high-resolution images, PDFs, and other formats.

Free to use

ProcessOn Decision Tree Diagram Key Features

Online Collaboration

Supports real-time multi-user co-creation with shareable links for instant information transfer

Online Collaboration
One-Click AI Generation

Automatically generates graphics from text input and applies style enhancements

One-Click AI Generation
Personalized Style Customization

Prebuilt themes with full customization for personalized designs

Personalized Style Customization
Multiple Component Types

Supports icons, images, labels, LaTeX formulas, code blocks, links, attachments and more

Multiple Component Types
Multi-Format Compatibility

Export: PNG, VISIO, PDF, SVG | Import: VISIO, Mermaid

Multi-Format Compatibility
Cross-Device Sync

Real-time cloud storage, multi-device sync, version history, and secure data protection

Cross-Device Sync
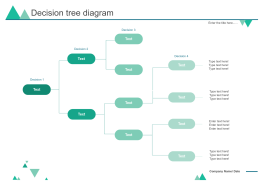
Easily create decision tree diagrams

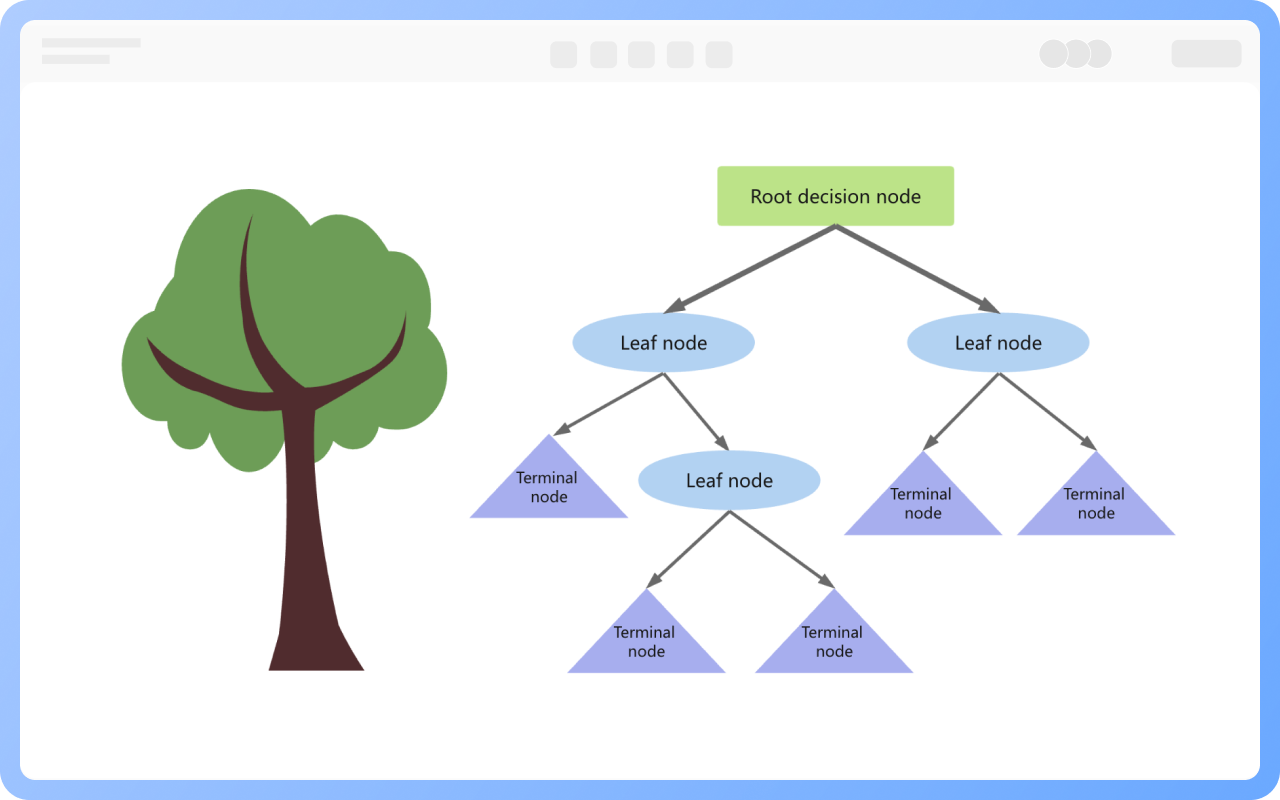
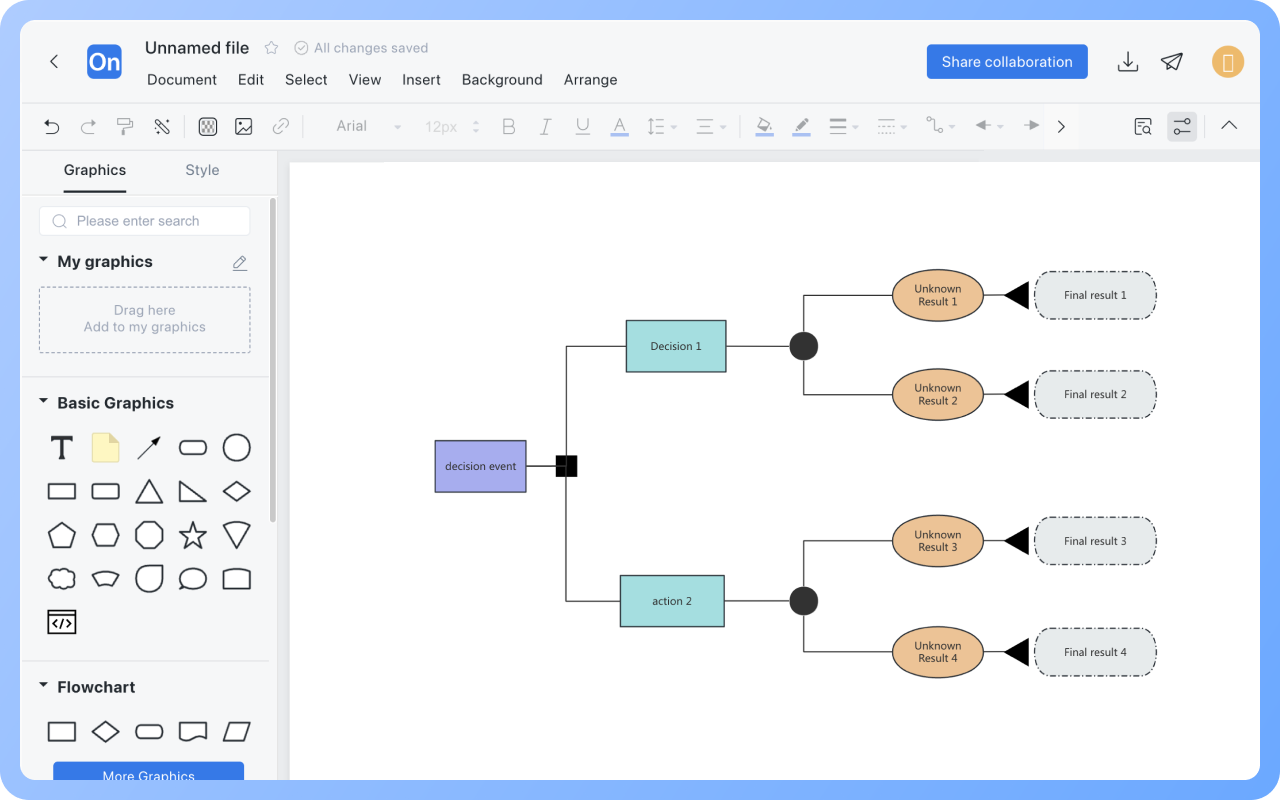
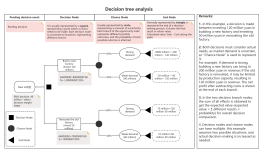
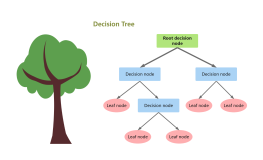
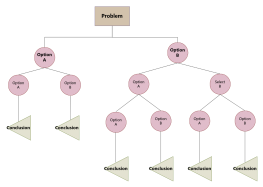
Decision tree models use branch nodes to represent different decision paths, while leaf nodes represent various possible outcomes or outputs. Each internal node (non-leaf node) represents a test condition or decision point; depending on the value of that condition, the decision path will lead to different child nodes.

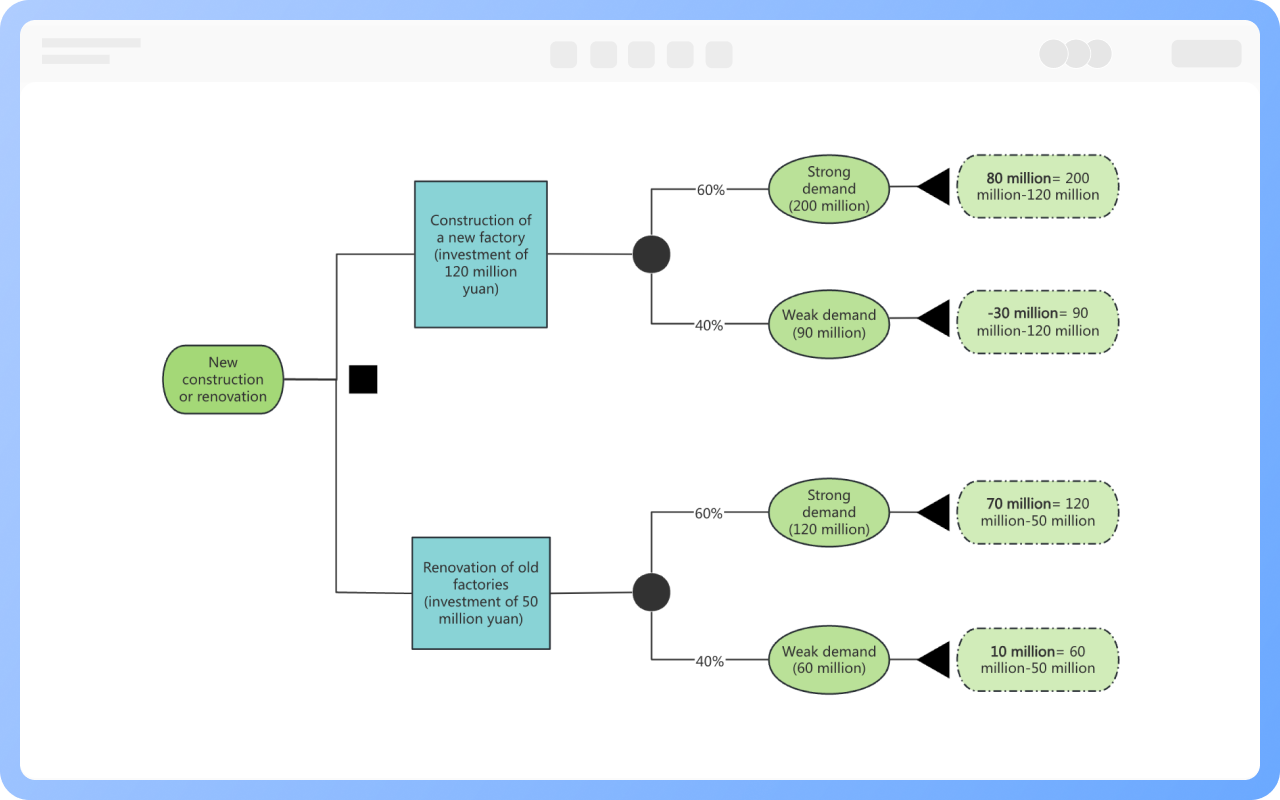
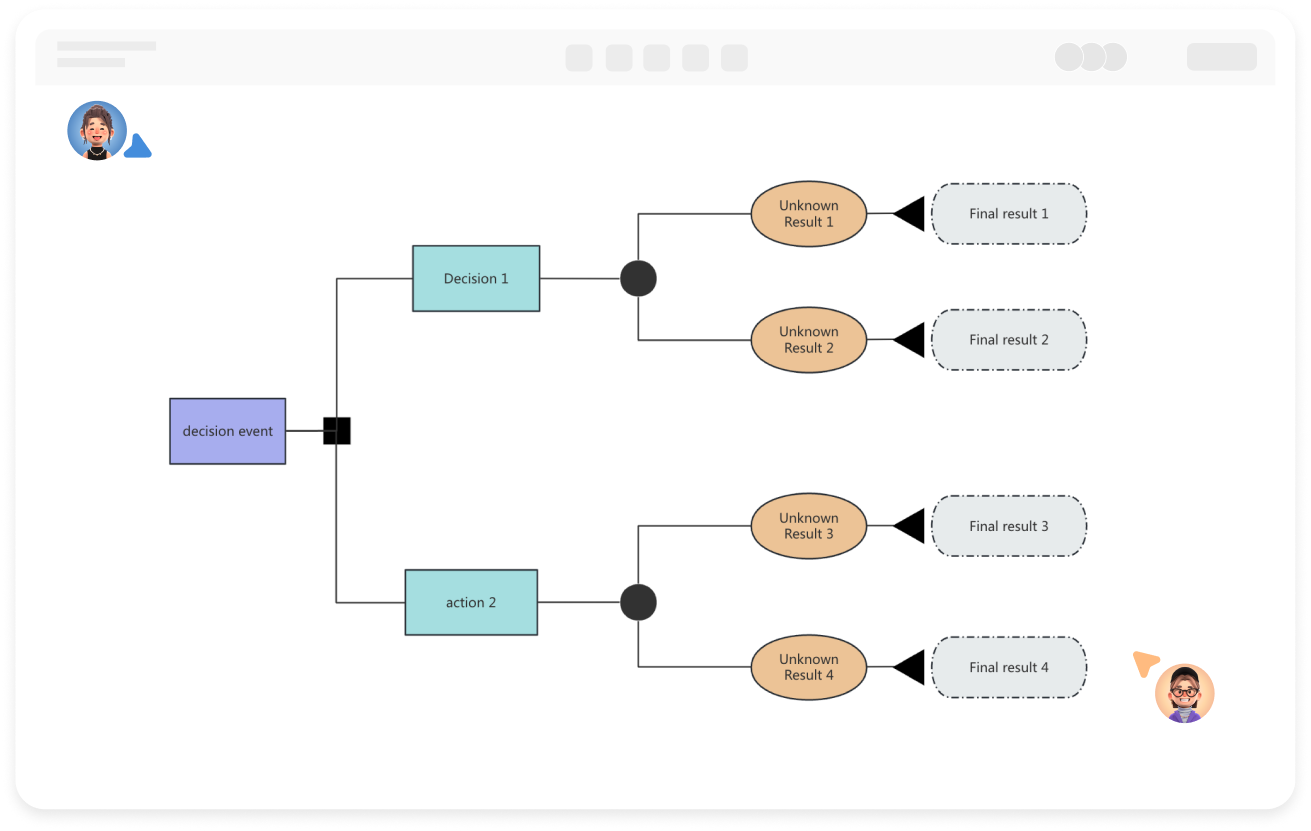
ProcessOn supports online creation of decision tree diagrams. Drag-and-drop operations allow for quick creation of decision tree nodes and path connections, and annotations can be inserted to explain each decision step.

Create Charts Online
Easily
Highlighting key decision paths in the decision tree

A decision tree consists of decision nodes (root), option branches (options or decision paths), chance nodes (uncertain events or unknown outcomes), probability branches (outcomes and probabilities under uncertain decisions), and terminal nodes (final states or decision results under different conditions).

ProcessOn allows you to set the color of each node or connection in the decision tree, highlighting key paths and improving readability.

Create Charts Online
Highlighting
Best Practices for Designing Decision Tree Models

1. Clearly define the decision objective, ensuring the root node accurately reflects the core issue.
2. Branch design should follow the principles of mutual exclusivity and completeness, with each node corresponding to a specific condition, and branches covering all possible scenarios to avoid omissions or overlaps.
3. Verify logical consistency to ensure that every path from root to leaf complies with actual business rules.

Create Charts Online
Best
Decision tree templates for multiple fields

Decision tree models have applications in multiple fields:

Business Analytics: Customer segmentation and precision marketing; grouping customers based on age, spending habits, and other characteristics to develop targeted strategies; also assisting in product pricing by analyzing factors such as cost and market demand to determine the optimal price.

Medical Diagnosis: Assisting doctors in diagnosing diseases step-by-step based on patient symptoms and examination results, improving diagnostic accuracy and efficiency.

Credit Assessment: Assessing loan risk levels based on income, debt, and credit history to decide whether to grant a loan.

The ProcessOn community contains a wealth of decision tree templates and examples for various application scenarios, which you can learn from or use.

Create Charts Online
Decision
Decision tree algorithm

Decision tree algorithms are the mathematical methods and computational steps for constructing decision trees, including feature selection, splitting rules, stopping conditions, and pruning strategies.

Typical decision tree algorithms include ID3, C4.5, and CART (classification and regression trees), each optimizing the tree structure using different metrics (such as information gain and Gini coefficient).

Create Charts Online
Decision

Decision Tree Diagram How to Draw?

Decision Tree DiagramHow to Draw?
1
Create a new flowchart to clarify the problem to be solved or the decision-making goal, and drag a rectangle onto the canvas as the root node of the decision tree.
2
Double-click the shape to add text, and click the "+" on the shape to create branches between nodes.
3
Supplement the decision tree with subsequent decision nodes, chance nodes, terminal nodes, and branch elements.
4
Select a node or branch, and the top toolbar allows you to set text style and connection line style.
5
After creating the decision tree diagram, click the "Export" button to choose to export it as an image or PDF format. You can also set a share link to share with others.
Free to use

Decision Tree Diagram Drawing Guide

  • How to create a decision tree diagram? Tutorials, templates, examples

    How to create a decision tree diagram? Tutorials, templates, examples

    In today's data-driven era, decision tree diagrams, as an intuitive and powerful analytical tool, are gradually becoming a powerful assistant for decision makers in all walks of life. This article will introduce the concept, composition, drawing tutorials , examples , etc. of decision tree diagrams in an easy-to-understand way to help readers master this powerful tool and improve decision-making efficiency and quality.
    Skye
    2024-12-30
    10618
  • A Complete Guide to Product Roadmaps - Concepts, Types, and Tutorials

    A Complete Guide to Product Roadmaps - Concepts, Types, and Tutorials

    The product roadmap is a core tool in product management. It not only helps teams clarify their direction but also allows stakeholders to intuitively understand the product roadmap. This article will systematically explain the secrets of the product roadmap, from basic concepts to practical techniques.
    Skye
    2025-10-16
    2514
  • Beginner's Guide to Technology Roadmaps - Free Templates and Examples

    Beginner's Guide to Technology Roadmaps - Free Templates and Examples

    In today's rapidly changing technology field, technology roadmaps have become an important tool for enterprises or scientific research to formulate technology innovation plans and improve independent innovation capabilities. It can not only help enterprises clarify the direction of technology development, but also ensure that each link is completed on time and achieve the expected goals . This article will provide you with a detailed guide, through 7 key steps, to teach you how to build and draw an efficient technology roadmap, and also come with free templates and success cases .
    Skye
    2025-03-10
    6603
  • What is DFD (Data Flow Diagram)? Symbols, Structure, Tutorials, Examples

    What is DFD (Data Flow Diagram)? Symbols, Structure, Tutorials, Examples

    Data flow diagram (DFD) is a graphical representation method used to depict the flow, storage, processing of data in a system and the interaction between external entities. This article will systematically explain the components, types, application scenarios, drawing tutorials, etc. of data flow diagrams, and share multiple examples, hoping to help you understand data flow diagrams.
    Skye
    2024-11-28
    12515

Decision Tree Diagram Template Recommendations

More Templates

Decision Tree Diagram Frequently asked questions

What data preparation is needed to build a decision tree?

It is necessary to organize features (such as age, income) and target variables (such as whether to purchase), and handle missing or outlier values to ensure data quality.

What types of data are suitable for decision trees?

Decision trees are suitable for handling numerical data (such as age, income) and categorical data (such as gender, occupation).

How to simplify a decision tree with too many nodes causing confusion?

Merge low-frequency or similar branches, focus on key decision points, or split complex subtrees into independent modules.

What is the difference between decision trees and logistic regression, and how to choose?

Decision trees make hierarchical decisions through branching rules, suitable for nonlinear relationships; logistic regression directly outputs probabilities, suitable for linearly separable problems. When data is complex, try decision trees first.

How to increase the readability of a decision tree diagram?

Use visual elements such as colors and shapes to distinguish node types (such as decision, opportunity, result) to enhance readability.

Related Diagrams