Process Type
Graphical expression
Mind Type
Structured expression
Note Type
Efficient expression
Treemap
Bracket Diagram

Default Mode





Sales may seem like a job that relies on "eloquence , " but the top salespeople who ultimately succeed rely not on speaking skills, but on their structured thinking abilities.
Have you ever experienced this? You visit a client, talk for two hours, and then sit back at your desk, your mind a complete mess—what exactly does the client want? Who's in charge? Who should you contact next? How do you move things forward? You have seven or eight clues in your head, but you just can't connect them. At the end of the month, when reviewing performance, you're clearly working yourself to the bone every day, but you can't pinpoint where your time went or why you didn't meet your targets this month.
Where does the problem lie? It lies in the way they "think" and "remember." The difference between top salespeople and average salespeople often isn't who works harder, but who is better at using tools to structure complex information. And charts are the most underestimated "weapon" in sales work.
This article takes a practical approach, outlining six types of charts that sales personnel must master—from customer management and sales processes to performance analysis and competitive strategies—and tells you when to draw them, how to draw them, and what problems they can solve.
Mind mapping is a radial thinking tool that uses a central theme as its core and radiates outwards to form branches. It uses keywords, colors, images, and lines to organize scattered information into a logical and hierarchical knowledge network.
The biggest challenge in sales is not "lack of information," but rather "too much and too scattered information." A decision-making chain for a major B2B client may involve 5-8 people, each with different roles, positions, concerns, and relationships; a complex product may have a dozen selling points, but the client may only truly care about two or three. If you rely entirely on your memory, information will inevitably be lost or confused.
Mind mapping is a salesperson's "second brain"—it helps you structure fragmented information, visualize implicit relationships, and organize complex situations.
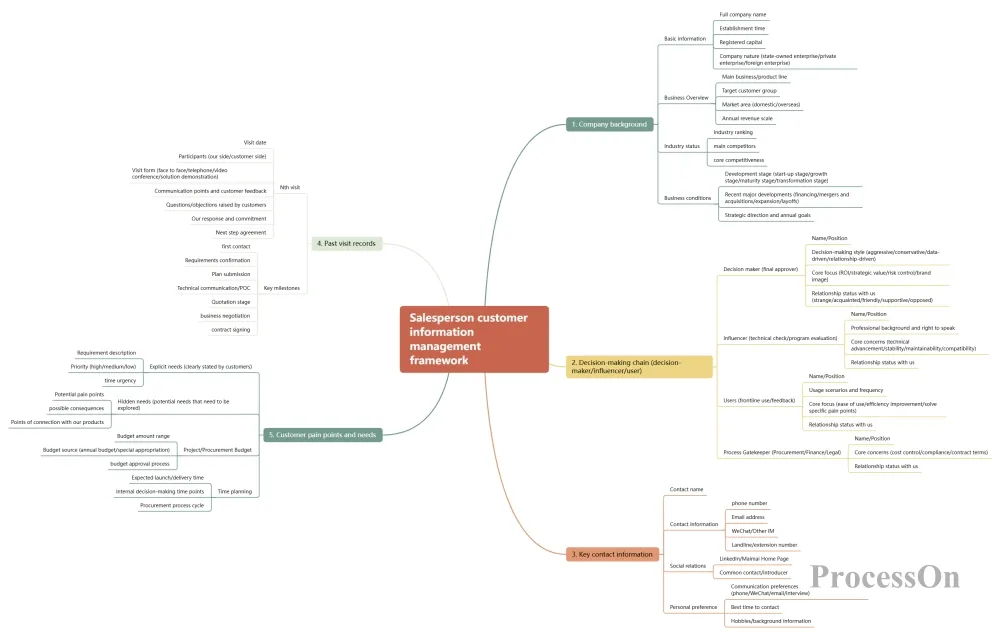
Salesperson Customer Information Management Framework
Customer Information Management: For each customer, create a complete mind map including company background, decision-making chain (decision-makers/influencers/users), key contact information, past visit records, customer pain points, and needs. Review this map before each visit to gain a clear understanding; update it after each visit to solidify knowledge. Establish a management system for converting customer resources into assets, meticulously recording information for each customer, the date and content of each visit.
Product Selling Points Outline: Centered on the product, this outlines key selling points, including functionalities, scenario-based value, competitor comparisons, and customer case studies. When customers raise objections, you can quickly find corresponding solutions within the mind map, rather than searching for them in your head.
Sales strategy development: Starting with the target customer profile, break down customer acquisition channels, outreach methods, sales techniques, follow-up pace, and the sales path. Transform the vague "how to win over this customer" from a vague "feeling" into clear "steps".
Team Management and Training: Sales managers can use mind maps to outline their team management framework—including dimensions such as new employee recruitment and training, the development of goal management tools, the systematization of visit procedures, and work process control. Mind maps make management ideas clear and communicable, significantly improving the efficiency of new employee training.
Starting from the central theme, the first level of branches should be limited to 5-7; too many will cause a loss of focus.
Use keywords instead of long sentences for each branch; keep it concise.
Different colors are used to distinguish different categories (e.g., blue = decision-makers, green = needs, red = risks).
Keep it updated – Spend 5 minutes adding new information after each visit.
A flowchart is a diagram that uses graphic symbols and arrows to show the complete process steps from start to finish. It visualizes complex business processes through standardized symbols (rectangle = operation, diamond = decision, rounded rectangle = start/end, arrow = flow direction).
The biggest problem for many sales teams is that "everyone does sales in their own way." For the same client, salesperson A might close the deal after three visits, while salesperson B might visit eight times and still be stuck in the same place. The reason isn't that B isn't working hard, but rather that he lacks a clear action plan of "what to do next."
The flowchart transforms "the experience of excellent salespeople" into "replicable standard procedures"—newcomers can follow it without going astray, and experienced salespeople can find areas for improvement by referring to it.
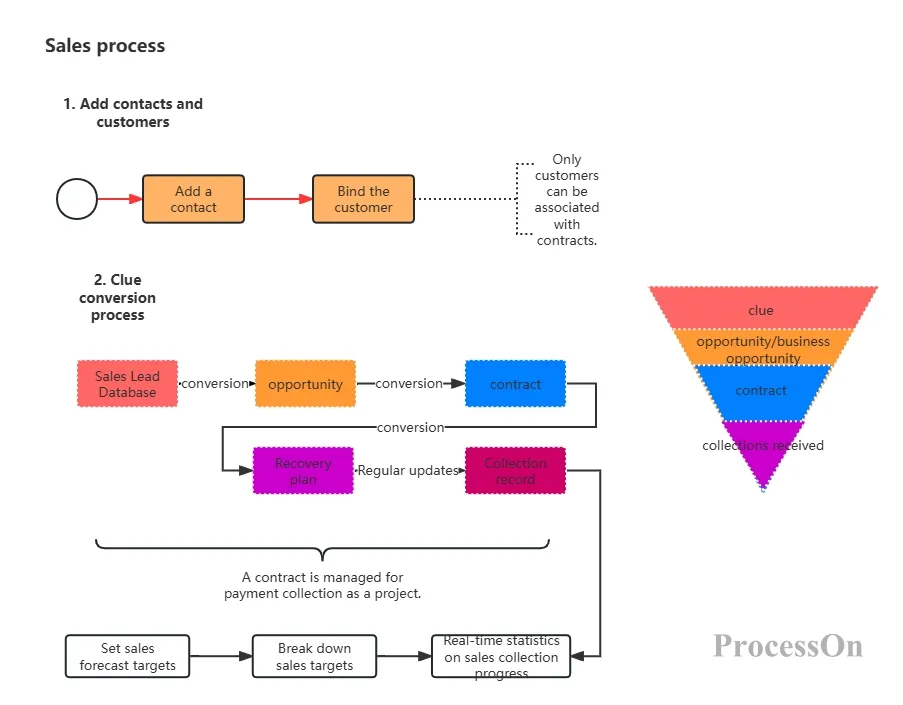
Customer visit process: From phone appointment → initial visit → needs assessment → solution demonstration → objection handling → closing the deal → after-sales service, each step—what to do, what to say, and what to ask—is documented in a flowchart. The initial visit sets the hook for a future meeting, and the phone visit sets the communication direction—these key points are clearly marked in the flowchart, ensuring no salesperson misses anything.
B2B Key Account Sales Process: B2B business is far more complex than C-end sales, involving more than a dozen steps, including lead generation, demand matching, technical Q&A, POC testing, solution quotation, business negotiation, contract signing, invoicing and payment collection. Swimlane flowcharts can be used to divide the process into roles (sales representative, pre-sales technical, business finance, and customer side), making the responsibilities and collaboration nodes of each role clear at a glance.
CRM system operation process: lead entry → opportunity follow-up → contract approval → payment follow-up. Use flowcharts to standardize CRM operation nodes and ensure consistent data entry standards.
Use standard symbols (rectangle = operation, diamond = decision) to ensure that everyone on the team can understand it.
Each decision node must have a clear yes/no branch to avoid judgments based on intuition.
Use swimlane diagrams to divide areas into zones based on roles when multiple roles are involved in collaboration.
Flowcharts are "living documents"—as the process is optimized, the flowcharts should also be updated accordingly.
A funnel chart uses centered bars to display the number of participants in each stage of a process, arranged in chronological order. It visually shows the conversion rate of each stage relative to the previous stage and the overall conversion rate. The funnel shape naturally reflects the sales reality that "fewer people join as you go further."
Sales is a typical "conversion" process—100 leads → 30 potential customers → 10 customers making offers → 3 closing customers. Without a funnel chart, you only know "3 sales were closed this month," but you don't know "where the problem lies"—is it poor lead quality? Or a problem with the conversion rate from leads? Or too many lost sales in the offer stage?
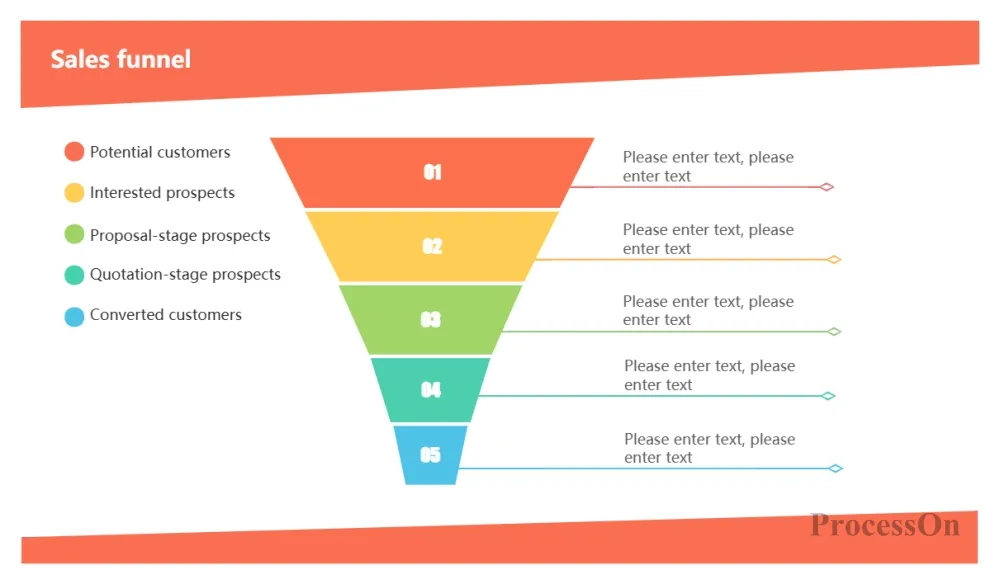
A funnel chart is like a "health check report" for sales performance. It helps you pinpoint bottlenecks and tells you which stage you should focus your efforts on.
Sales lead conversion analysis: Establish a complete funnel from "potential customer → interested customer → solution customer → quotation customer → closing customer". Update data weekly; any sudden drop in conversion rate at any stage indicates a problem requiring immediate intervention.
Opportunity Stage Management: In CRM, opportunities are divided into several stages (such as initial contact, needs confirmation, solution quotation, business negotiation, and contract signing and delivery), and a funnel chart is used to display the number of opportunities and estimated revenue at each stage. Sales managers can see at a glance "which stage is the most crowded with opportunities" and "which stage has the worst quality opportunities".
The number of stages in the funnel should be controlled to 4-6; too many will cause the focus to be lost.
The number of samples and conversion rates should be labeled at each stage, and the data must be accurate and quantifiable.
Regular (weekly/monthly) updates to track trends.
The value of a funnel chart lies in "identifying problems," not "displaying data"—once a problem is identified, immediate action should be taken.
SWOT analysis is a strategic analysis tool that systematically assesses oneself and the competitive environment through four dimensions: Strengths, Weaknesses, Opportunities, and Threats. It is typically presented in the form of a four-quadrant matrix.
SWOT analysis forces you to think systematically: where does our product excel, where are its weaknesses, where are the market opportunities, and where are the threats from competitors? Only after figuring these things out will you know how to fight this battle.
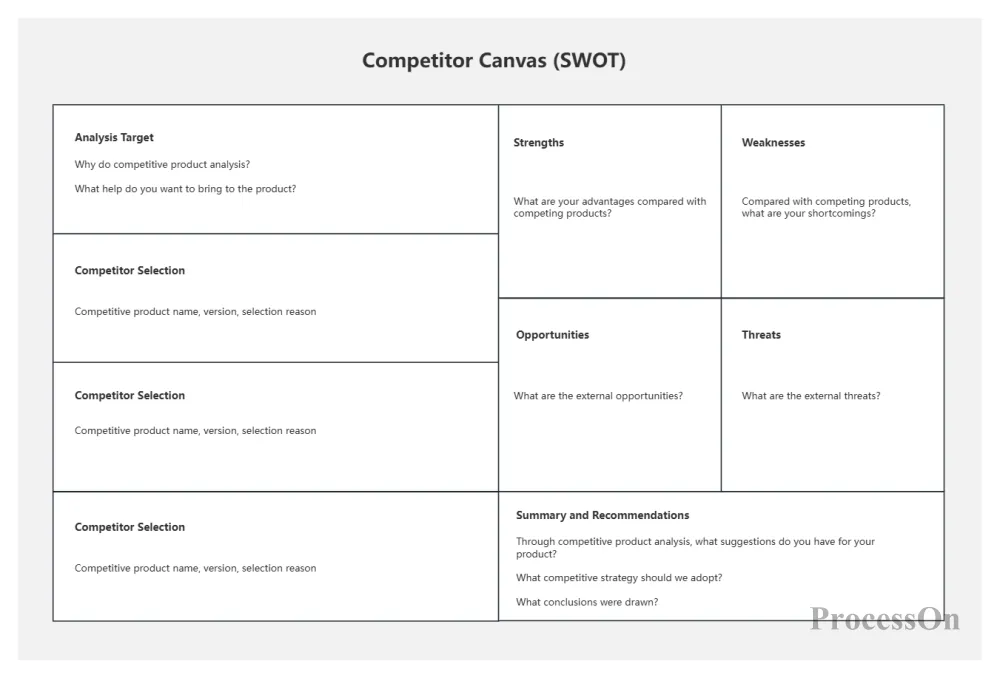
Competitive Analysis - SWOT Analysis
Competitive Analysis: Before tackling a key client, use a SWOT analysis to list our strengths and weaknesses compared to our competitors. How can we amplify our strengths? How can we mitigate or transform our weaknesses? How can we seize opportunities? How can we address threats? One diagram helps you clarify the entire competitive landscape.
Key Account Acquisition Strategy: For a specific key account, conduct a customized SWOT analysis—What are the advantages of our solution in this client's scenario? What are the risks? What opportunities do the client's industry trends present for us? What threats do competitors' deployments within the client's ecosystem pose?
Maintain a balance across the four quadrants; don't just list the strengths and ignore the weaknesses.
List 3-5 key points for each quadrant; avoid piling them up.
Advantages must be "verifiable" (based on data and case studies), not just "my opinion."
After completing the SWOT analysis, it needs to be translated into a "strategy"—how to utilize strengths, how to address weaknesses, how to seize opportunities, and how to defend against threats.
A Gantt chart is a type of bar chart where the horizontal axis represents time, the vertical axis represents tasks, and the length of the bars represents the time spent on each task. It visually displays the time schedule, progress, and dependencies of project tasks.
B2B sales is essentially a "project management" task—from initial contact to final closing, the cycle can last 3-6 months, involving multiple tasks, roles, and timelines. Without timeline management, it's easy to end up in awkward situations like "still working on a proposal when it's time to quote" or "forgetting to contact them when it's time to follow up."
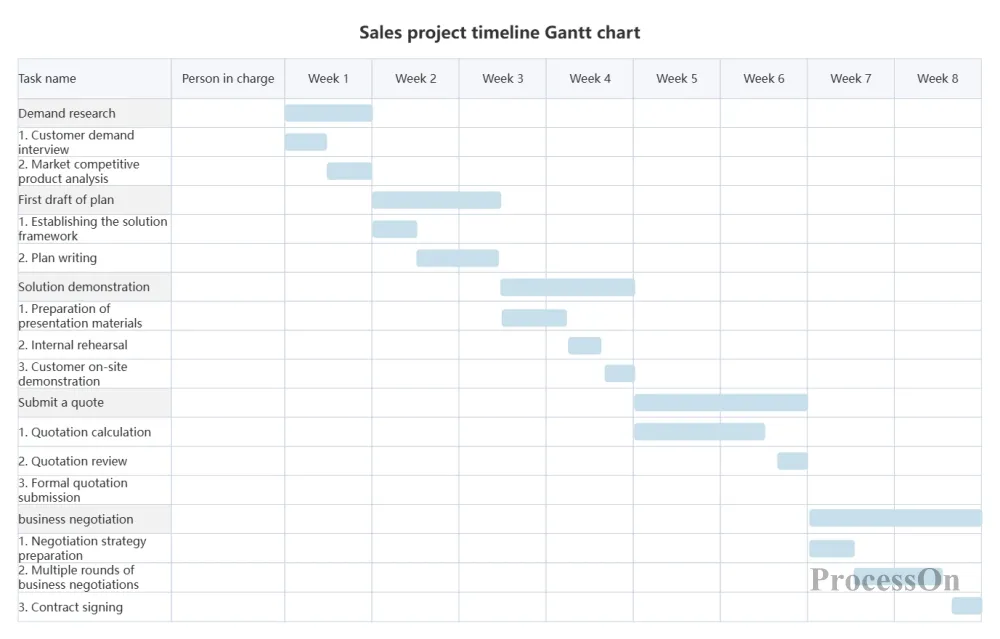
Sales Project Timeline Gantt Chart
Gantt charts visualize the entire lifecycle of a sales project, making the timeline and dependencies of each task clear at a glance.
Key account follow-up schedule: Create a Gantt chart to track the progress of each key account – Week 1: Complete needs assessment; Week 2: Complete initial draft of the solution; Week 3: Demonstrate the solution; Week 4: Submit a quote; Week 5: Business negotiations… Each task is clearly marked with a responsible person and a deadline. Sales staff understand the pace, and the team and managers can also see the progress.
Sales project milestone management: Set key milestones on a Gantt chart—such as "First Visit Completed," "Requirements Confirmed," "Proposal Submission," "Quote Approval," and "Contract Signing." Each milestone serves as a "checkpoint" to ensure the project stays on track.
Team sales rhythm control: Sales managers can use Gantt charts to manage the sales rhythm of the entire team—who needs to sprint at the end of the month, who needs to be intervened and supported in advance, and whose business opportunities may be delayed and require early warning.
The task breakdown granularity should be moderate—too coarse and it loses its guiding significance, too fine and the maintenance cost is high ;
Mark task dependencies (e.g., "Solution Demonstration" depends on "Solution Completion") ;
Allow for a buffer period, as sales projects have more variables than technical projects .
The five chart types above cover the entire sales process, from customer management and process standardization to performance analysis and competitive strategy. However, knowing "what to draw" is only the first step; the tools used to draw it are equally crucial.
ProcessOn, a professional online charting and collaboration platform, provides sales personnel with a one-stop charting solution:
A rich library of sales templates: The ProcessOn template community offers a variety of sales scenario templates, including B2B large customer sales process management diagrams, sales process flowcharts, and sales business management mind maps. These can be cloned with a single click and used immediately, eliminating the need to start from scratch.
Full coverage of multiple chart types: Mind maps, flowcharts (including swimlane diagrams), funnel charts, SWOT analysis charts, Gantt charts—ProcessOn supports all chart types needed for sales.
Team Collaboration: The sales team can collaboratively maintain customer information mind maps, sales process flowcharts, and project Gantt charts, with information synchronized in real time, eliminating the problem of "each team creating their own maps and version conflicts."
Access anytime, anywhere: Cloud storage allows you to view and edit on your computer, mobile phone, or tablet—before visiting a client, simply take out your phone to glance at their mind map and have a clear understanding before knocking on their door.
Q1: What charts must salespeople master?
A: Based on the core scenarios of sales work, it is recommended to prioritize mastering five types of charts: mind maps (customer information management and strategy streamlining), flowcharts (sales process standardization), funnel charts (performance analysis and bottleneck identification), SWOT analysis charts (competitive strategy formulation), and Gantt charts (major client project follow-up and scheduling). These five charts cover the complete chain from "managing customers" to "managing processes" to "managing performance."
Q2: What problems do mind maps and flowcharts solve in sales?
A: Mind maps solve the problem of "scattered information"—customer information, product selling points, and sales strategies are organized and structured using mind maps, allowing you to see everything at a glance. Flowcharts solve the problem of "non-standard actions"—customer visits, objection handling, and follow-up with major B2B clients are standardized using flowcharts, making them replicable for everyone. Simply put: Mind maps help you "think clearly," and flowcharts help you "standardize."
Q3: How to make a funnel chart effective?
A: The key to a funnel chart isn't "looking good," but "accurate data and regular tracking." Recommendations: ① The stage divisions should align with your actual sales process (don't copy others); ② The data for each stage must be accurate and verifiable (don't fill in based on intuition); ③ Update weekly/monthly to compare trends; ④ If you notice an abnormal drop in conversion rate at a particular stage, immediately analyze the reasons and take action.
Q4: Is SWOT analysis really useful in sales?
A: It's useful, but only if you translate it into action afterward. The correct approach is: after completing the SWOT analysis, answer the following questions for each of the four quadrants: How can we amplify our strengths in front of the client? How can we mitigate or transform our weaknesses? How can we seize opportunities? How can we proactively address threats? Transform your answers into concrete statements, plans, and action lists.
Q5 : Can I use the sales templates from ProcessOn directly?
A: Yes. All templates in the ProcessOn template community support "one-click cloning," after which all graphics, text, and lines can be freely edited and modified. You can adjust the content according to your company's products, customers, and sales processes , and generate a professional enterprise-level sales chart in just a few minutes.
Q6 : What if I can't draw? Is there a quick way to learn?
A: Three methods: ① Use templates – ProcessOn template community has a large number of ready-made templates for sales scenarios; find a suitable one and clone and modify it directly; ② Hand-draw first, then digitize – draw a draft on paper, confirm the structure, and then digitize it using tools; ③ From simple to complex – draw the simplest version first (such as a mind map that only lists customer names and roles), and gradually add details after you start using it. The value of a chart lies in "being able to use it," not in "drawing it perfectly."