Process Type
Graphical expression
Mind Type
Structured expression
Note Type
Efficient expression
Treemap
Bracket Diagram
Default Mode
As a product manager, competitive analysis is an unavoidable daily task. However, many people, when conducting competitive analysis, either turn it into a list of features or get bogged down in subjective feelings, ultimately producing a bunch of inconclusive materials that are of no help in decision-making.
Today, we'll discuss how product managers can create truly useful competitive analyses. The core idea is to use a structured framework to collect information and visual charts to present conclusions. The goal is to ensure the analysis results are not only understandable to the product manager but also readily accessible to the team.
Before conducting competitive analysis, ask yourself this question: What is the purpose of this analysis?
Different objectives lead to completely different focuses and depths of analysis:
To secure project approval, the following key analyses are required: market structure, core strengths and weaknesses of leading competitors, user pain points, and opportunities for differentiation .
For feature iteration: focus on analyzing a specific feature module, interaction details, and user feedback of competitors .
For pricing strategy: focus on analyzing competitors' pricing systems, charging models, and users' willingness to pay .
To seize market share: focus on analyzing competitors' channel layout, marketing strategies, and user growth methods .
After clarifying the objectives, determine the scope of competitors to be analyzed. Competitors are typically divided into three categories:
Direct competitors: Same target users, similar core functions .
Indirect competitors: Target users are similar, but they solve the needs in different ways (e.g., gyms vs. fitness apps).
Potential competitors: Currently not in the same market segment, but may cross over into other sectors .
It's not recommended to analyze too many competitors at once. If the goal is feature iteration, focusing on 2-3 direct competitors is sufficient. If the aim is to assess the market landscape, you can expand to around 5.
The quality of competitive analysis depends on the accuracy and comprehensiveness of the information. Information can be obtained from the following sources:
Public channels: official website, App Store review section, official documentation, blog, media interviews
Data sources: Qimai Data, SimilarWeb, App Annie
User channels: user interviews, questionnaires, social media discussions, Q&A websites
Personal experience: I personally registered and used the service, recording my feelings and discoveries at each step.
Special reminder: When conducting functional analysis, it's best to use every single feature of the competitor's product, take screenshots, and record the operation path and key nodes. These materials will be extremely useful when creating diagrams later.
Competitive analysis without a framework easily degenerates into a disorganized, rambling account. The following four dimensions are the most commonly used analytical frameworks:
Analyze your competitors' target users, core scenarios, and pain points they solve. You can deduce this by looking at their official website promotional materials, App Store descriptions, and user reviews.
Break down functions into "core functions" and "auxiliary functions," and compare the performance of competitors on the critical path. For example, the core path of an e-commerce app is "search - product details - add to cart - place order - payment," and you can compare the differences in experience at each step.
Analyze how competitors monetize: membership subscriptions, advertising, transaction commissions, value-added services? What are their pricing strategies? How are the benefits divided between the free and paid versions?
Analyze competitors' user growth strategies: Do they have viral marketing campaigns? How do they conduct content operations? On which platforms do they focus their channel advertising?
This is the most crucial step in competitive analysis. No matter how much information is gathered, if it's not presented visually, the team will struggle to reach a consensus. The following five types of charts are among the most frequently used tools in competitive analysis.
Applicable scenario: Quickly compare the differences in core functions among multiple competing products.
Plotting method: List competitor names on the horizontal axis and feature points on the vertical axis, using symbols such as " √/X " to indicate presence or absence. You can also add a weighted row to indicate the importance of each feature to the user.
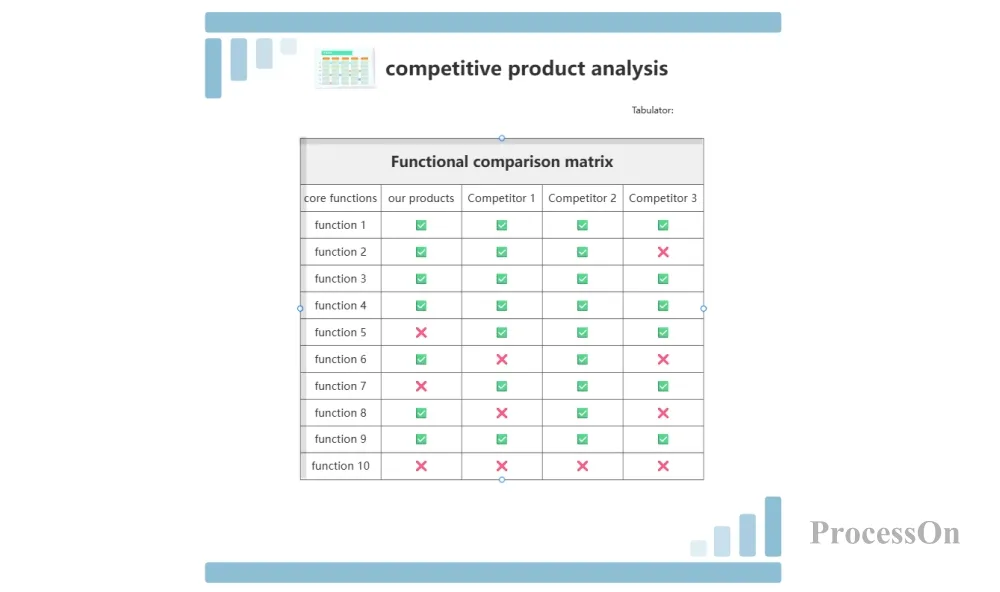
Competitive Feature Comparison
Applicable scenarios: To intuitively demonstrate the comprehensive strength of competitors across multiple dimensions.
Drawing method: First, determine the evaluation dimensions (such as feature richness, ease of use, cost performance, stability, and design aesthetics), score each competitor on different dimensions (1-5 points), and then connect the data points to form a closed graph.
Advantage: A single image can reveal who is a "well-rounded player" and who is a specialist in only one area.
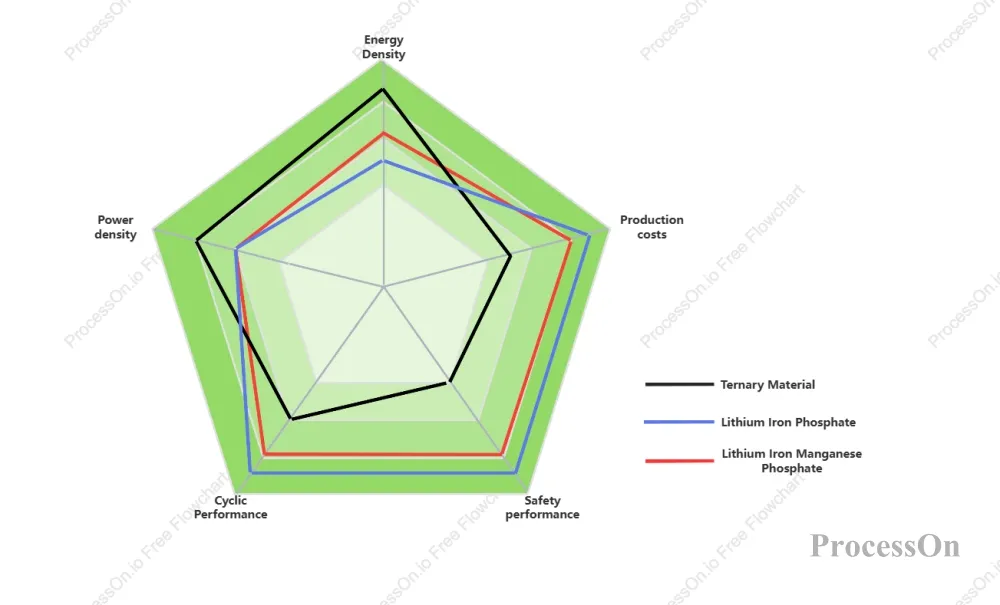
Radar chart of product characteristics (cathode material)
Applicable scenario: In-depth comparison of the differences in user experience across the critical user path between competing products.
Mapping Method: Taking an e-commerce app as an example, the entire user journey from opening the app to placing an order is broken down into steps such as "searching for products - browsing products - comparing products - purchasing - receiving goods - after-sales service ". This allows for the creation of user journey maps for competitors and our own products, followed by a comparison of the differences between our performance and that of competitors (e.g., "Competitor A offers coupon recommendations on the checkout page, which we lack").
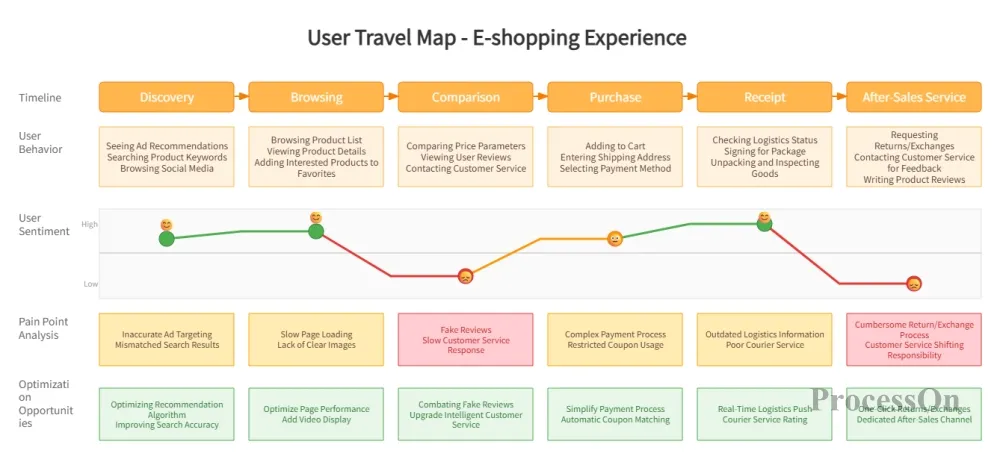
User Journey Map - E-commerce Shopping
Applicable scenario: To comprehensively assess the relative position of our product and competitors, and to formulate corresponding strategies.
Drawing method: Divide the canvas into four quadrants:
Top left (S Advantage): Where are we stronger than our competitors?
Top right (W Weaknesses): Areas where we lag behind our competitors
Bottom left (O Opportunity): Opportunities arising from the external environment
Bottom right (T threat): Potential threats from competitors
The conclusions of SWOT analysis can directly guide product planning: leverage strengths to seize opportunities, leverage strengths to defend against threats, improve weaknesses to seize opportunities, and improve weaknesses to avoid threats.
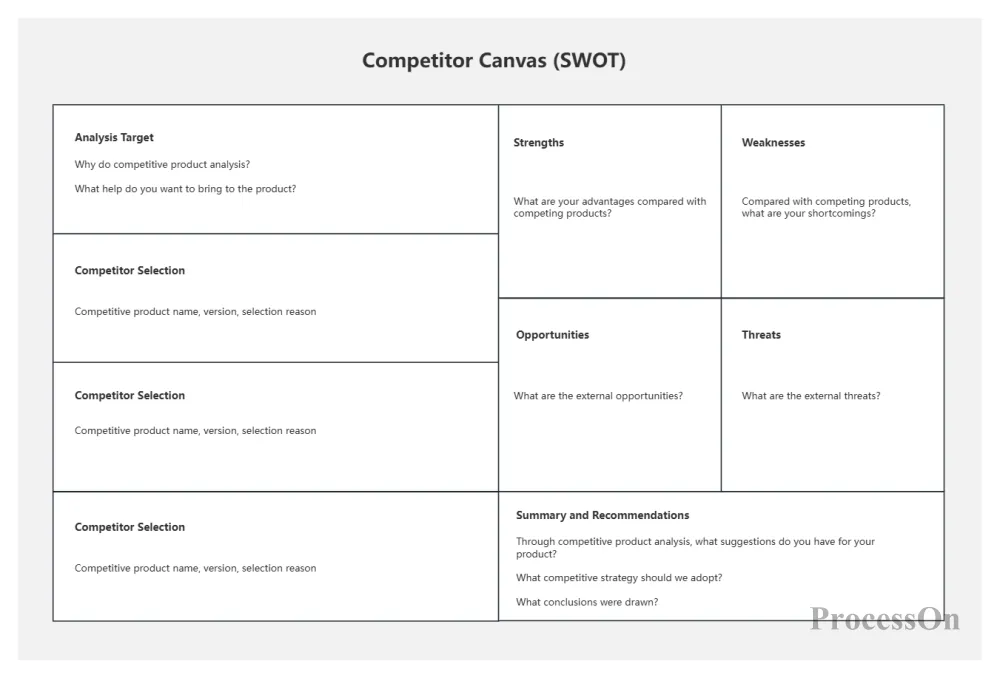
Competitive Analysis - SWOT Analysis
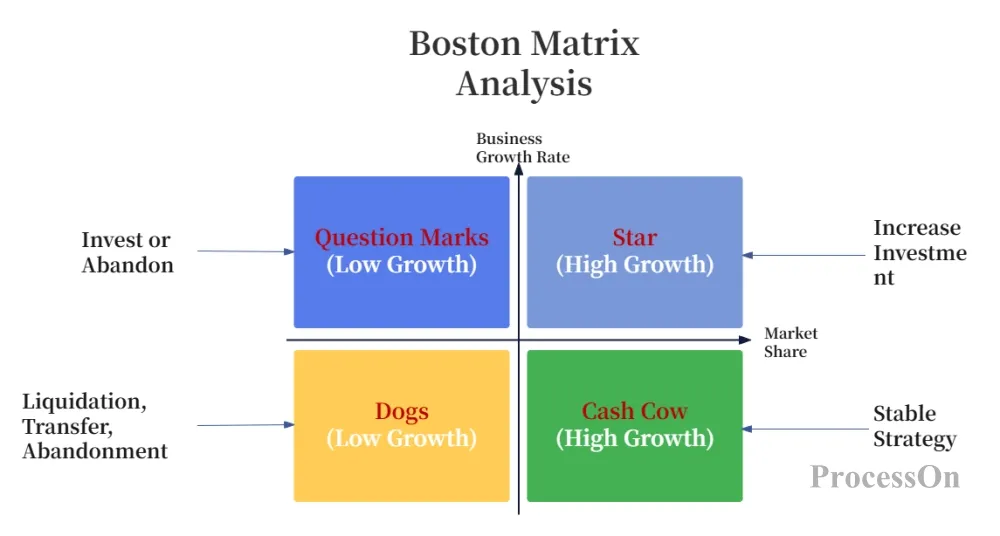
Applicable scenario: Evaluating the priority of product features or business lines.
Plotting method: The horizontal axis represents "market growth rate" (or user demand intensity), and the vertical axis represents " business growth rate " (or our competitive advantage). Place features, products, or competitors into the four quadrants:
Star performers: High growth, high market share → Increased investment
Taurus: Low growth, high market share → Maintain and reap the rewards
Problem: High growth, low market share → Selective investment
Dogs: Low growth, low market share → Consider abandoning them
Charts are a means, conclusions are the end. An excellent competitive analysis report should clearly answer the following questions at the end:
What did our competitors do right? What can we learn from them?
What are the weaknesses of our competitors? Is there an opportunity for us to overtake them?
What are our differentiation opportunities? How can we avoid homogeneous competition?
What should we prioritize in the next three months?
It is recommended to summarize the core conclusions in one sentence, and then list the action list in terms of "short-term (1 month), medium-term (3 months), and long-term (6 months)".
In ProcessOn , we've prepared a competitive analysis template library for product managers. From feature comparison matrices and radar charts to SWOT analyses and four-quadrant diagrams , you can create them with a single click, collaborate with multiple people, and update them anytime. No more switching back and forth between Excel and PowerPoint; make your competitive analysis both in-depth and visually appealing.