Process Type
Graphical expression
Mind Type
Structured expression
Note Type
Efficient expression
Treemap
Bracket Diagram
Default Mode


Mind mapping is a particularly effective graphical thinking tool for expressing divergent thinking. By using mind mapping methods, tasks can be completed with fewer errors, and it also helps to transform the main concepts of any project into visual form. For professionals in the workplace who require logical organization, mind maps are a very useful tool.

ProcessOn - One Stop Drawing Tool
There are eight common forms of mind maps, including circle diagrams, tree diagrams, bubble diagrams, double bubble diagrams, bracket diagrams, bridge diagrams, flowcharts, and complex flowcharts. Today, the editor will explain to you the 8 common forms of mind maps.
1. Circle diagram - Lenovo
The circle diagram is the most commonly used form of mind mapping, typically used to define and describe a central theme, unfolding related details and associations through circles surrounding the central theme. For example, when it comes to fruits, people tend to associate them with apples, pears, bananas, and other fruits. When it comes to traveling, people tend to think of essential items such as ID cards, spare medicine, and toiletries. When it comes to what is in the zoo, a circle diagram can also be used to express it, including animals, plants, blue skies, air, rivers, and so on.
The circle diagram is the most commonly used form of mind mapping, typically used to define and describe a central theme, unfolding related details and associations through circles surrounding the central theme.
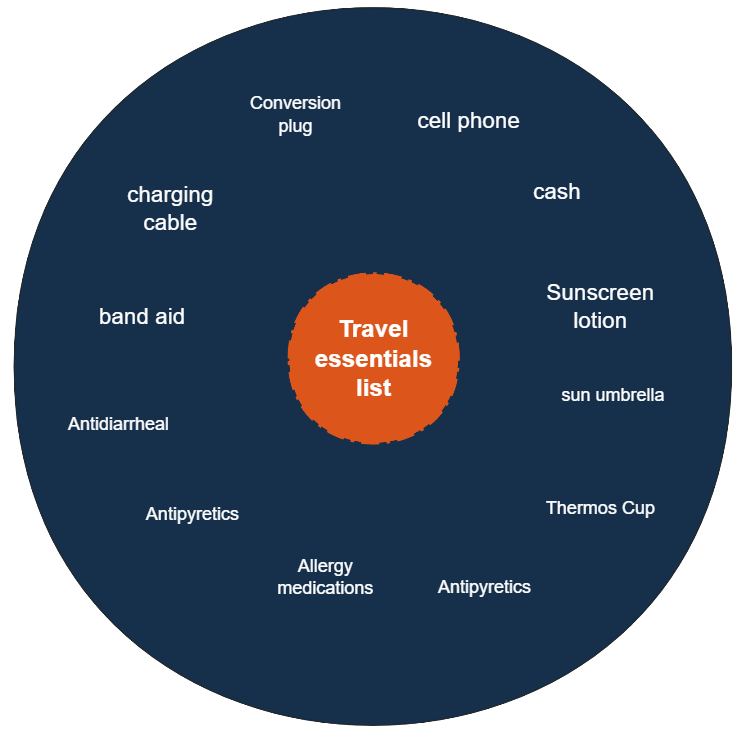
Travel Essentials Checklist Circle Chart
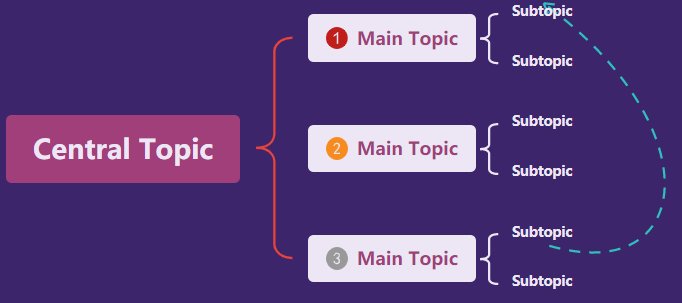
2. Tree Chart - Classification
A tree diagram, also known as a tree diagram or hierarchical structure diagram, is a graphical tool that visually displays data classification, organizational relationships, and hierarchical structures. It has wide applications in many fields such as computer science, biology, information management, enterprise architecture, and education. In a tree diagram, each node represents an entity or concept, and nodes are connected by line segments (called edges) to form parent-child or hierarchical relationships. The root node is usually located at the top, representing the highest level of classification or overall concept, while the branches extending downwards from the root node represent sub categories or subordinate elements that are refined layer by layer.
A tree diagram is like a tree, with the trunk as the main component and branches and branches branching off from it. It uses the total score of knowledge for grouping and classification, helping us classify things and find commonalities and characteristics between them. It is used to group or classify things, suitable for representing hierarchical relationships, improving thinking efficiency and memory. This structure makes the information organized, easy to understand and remember.
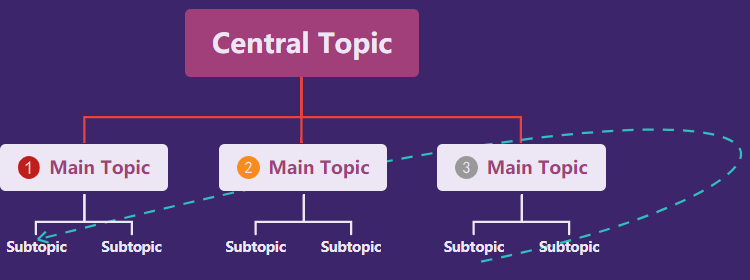
Trendy PurpleOrg Chart Style Template
3. Bubble Chart - Description
A bubble chart is composed of multiple bubble shaped circles, with each theme represented as a bubble, and the relationships between bubbles represented by lines or curves. It is a mind map form centered around the theme and extending outward with bubbles. Bubble charts tend to use adjectives to describe any phenomenon, used to help develop and organize ideas. In addition, bubble charts can help you focus your thoughts and guide your creativity to define specific themes. The logic is simple, and everything can diverge, making it suitable for exercising divergent thinking.
A bubble chart is a mind map form composed of multiple bubble shaped circles, with the theme as the center and extending bubbles outward. Bubble charts tend to use adjectives to describe any phenomenon, used to help develop and organize ideas.
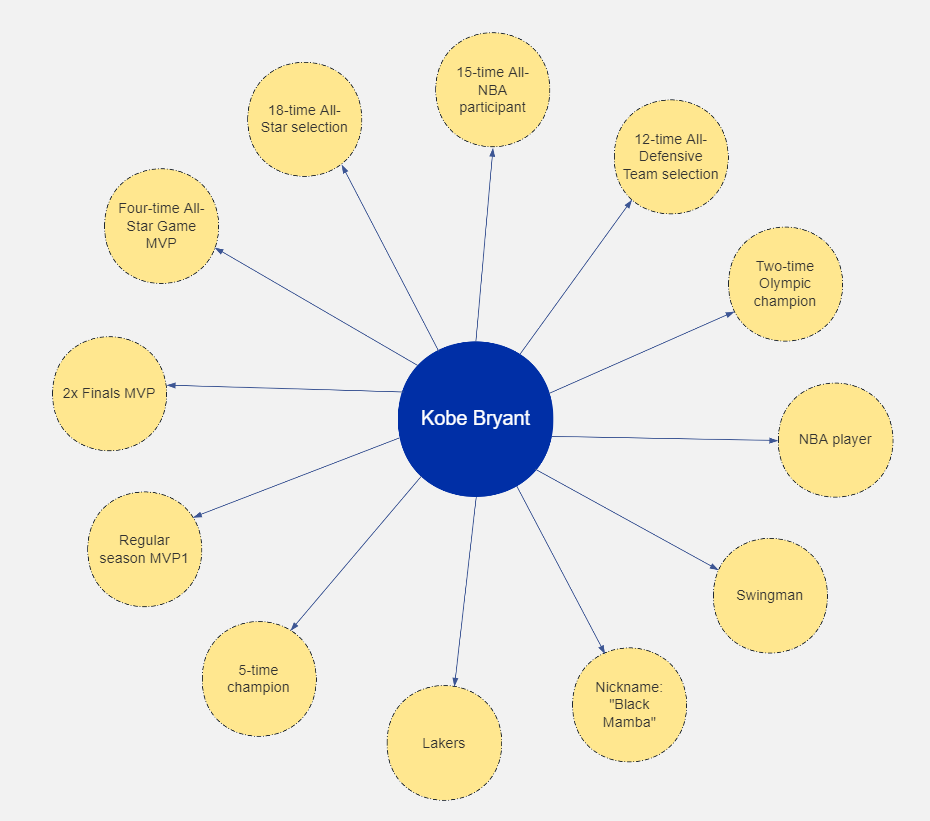
Kobe Bryant honorary introduction bubble chart
4. Double Bubble Chart - Comparison
Double bubble chart, which is a variant of bubble chart, has two central themes, with the connecting part representing their common characteristics and the rest representing their differences. Mainly used to describe the similarities and differences between two central keywords, and to compare the similarities and differences between two things. Although its image composition is very similar to a bubble chart, there are significant differences in its function and usage scenarios. We can use a double bubble chart to compare new and old knowledge points and help ourselves establish a knowledge system.
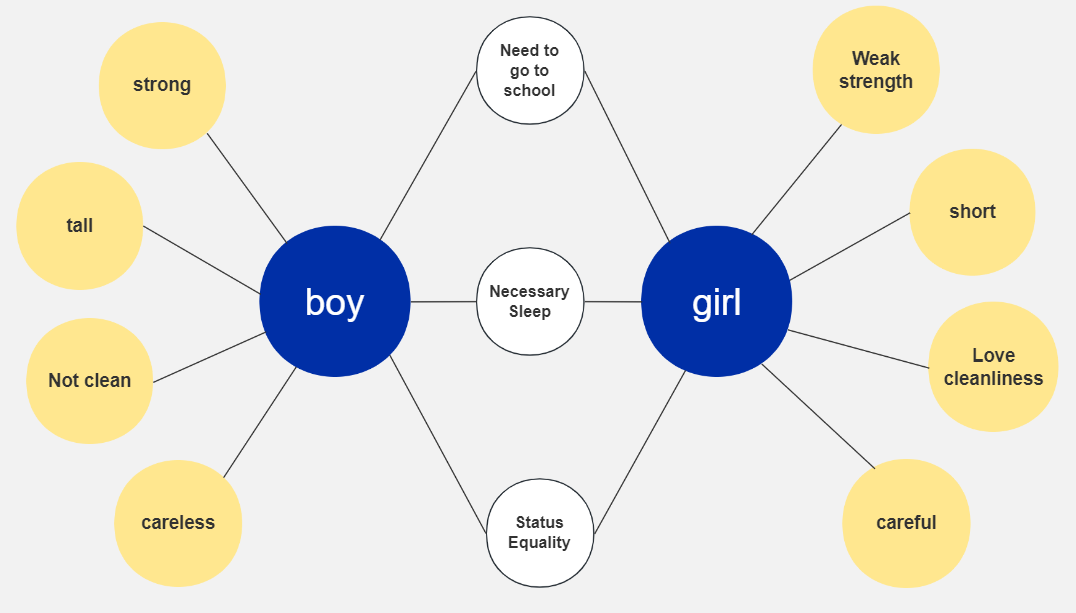
Boys and girls comparison double bubble chart
5. Parenthesized Diagram - Splitting
The bracket diagram is composed of many brackets of different sizes, starting from the object, using brackets to distinguish the whole from the part. Usually used to display multiple factors or aspects that support or support a theme, grouping information through curly braces.
The bracket diagram uses parentheses to represent the relationship between the whole and the parts. It is commonly used to show the components of things, establish a sense of space, and also to display the inclusion relationship of knowledge and analyze the structure of knowledge. Overall, bracket diagrams, as a simple, intuitive, and easy to understand way of expressing data, can be applied in various fields such as business analysis, academic research, market research, and more. The main function of bracket diagrams is to help people better understand and analyze data, and support decision-making and action.
Trendy PurpleBrace Map Style Template
6. Bridge Diagram - Analogy
Bridge diagrams connect two related concepts or ideas, emphasizing their connections and transformations, and helping users find similarities and connections between objects through comparison. This is a diagram primarily used for analogies and analogies. Write a set of related things above and below the horizontal line in the bridge shape, and then list more similar related things according to this correlation. Bridge diagram is mainly used to describe the conceptual relationship between two unfamiliar things through the known relationship between two things or concepts. By analogizing known concepts with very unfamiliar ones, things can be better understood, mainly through analogy and metaphor.
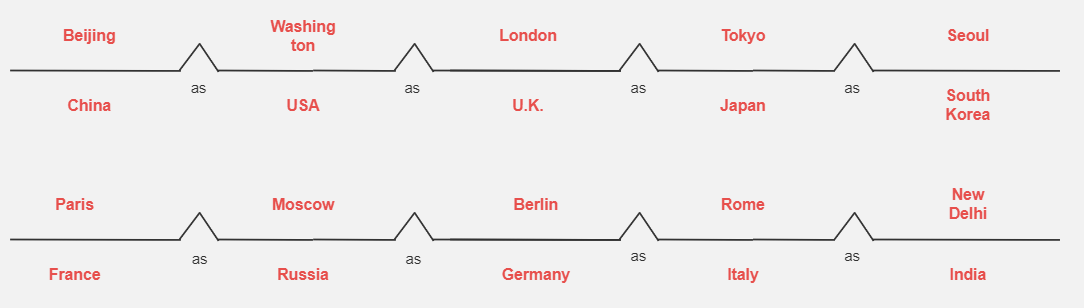
Bridge-shaped map of the world's major capitals
7. Flowchart - Sequence
Flowchart, write down each step in the canvas, connect the large boxes with arrows until the task is completed. Mainly used to list the sequence, time process, steps, etc., it can analyze the relationship between the development process of an event and explain the order in which the event occurs. A flowchart mainly displays the evolution of things, illustrates the sequence and process of events, and can be used to analyze the internal logic of things through its continuity. It can also be used to cultivate procedural thinking and overall planning ability.
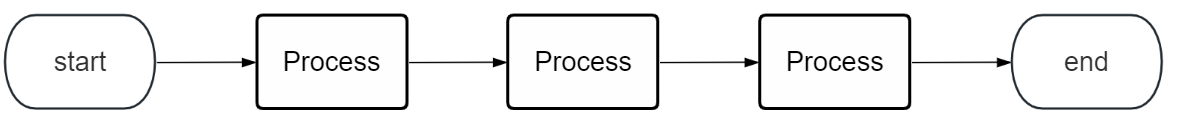
Commonly used sequential flow charts
8. Compound flowchart - causality
A complex flowchart, also known as a causal relationship diagram. The box at the center of the complex flowchart represents an important event, with multiple causes on the left and the results caused by the event on the right. Complex situations involving multiple processes and dimensions, suitable for analyzing and presenting multiple parallel or intersecting processes.
A multiple process diagram is a causal thinking approach used to clarify the causes and effects of event development, and to determine the reasons and impacts of an event. It is often applicable to complex processes or situations where multiple branching events occur.
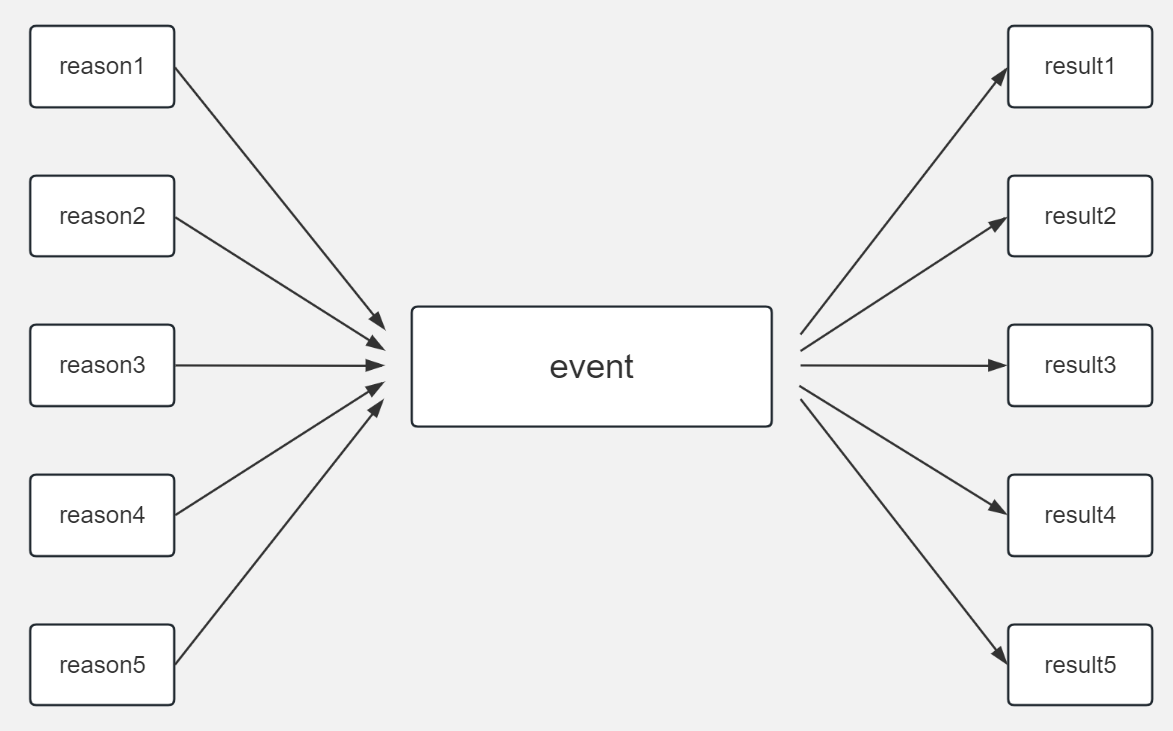
Cause and Effect Diagram Style Template
-------------------------------------------Segmentation-------------------------------------------
The above are the 8 most common forms of mind maps, and there are also two other types of mind maps that are often used in daily learning, work, and life. They are also recommended for everyone.
Fishbone Diagram - Analysis
The fishbone analysis method, also known as the causal analysis method, was developed by Japanese management master Mr. Ishikawa. As the name suggests, the fishbone diagram resembles the skeleton of a fish, with thick lines connecting the head and tail like vertebrae. Fill the fish tail with reasons or strategies, the fish head represents the goal, and the spine is all the steps and influencing factors in the process of achieving it. When you think of a factor, use a fishbone to express it, and mark all the relevant items that can be thought of with different fishbones. Afterwards, refine the root system for each factor and use fishbone branches to represent each main functional element. After repeated deliberation, a fishbone diagram has a general framework. This makes it clear which are the causes of the problem, how to face and solve it, and what resources need to be mobilized.
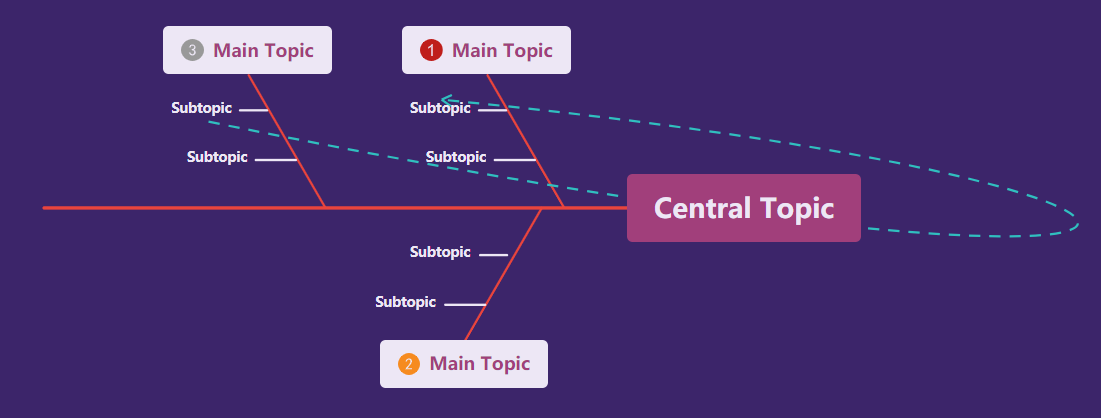
Trendy PurpleFishbone Style Template
Timeline - Series
A timeline, also known as a timeline, is based on chronological order, marking important events or milestones from the past on the axis and providing explanations. Through the timeline view, the team can clearly understand the overall progress, milestones, and task allocation of the project. Team members can allocate tasks and arrange work according to the time nodes in the timeline view to ensure that the project is completed on time.
For example, suppose a software development company is developing a new project, and the team uses the timeline view feature in mind mapping software to clearly display the work tasks and deadlines of each stage of the project on the timeline. Team members can adjust their work focus in a timely manner based on the time nodes in the timeline view, collaborate and ensure that the project proceeds as planned.
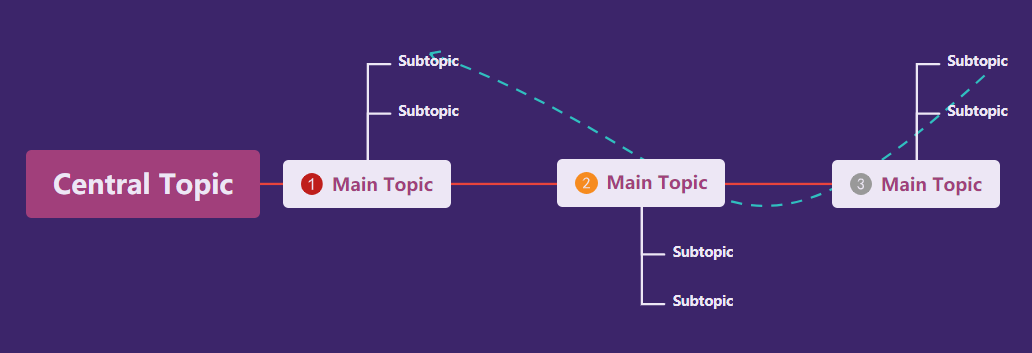
Trendy PurpleTimeline Style Template
The above are the most common forms of mind maps. Friends in need can open ProcessOn mind maps to experience them.