Process Type
Graphical expression
Mind Type
Structured expression
Note Type
Efficient expression
Treemap
Bracket Diagram
Default Mode


Mind maps, also known as brain maps, mental maps, use both pictures and text to express the relationship between things, understand the relationship between events and establish memory links, and develop the unlimited potential of the brain. Today, I will introduce the 6 most commonly used mind maps: bubble map, bracket map, bridge map, tree map, basic flow chart, and timeline (time axis) .
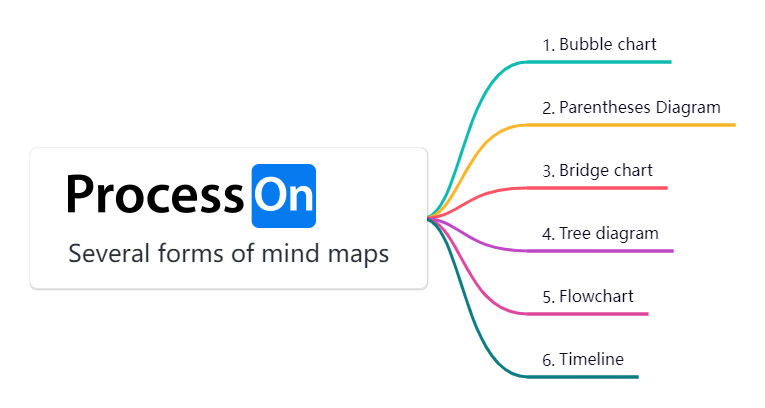
6 common forms of mind mapping
Bubble charts are used to expand topics, descriptions, and associative details. Generally speaking, bubble charts are composed of two or more circles. The middle circle is the central topic, and the outer circles are branch topics.
There are many forms of bubble charts, including single bubble charts, double bubble charts, data bubble charts and other types. They are suitable for a variety of scenarios, such as teaching, reinforcing concepts, deepening understanding, describing activity concepts, etc.
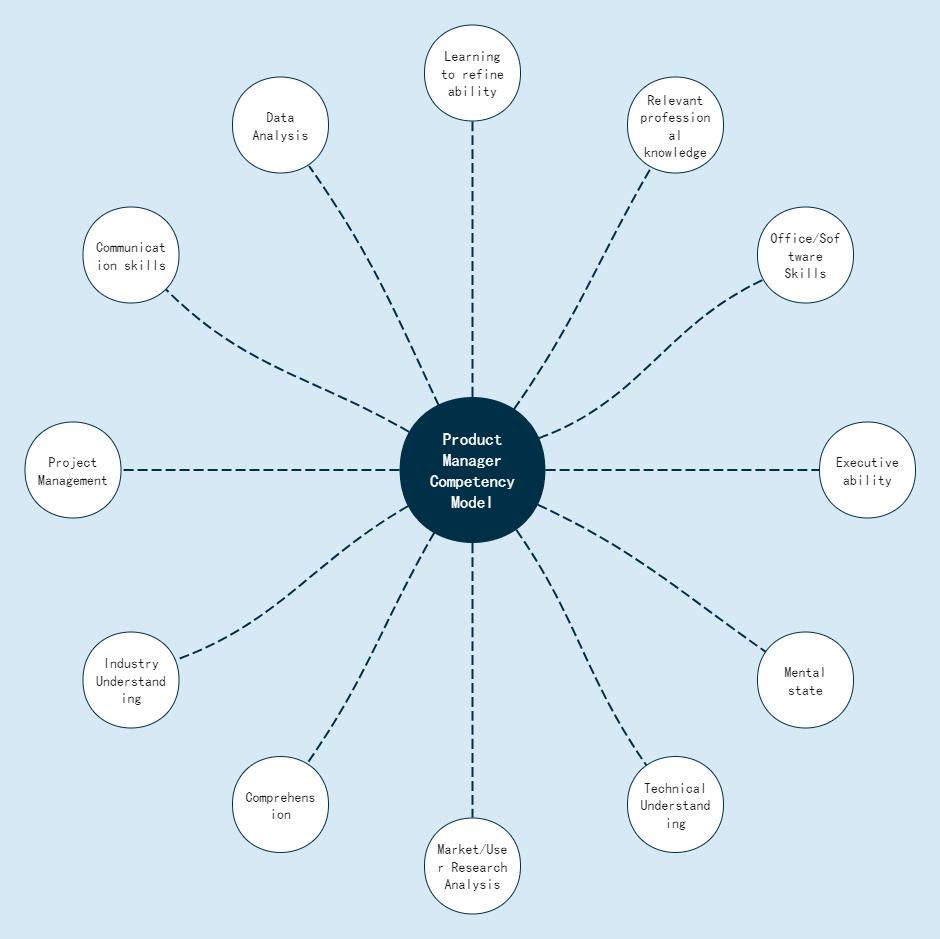
Product Manager Competency Model Bubble Chart
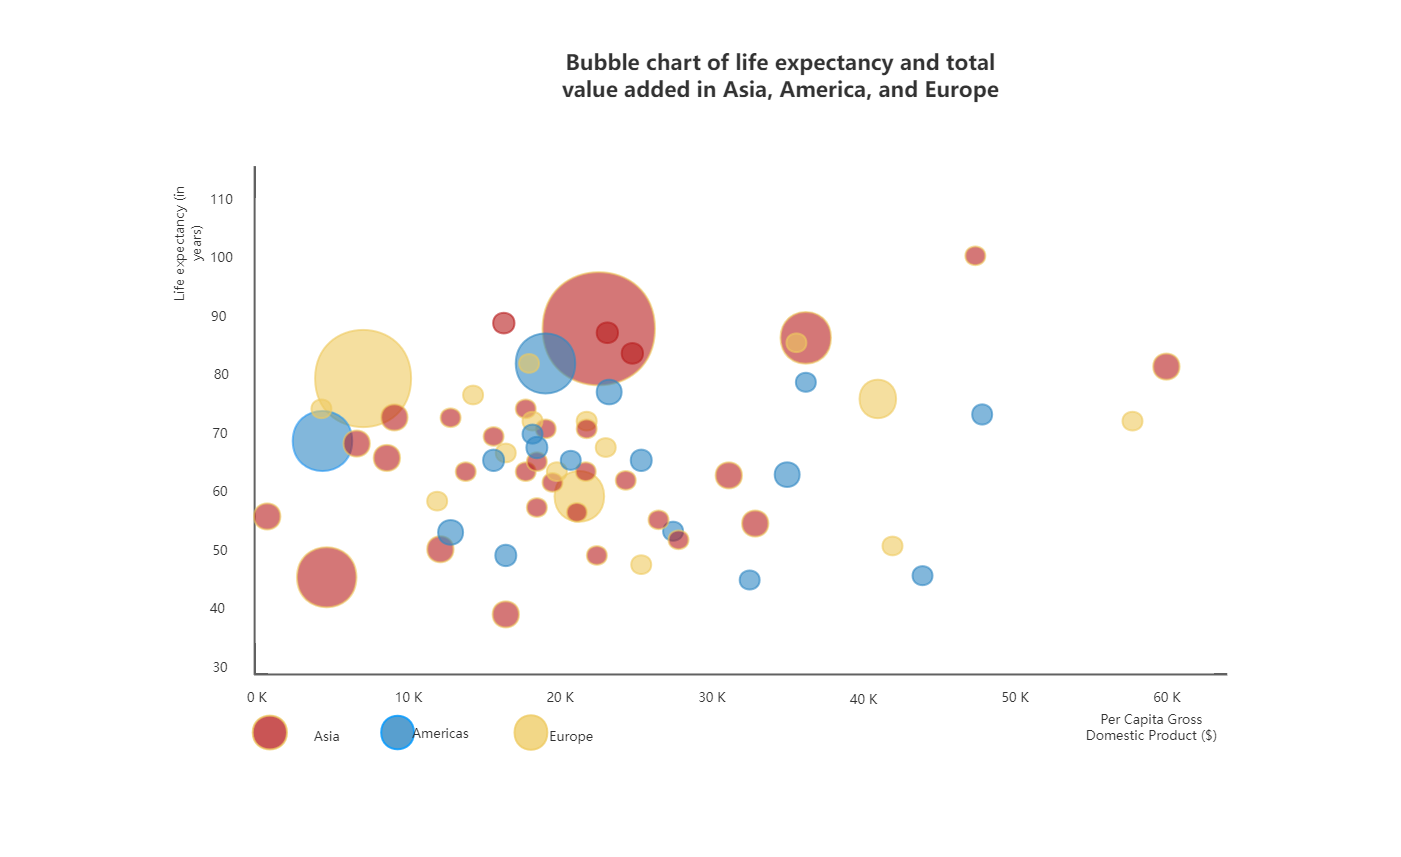
Bubble chart of life expectancy and output value added in Asia, America and Europe
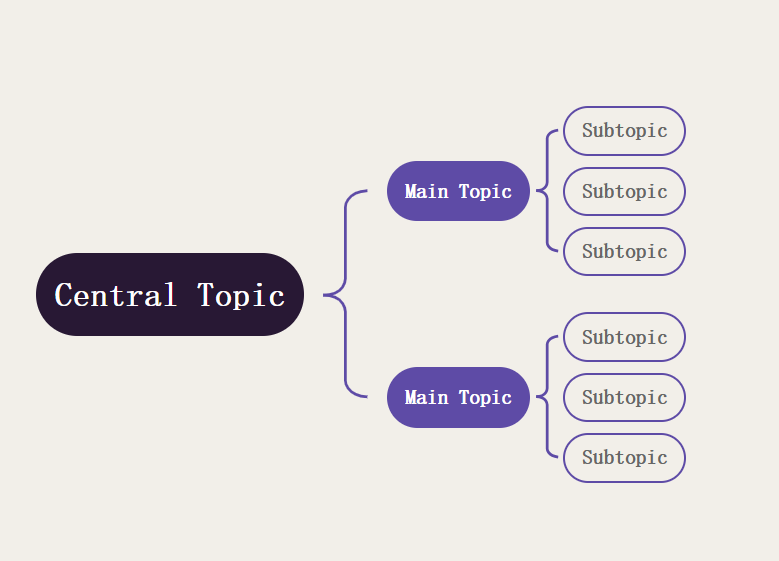
Bracket diagrams are generally used to split up things as a whole, revealing the relationship between the whole and the parts, simplifying and concretizing things. That is, to break down and understand a thing as a whole, thereby revealing the relationship between the whole and the parts, and forming a clearer understanding of the microscopic structure of the whole thing.
The bracket diagram can also be used to break down the specific actions under each goal, so that a seemingly unattainable goal can be broken down into specific small events that can be completed. For example, project application sounds difficult to achieve, but we can break it down into three aspects: customer training, project document preparation and guidance, and financing guidance. Customer training is divided into project application, review and defense, and acceptance report. Project document preparation and guidance is divided into feasibility report, business plan, various project application materials, and various project acceptance materials. Financing guidance is divided into business plan and financial and tax planning guidance.
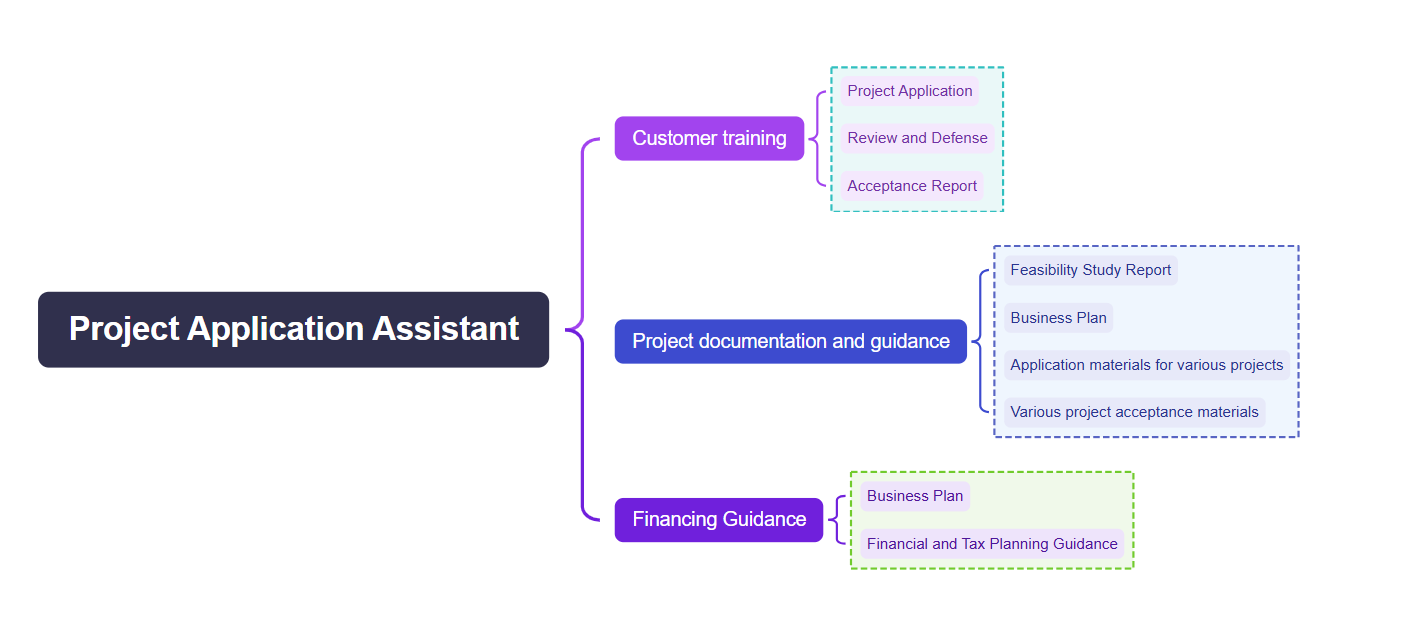
Project Application Assistant Responsibilities Bracket Chart
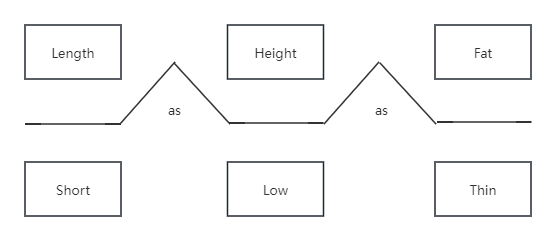
The bridge diagram is generally used to describe the similar relationships between things, to describe the conceptual relationship between two unfamiliar things, and to make things easier to understand by making analogies between known concepts and very unfamiliar concepts. It mainly relies on analogies and metaphors.
A dendrogram is a graph that looks like a tree. The theme is the trunk, the categories are the branches, and the categories are the leaves. Each branch theme from the trunk to the upper right or lower right affects the subsequent result formation.
A tree diagram is a graphic that visualizes data hierarchies. As a concise and clear structural diagram, it has unique advantages in displaying hierarchical relationships and organizational structures.

Red and Blue Tree Chat Style Template
The following is a functional structure diagram of the financial information service platform system. The main functions of the product are listed in the form of a tree diagram, including: mine, quotation platform, asset platform, market conditions, data, training, association, system management, etc., making the product functions more intuitive.
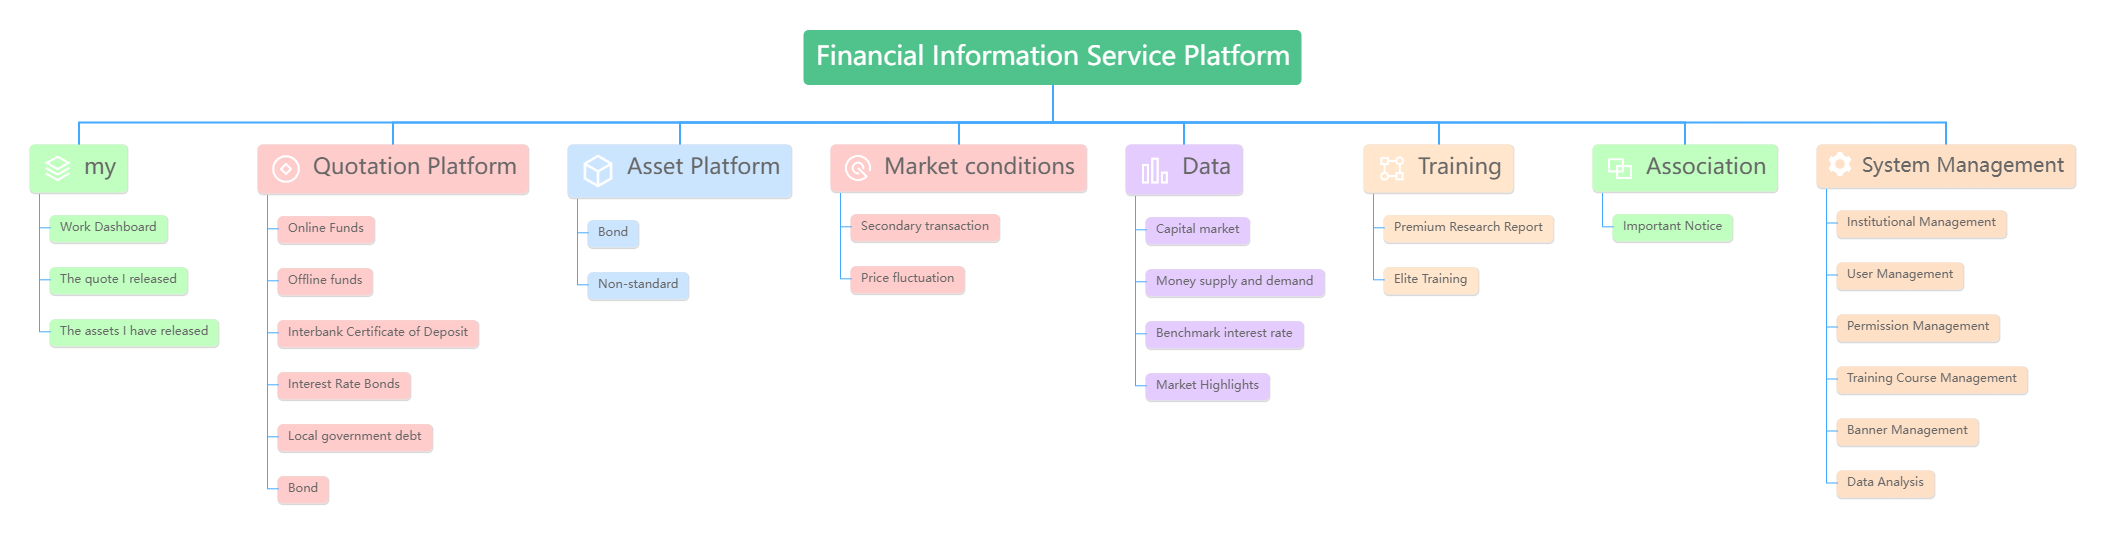
Function tree diagram of financial information service platform system
A flowchart is a language that is a graphical representation of the flow of information, ideas, or components through a system, primarily used to illustrate a process. Standard symbols are used to represent certain types of actions, such as diamonds for decisions, parallelograms for input/output, and lines with arrows for the flow or sequence of events.
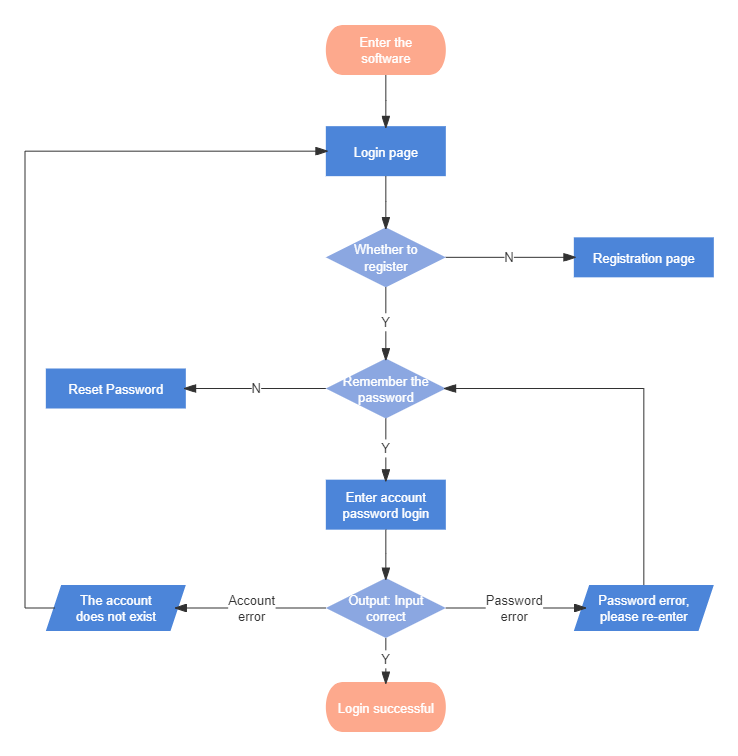
Product Login (Basic) Flowchart
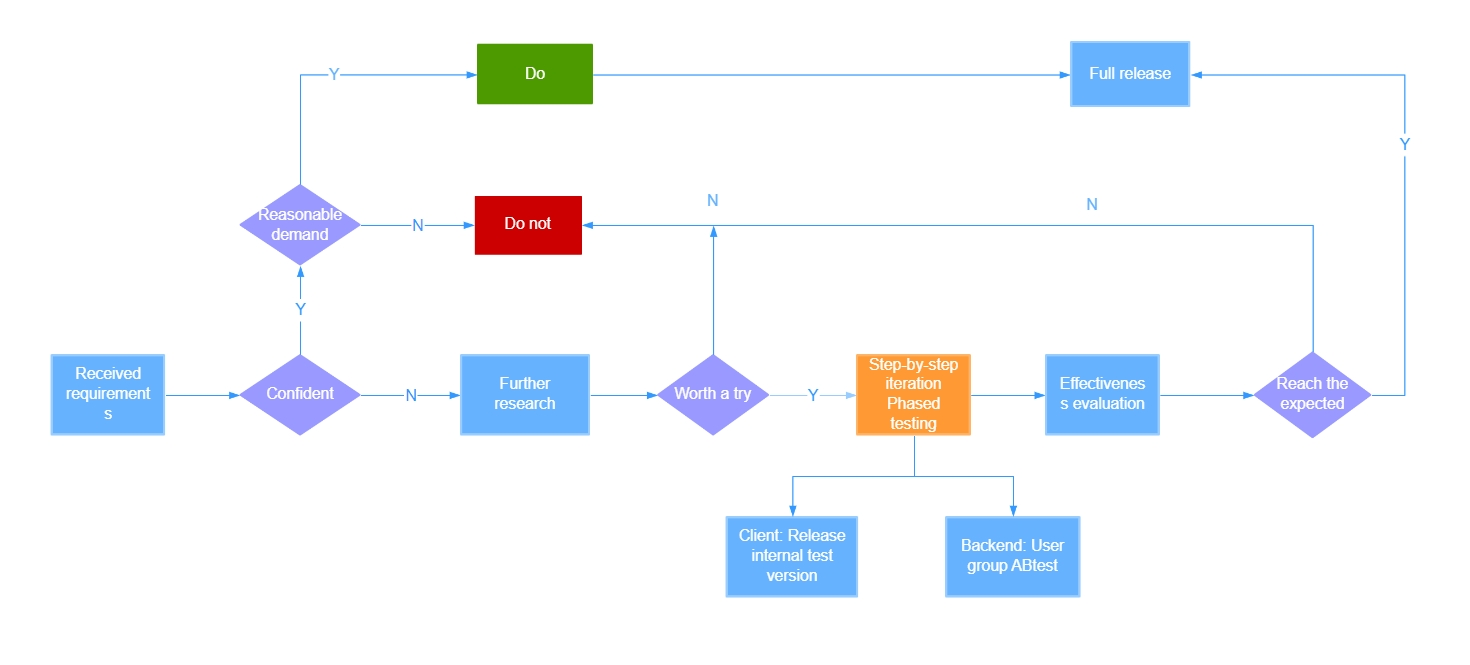
Needs Assessment Process Logic Diagram
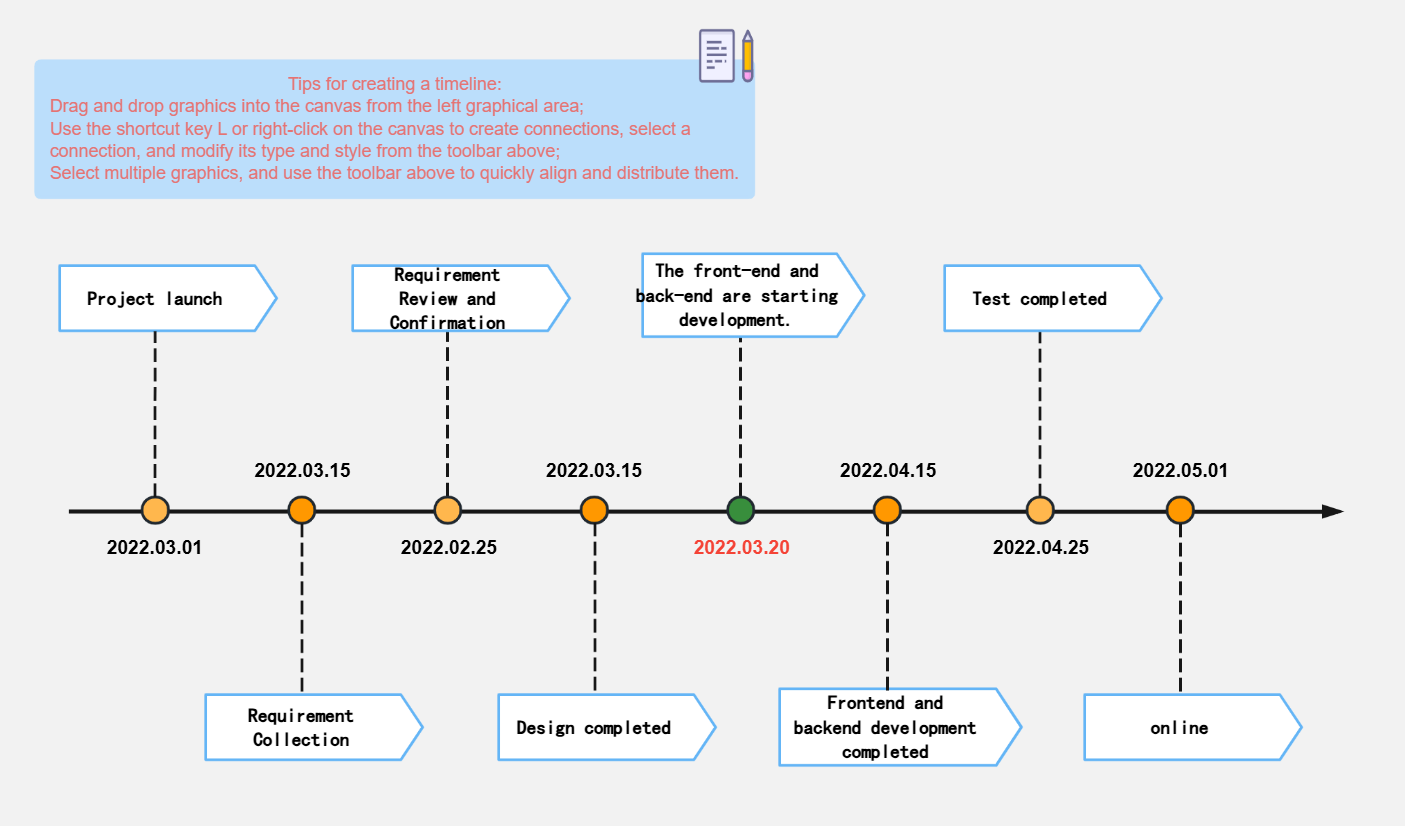
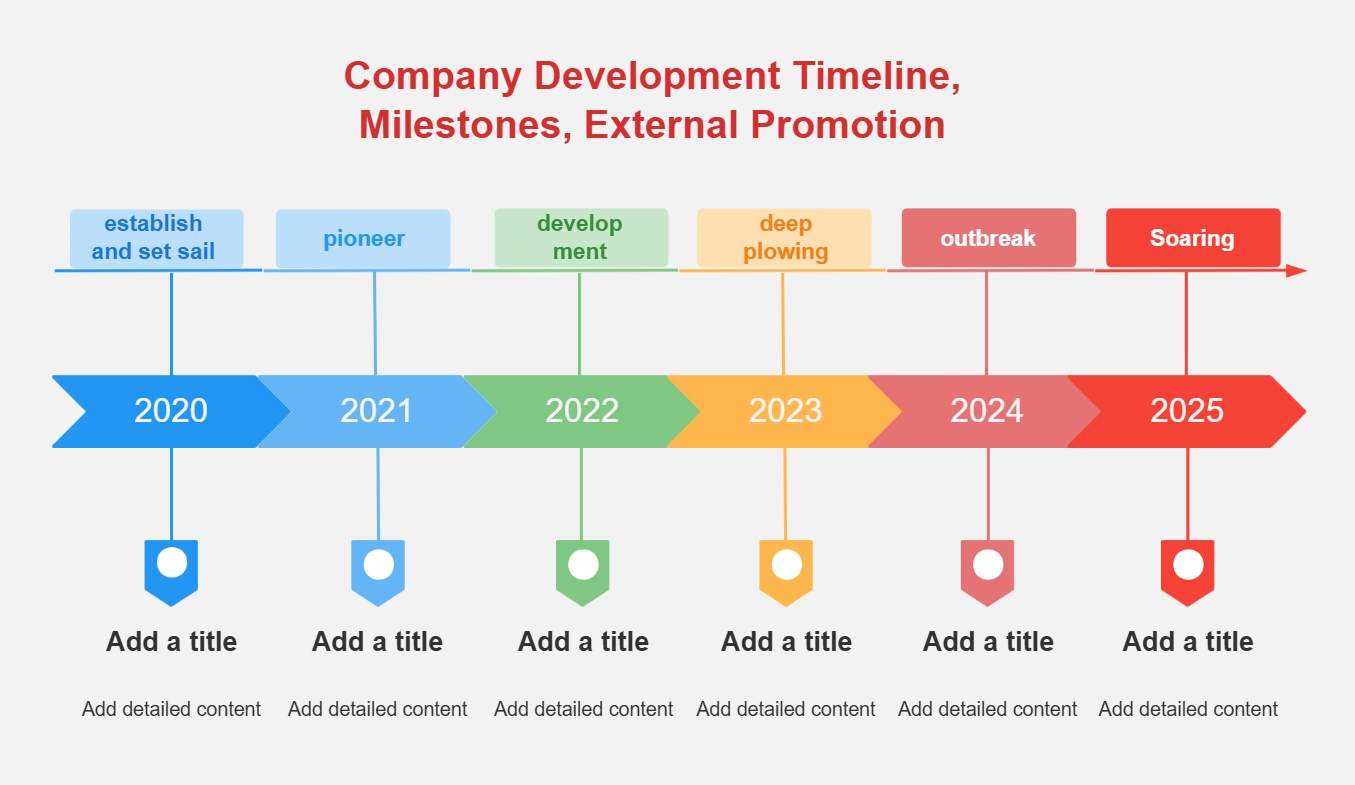
A timeline is a concept or tool used to represent the order of time. It usually connects past, present and future events in a linear manner to form a clear time context. The timeline can be applied to multiple fields, including recording history, project management, and corporate events, to help people clearly understand and track the development process of events.
The above are the 6 basic styles of mind maps compiled by the editor. To learn and view more mind map templates, please visit the ProcessOn template community .