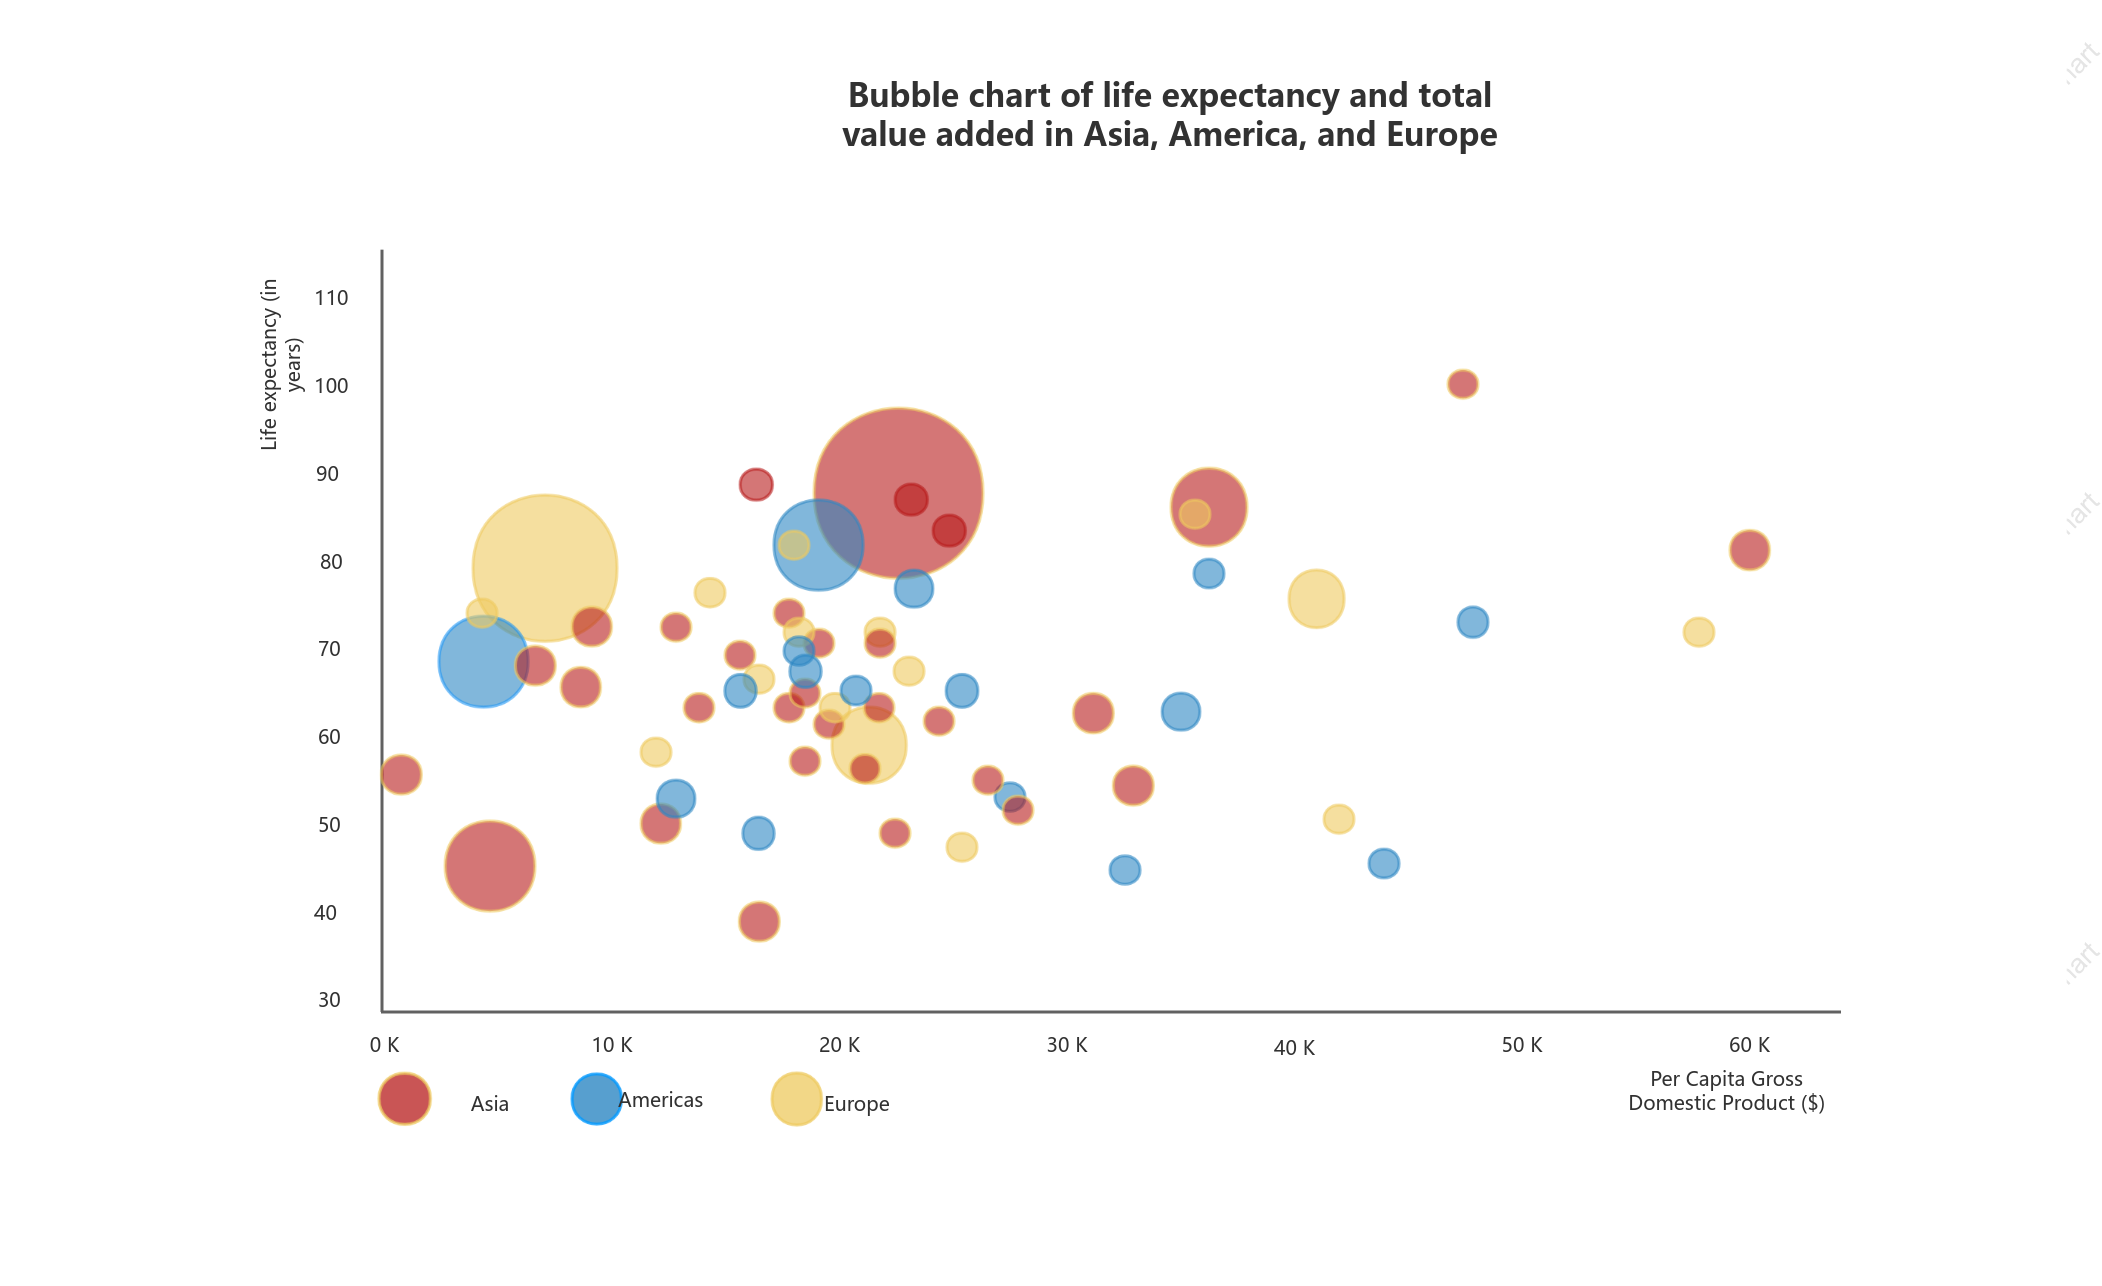

Bubble chart of life expectancy and output increase in Asia, America and Europe
0 Report
This bubble chart illustrates the relationship between life expectancy and per capita GDP across three major regions: Asia, America, and Europe. It provides a visual comparison of how economic output correlates with life expectancy in these regions. The chart showcases data points with varying GDP levels, ranging from 0 to 60K in Asia, 10K to 50K in Europe, and 40K to 90K in the Americas, alongside life expectancies from 30 to 110 years. This visualization aims to highlight regional disparities and the potential impact of economic prosperity on longevity.
Related Recommendations
Other works by the author
Outline/Content
See more
50
Life expectancy (in years)
30
40 K
Asia
20 K
0 K
Europe
40
60
80
Per Capita Gross Domestic Product ($)
10 K
50 K
30 K
100
110
70
Americas
60 K
90


Collect

Collect

Collect

Collect

0 Comments
Next Page