Process Type
Graphical expression
Mind Type
Structured expression
Note Type
Efficient expression
Treemap
Bracket Diagram
Default Mode


We often say that if you can’t measure, you can’t grow. Data analysis plays a vital role in improving the business value of an enterprise. In the workplace, we need to master a set of systematic, scientific, and business-oriented data analysis knowledge to meet the needs of daily work.
Data analysis is the process of collecting, processing and analyzing data to obtain valuable information to guide work. It helps to understand business progress and changes, locate problems, guide work direction, and measure work effectiveness.
Data analysis is becoming increasingly important to the development of enterprises, with more than 90% of enterprises currently using or about to use data. At the same time, as an effective means of analyzing and solving problems, data analysis will become a core competency required by professionals in various positions such as marketing, HR, consulting, and investment.
For newcomers to the workplace, having data analysis skills can help you find a job faster and get a higher salary; field experts can conduct in-depth research in their professional fields and quickly establish industry authority; data is the basis for any decision, and for small and medium-sized managers, mastering accurate data can ensure the effectiveness of the enterprise/project; data has a greater impact on the decision-making of senior leaders, who make business insights based on data and quickly identify opportunities.
Data analysis is also a necessary skill for many industries and positions. For example, the Internet industry uses it for daily user behavior analysis, traffic indicator analysis, advertising analysis, employee capability evaluation, etc.; e-commerce/retail uses it for daily sales monitoring, product selection, store expansion, and promotional activities; human resources/finance is often used for indicator building, improving efficiency, business nature, and business decision-making; advertising/marketing conducts advertising effectiveness testing, media placement recommendations, real-time cost control, social listening, etc.
The value of data analysis is an important ability that enables ordinary people in our workplace to become extraordinary, so everyone should have data analysis capabilities.
To have data analysis ideas, you first need to master the commonly used analysis methods. Once you understand these commonly used methods, data analysis ideas will naturally emerge.
1. Commonly used data analysis methods
What are the commonly used data analysis methods? Different analysis methods are used according to different analysis purposes in business scenarios.
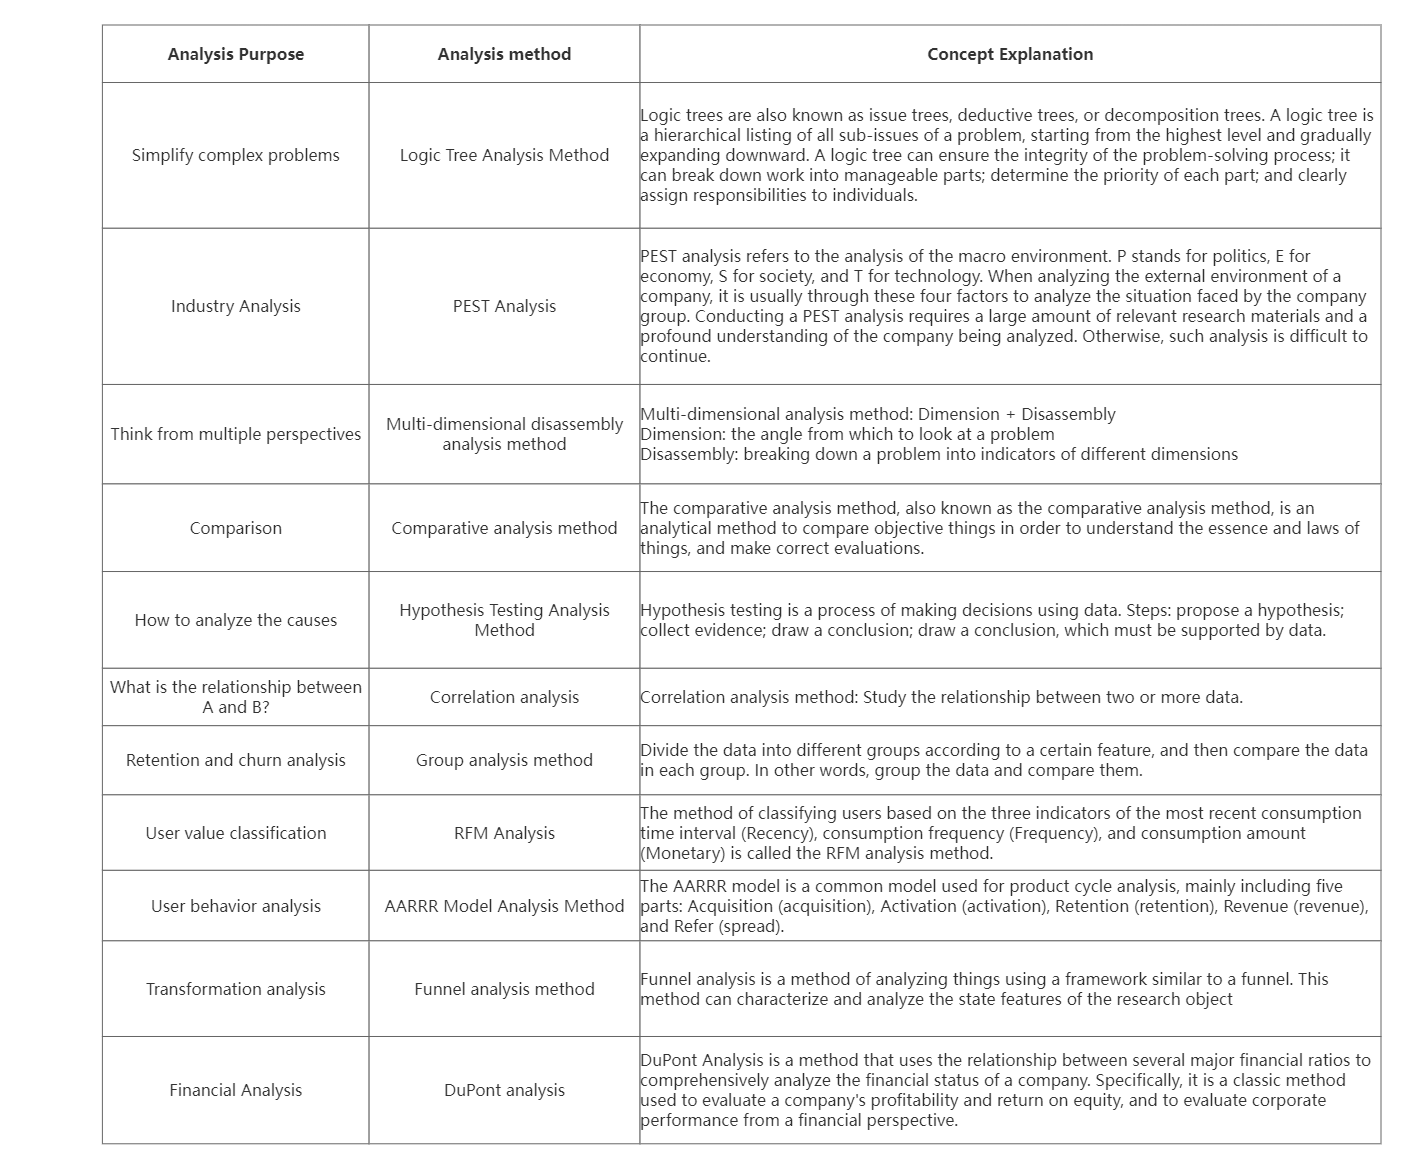
If the above commonly used analysis methods cannot satisfy you, a more comprehensive data model supplement is provided below.
2. 35 must-learn data analysis models
Data analysis models are commonly divided into three categories:
1) Pure theory, unrelated to data. For example, SWOT, PEST, etc. This model is strictly a way of thinking to help you analyze data;
2) Models based on indicator calculations. For example, the funnel method, AARRR, matrix model, DuPont analysis, etc. This is the most commonly used model in data analysis business, directly linked to the company's KPI, and often used in the company's business analysis and data system;
3) Algorithm-based models. Algorithm models include simple ones such as time series, as well as machine learning, regression, clustering, etc.
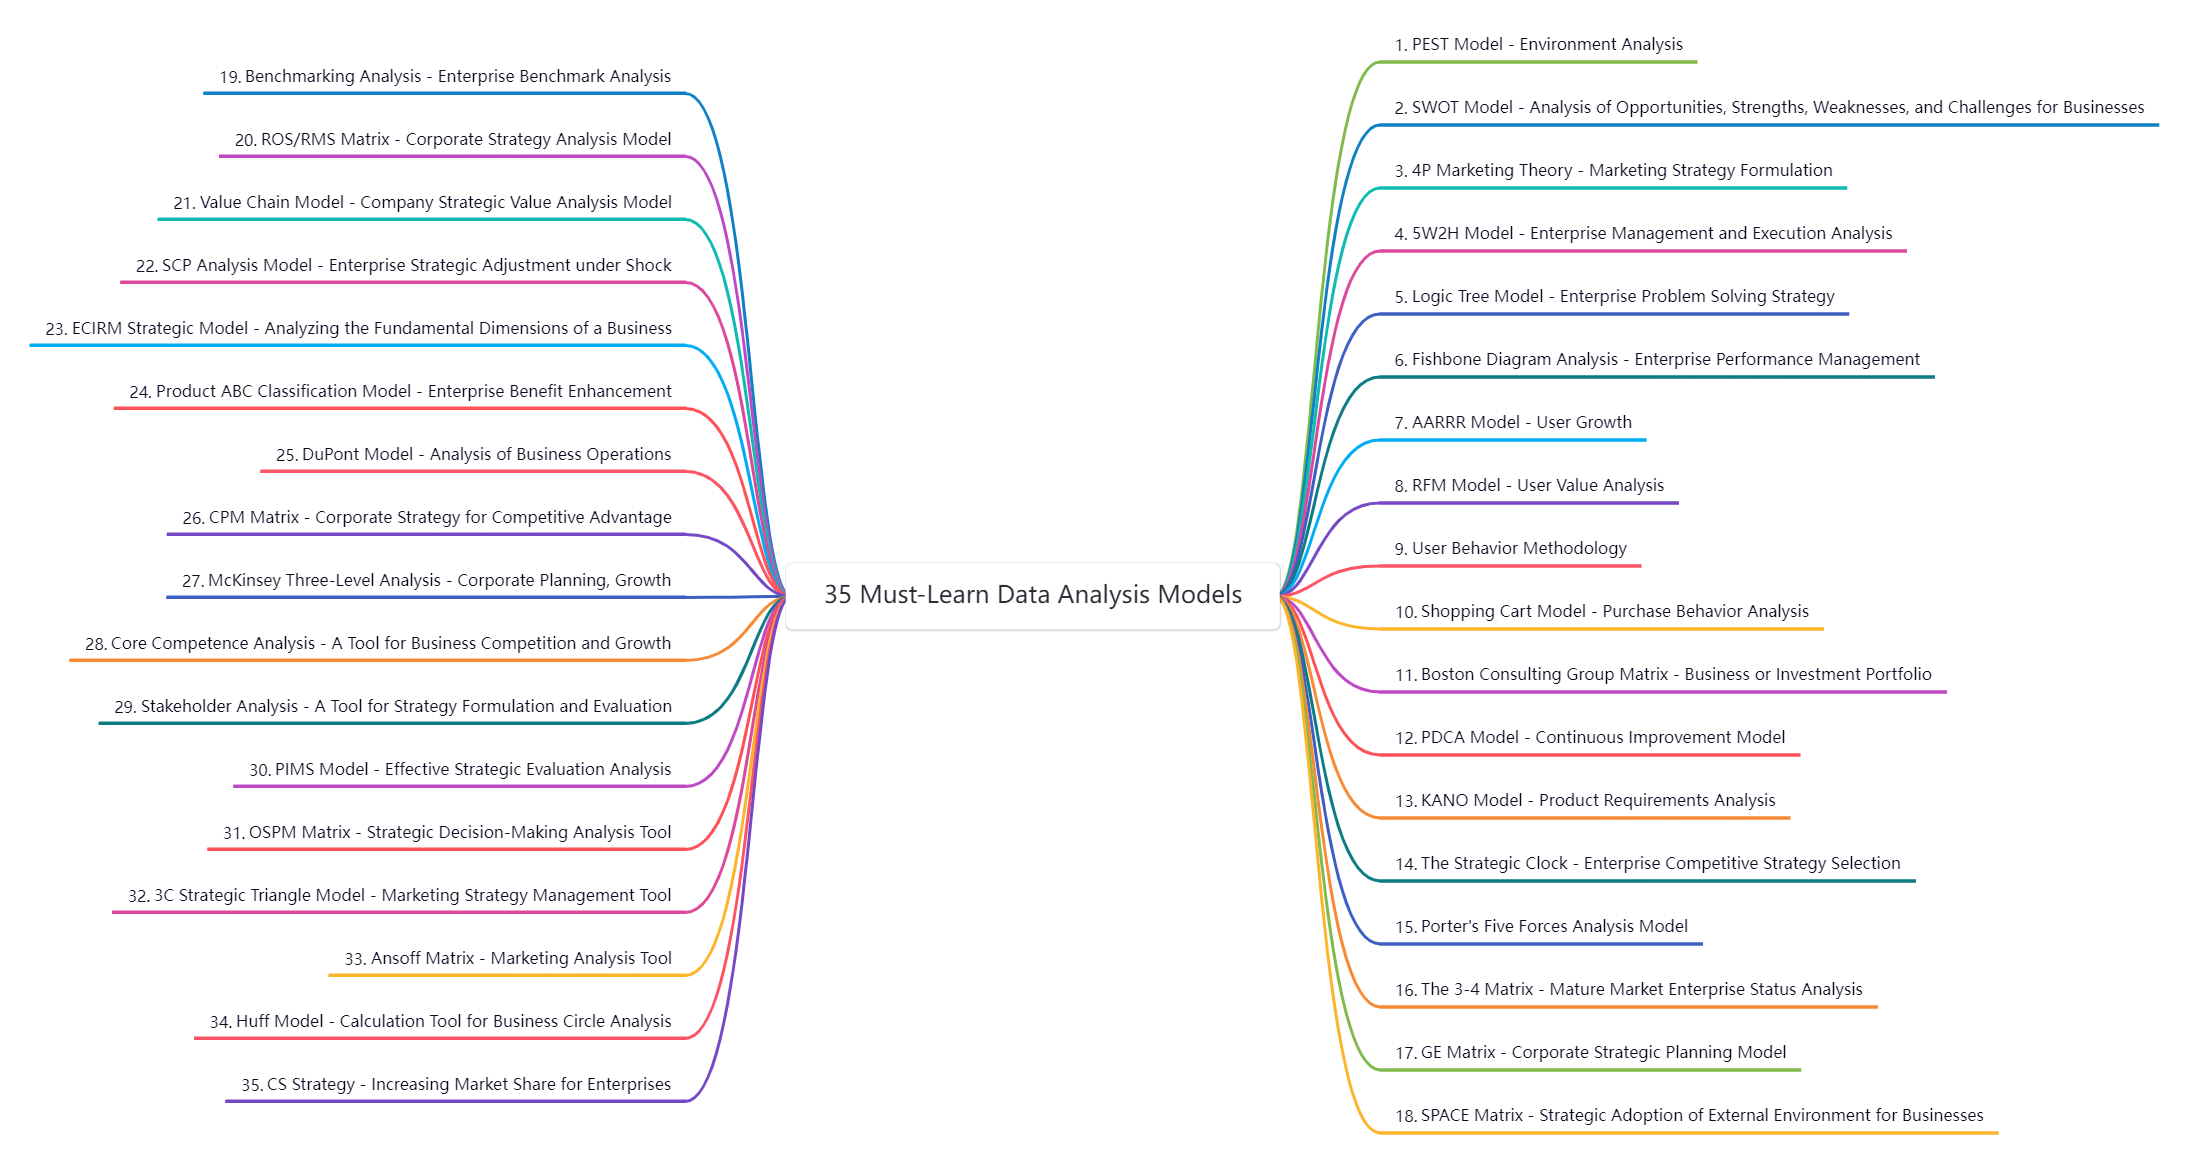

35 Must-Learn Data Analysis Models
The 35 must-learn data analysis models listed in the figure include the first two models, namely the pure theoretical model and the model based on indicator calculation, which provide both thinking methods and analysis methods.
Only by mastering the commonly used data analysis methods and models and having professional analysis knowledge and tools in the specific data analysis process can the purpose of data analysis be achieved.
1. Basic knowledge of data analysis
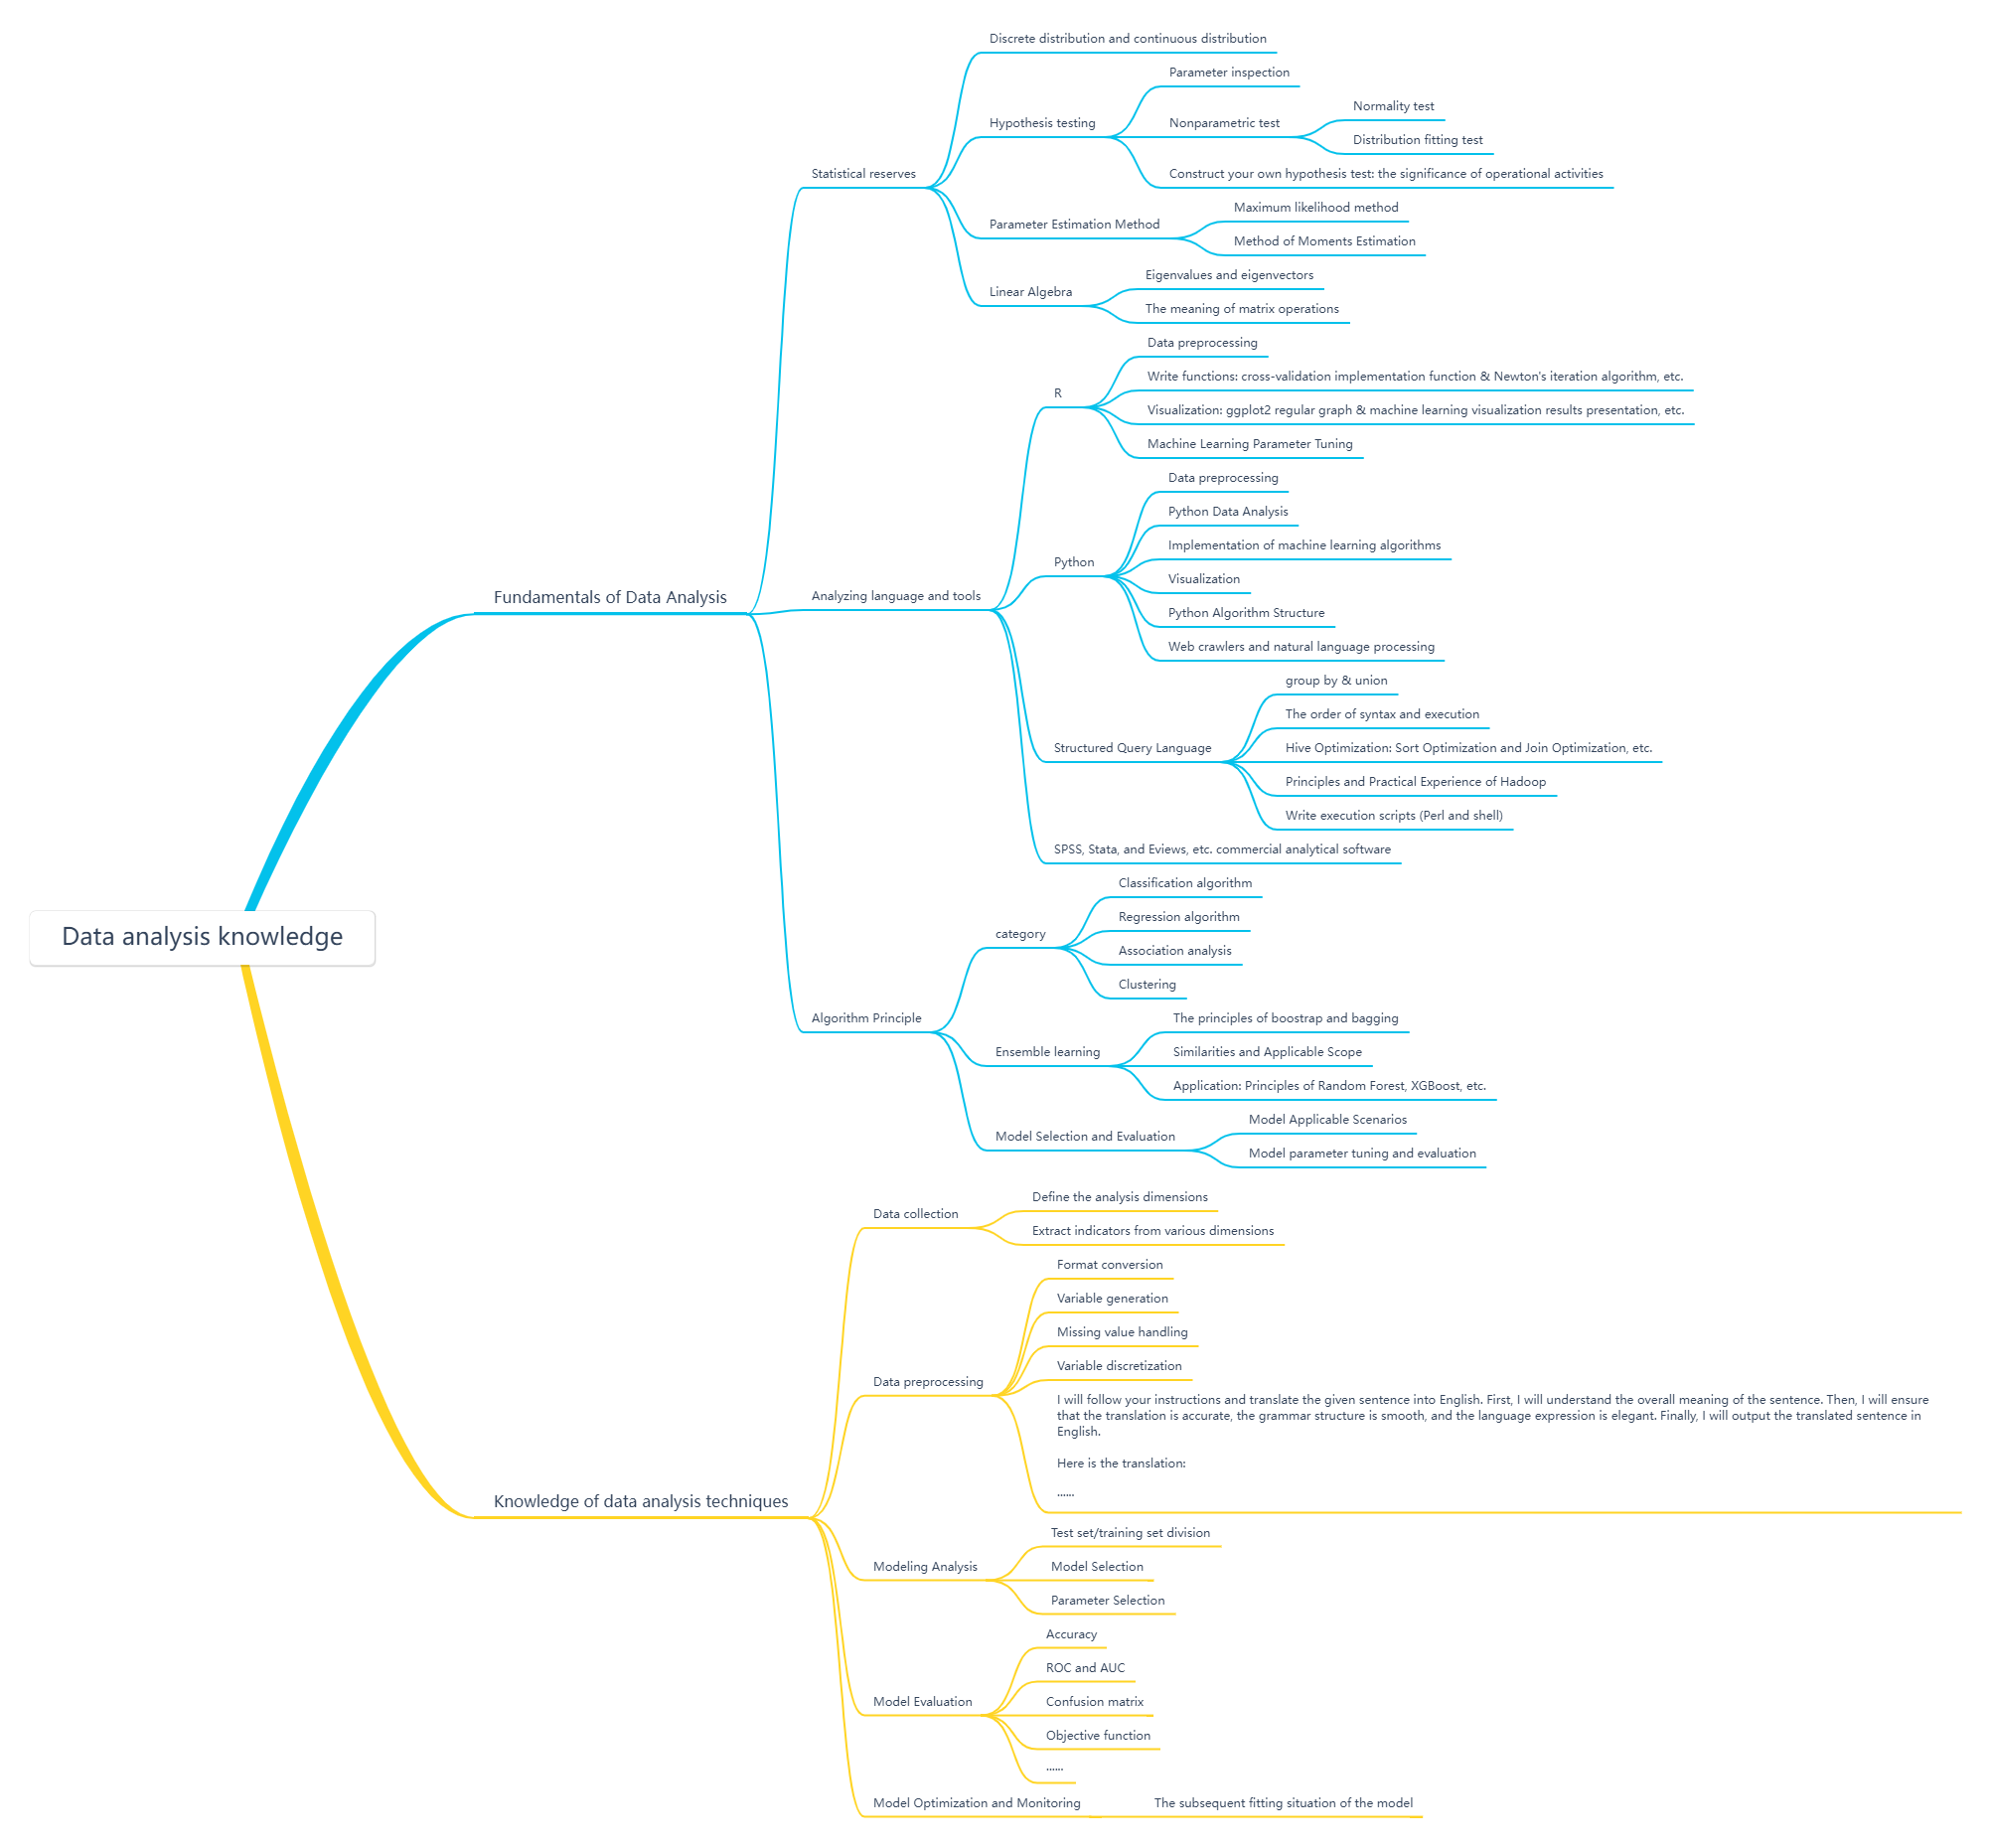
In the actual operation of data analysis, we also need to understand and master some basic knowledge of data analysis. This figure summarizes the three aspects of statistical reserve, analysis language and tools, and algorithm principles.
2. Data analysis and mining
What is data mining? Data mining is the process of extracting implicit, unknown, but potentially useful information and knowledge from large amounts of incomplete, noisy, fuzzy, and random data.
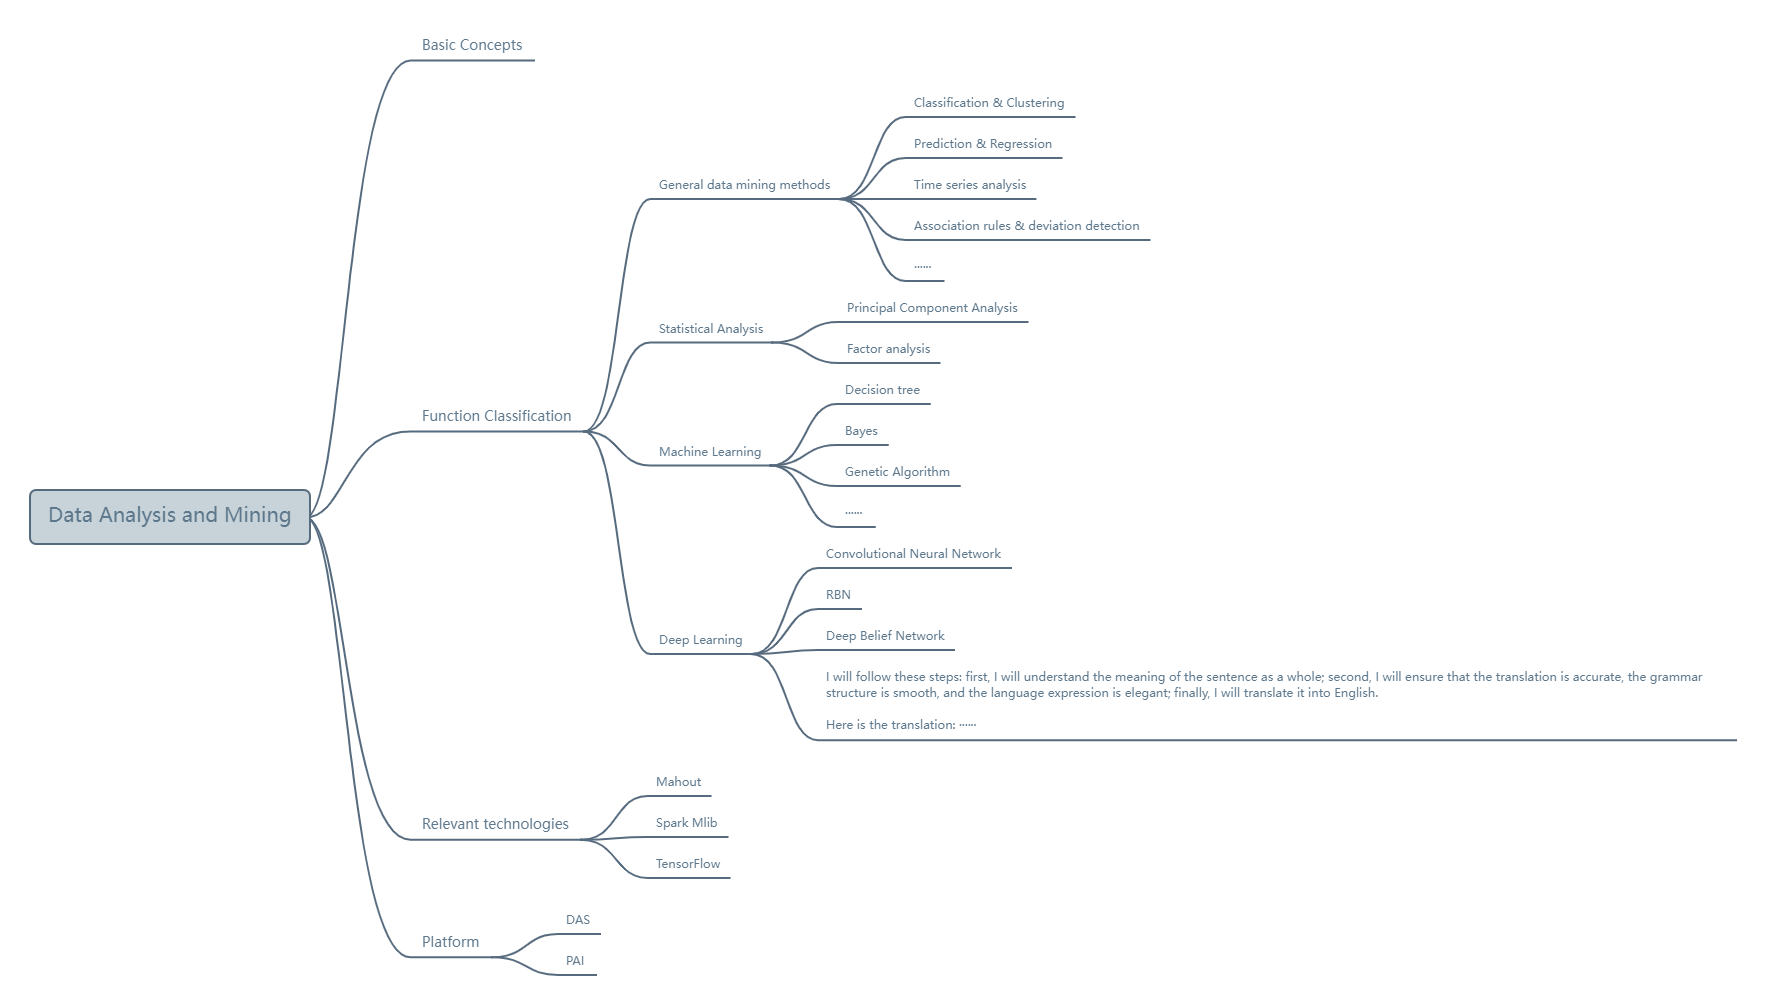
The focus of data mining is to find unknown patterns and rules. One of the more famous cases is the "beer and diaper story".
In the United States, when young fathers go to the supermarket to buy diapers, they often buy beer for themselves. As a result, beer and diapers, two seemingly unrelated products, often appear in the same shopping basket. After the supermarket discovered this phenomenon, it tried to place beer and diapers in the same area in the store so that young fathers could quickly find these two products and complete their shopping.
This story gained more sales revenue because it was supported by the results of data mining.
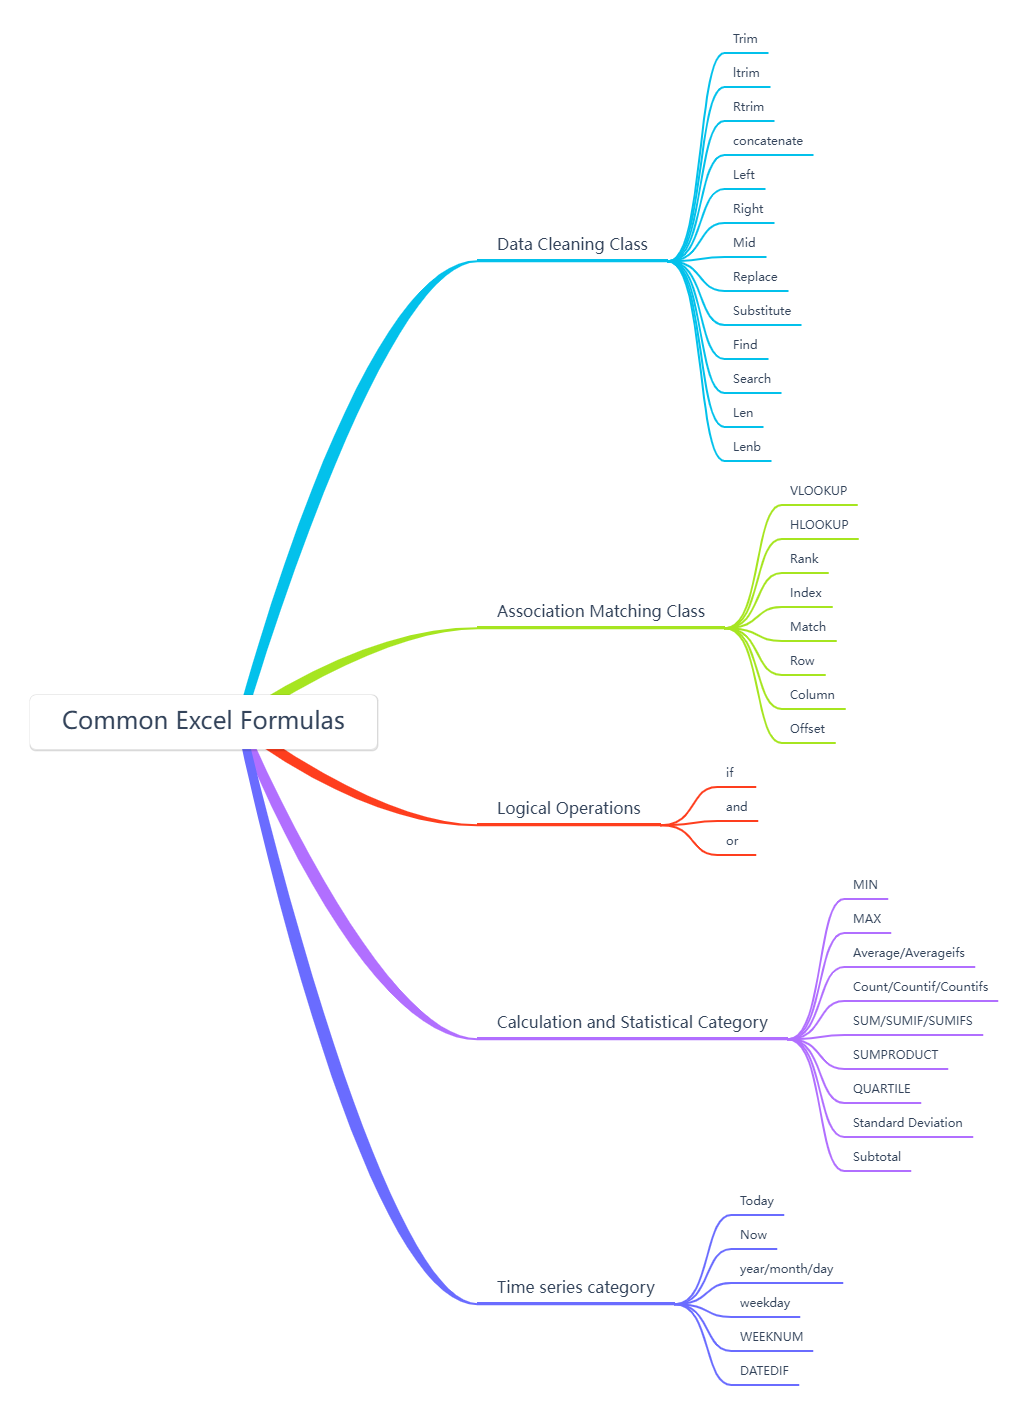
3. Common Excel formulas
Excel is a tool we often use in our work. Proficient use of Excel can not only help us improve data processing efficiency, but also make data analysis simple and efficient, freeing us from monotonous and repetitive work.
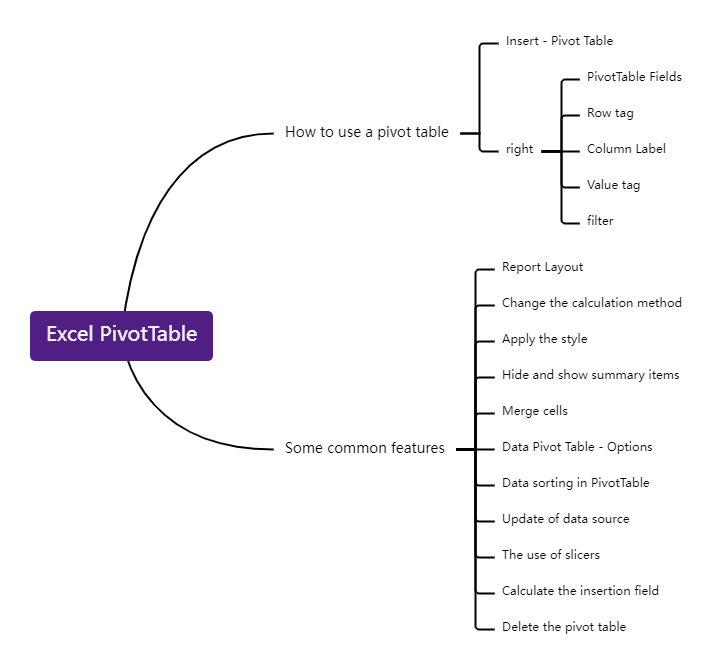
4. Excel Pivot Table
The most commonly used data analysis in Excel is the Pivot Table, which is a data analysis tool that can quickly perform various classification summaries on detailed data tables. It can basically meet primary and simple data analysis needs, and it is not very complicated to learn. When reporting to leaders, skillful use of Pivot Tables can make your expression more in-depth and accurate.
5. Common data indicators
Not all data are called indicators. Only data that is of reference value to the business is called an indicator.
There are many data indicators. Good data indicators can change business behavior, retain users, spread word of mouth, maximize the brand, and thus establish a positive brand image and create more revenue. Good data indicators should provide guidance for the development stage of the product business line.
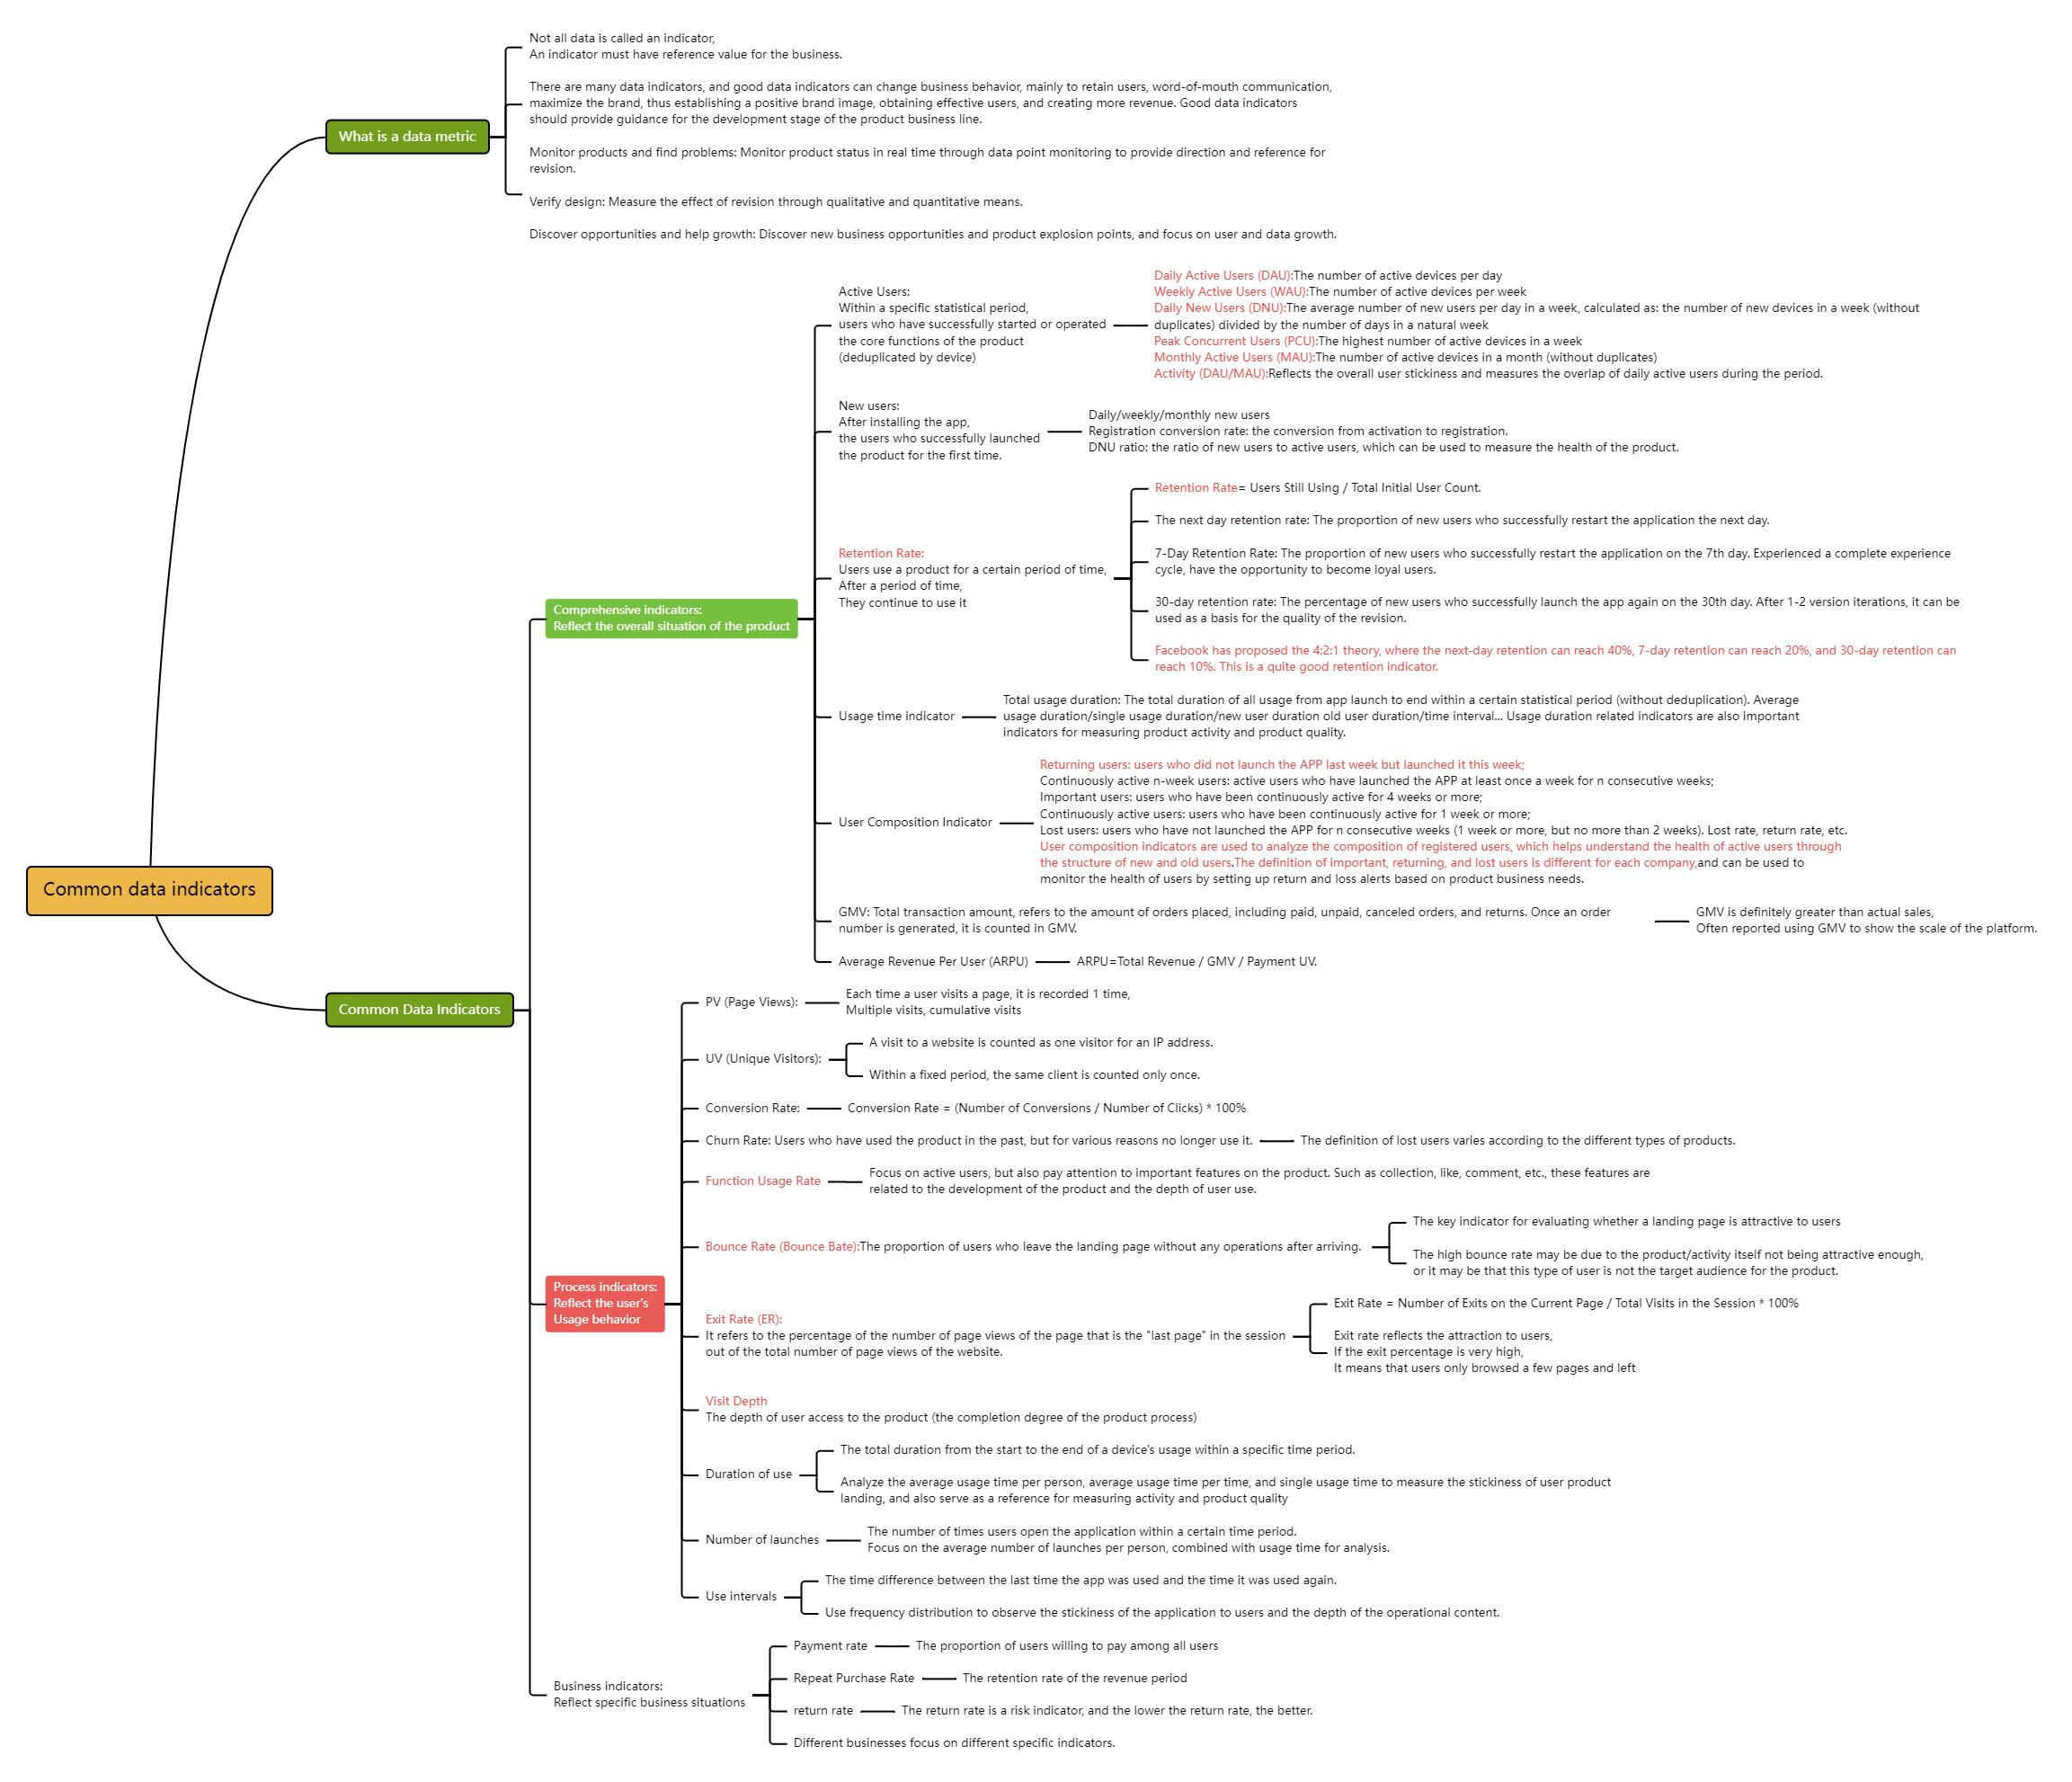

There are three common data indicators: comprehensive indicators that reflect the overall situation of the product, process indicators that reflect user behavior, and business indicators that reflect specific business situations. Different industries focus on different data situations, and there are many ways to obtain data. You can find the answer to the specific methods and differences through this picture.
A capable professional, whether it is event planning, product growth, or decision-making on product optimization, must not only pay attention to comprehensive professional skills and methods, but also have the ability to analyze the overall business with data thinking.
Maybe you have never paid attention to the cultivation of your data capabilities before. In that case, start to have more contact with and understand more about the company's business, practice more, and analyze more. I believe that as more and more sense of accomplishment comes, you will experience the charm of data.
The above is the relevant content about data analysis . All the above data analysis cases are drawn using ProcessOn .