Process Type
Graphical expression
Mind Type
Structured expression
Note Type
Efficient expression
Treemap
Bracket Diagram
Default Mode


The work of a product manager is essentially a continuous game of moving from "chaos" to "order".
With a mountain of user feedback piling up in the demand pool, urgent requests from operations colleagues, and developers questioning "what problem does this feature actually solve?"... bombarded with all sorts of information every day, without a clear method for sorting out and planning, it's easy to fall into the predicament of "looking busy, but the product direction becoming increasingly unclear."
Today, we'll discuss how product managers can use three core charts to transform chaotic requirements into a clear product blueprint. These three charts are: a requirements list, a product feature structure diagram, and a product roadmap.
When you receive a bunch of requirements, don't rush to draw diagrams. The first step is always: categorize, filter, and prioritize.
When faced with dozens or even hundreds of requirements, each requirement can be labeled using the following dimensions:
Source dimensions: user feedback, data analysis, competitor research, management needs, operational needs, and technical needs.
Type Dimensions: Functionality, Optimization, User Experience, Performance, Compliance
Value dimensions: core value, auxiliary value, pseudo-needs
The core purpose of this step is to "see the big picture." Once all the requirements have been categorized, you will have a macro-level understanding of the direction for product improvement.
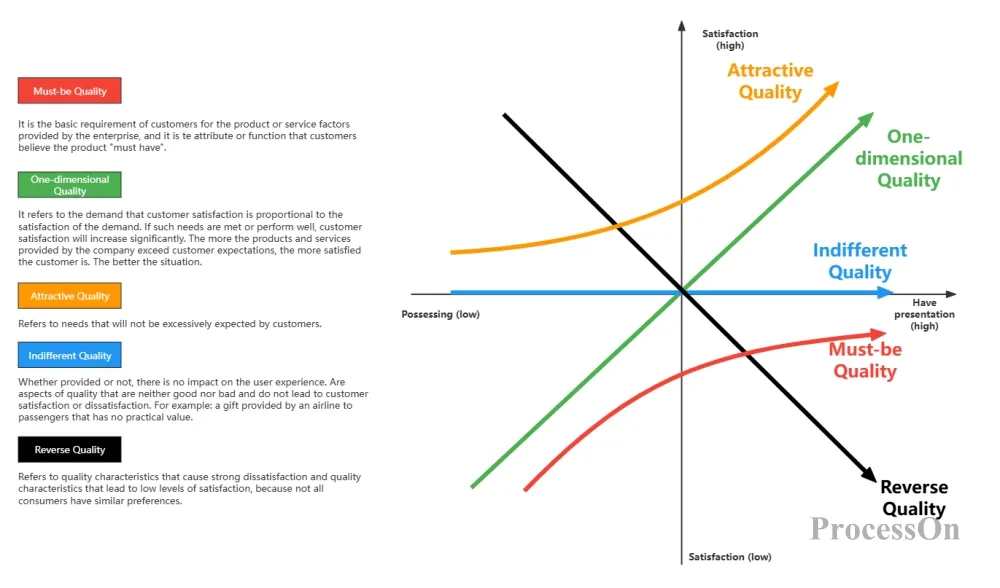
The Kano model is a classic tool for requirements screening, which categorizes requirements into five types:
Basic requirements: These are things that a product must have. If you don't do them, users will complain. If you do them, users will take them for granted (such as the payment function of an e-commerce app).
Desired needs: What users clearly want; the better this is done, the more satisfied users will be (e.g., the accuracy of search results).
Excitement-driven needs: Unexpected surprises for users; their absence won't affect the user experience, but their presence will elicit excitement and excitement.
Undifferentiated needs: Users won't notice whether or not it's implemented.
Reverse demand: Doing it might actually make users dislike it.
When screening, you can first eliminate "no difference" and "reverse" requirements, and focus on keeping the first three categories.
The RICE model is a tool for quantifying priorities, with four dimensions:
Reach (coverage): How many users will this feature affect?
Impact: How much influence do you have on a single user? (Usually rated on a scale of 3, 2, 1, or 0.5)
Confidence: How confident are you in the above judgment? (Percentage)
Effort (Input): How many person-days are required for development?
Calculation formula: RICE Score = (Reach × Impact × Confidence) / Effort. The higher the score, the higher the priority.
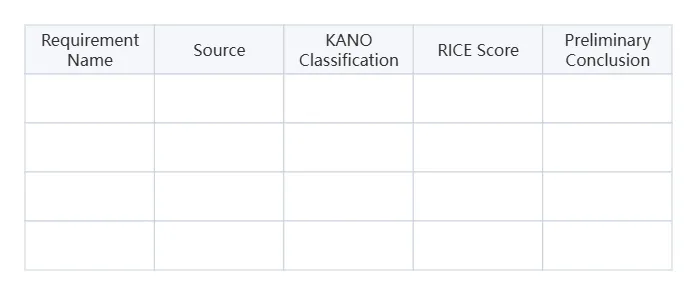
You can use tables or mind maps to organize the final requirements list. A clear requirements list should include: requirement name, source, KANO classification, RICE score, and preliminary conclusions.
The requirements have been clarified, but what the team needs is not a list of "20 features to be implemented", but a structure diagram of "how to organize these 20 features together".
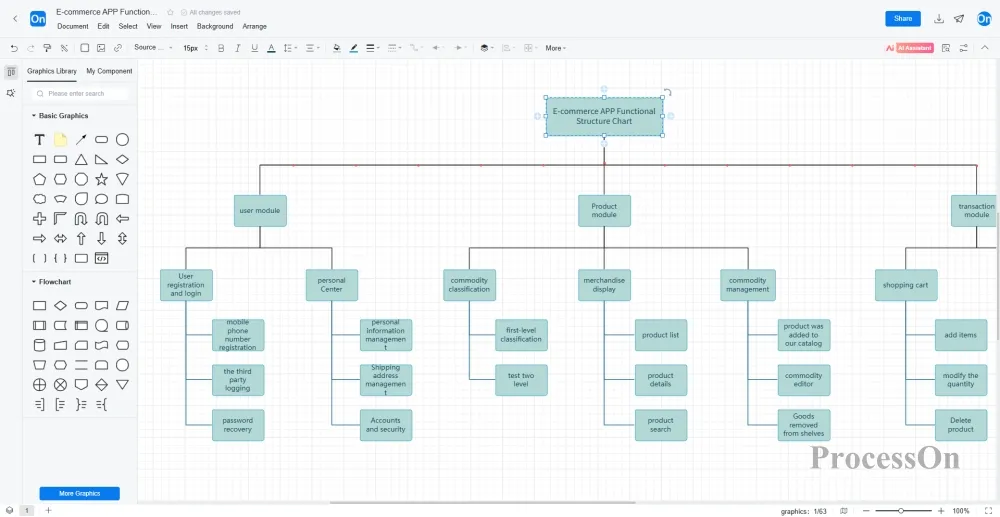
A product functional structure diagram, also known as a product information architecture diagram, illustrates the hierarchical relationship and logical organization of product functions. With it, developers understand module boundaries, designers understand page navigation, and testers understand test case coverage.
A standard functional architecture diagram typically contains three levels:
First-level modules: The top-level functional division of a product, usually corresponding to the bottom navigation bar or core business sections (such as the " user module , product module , and transaction module " in an e-commerce app).
Secondary functions: Core functions under each primary module (e.g., " Product Module " under " Product Category " , " Product Display ", "Product Management ")
Third-level sub-functions: Specific operations or subpages under second-level functions (such as " Product Listing , " " Product Editing , " and "Product Delisting " under " Product Management ").
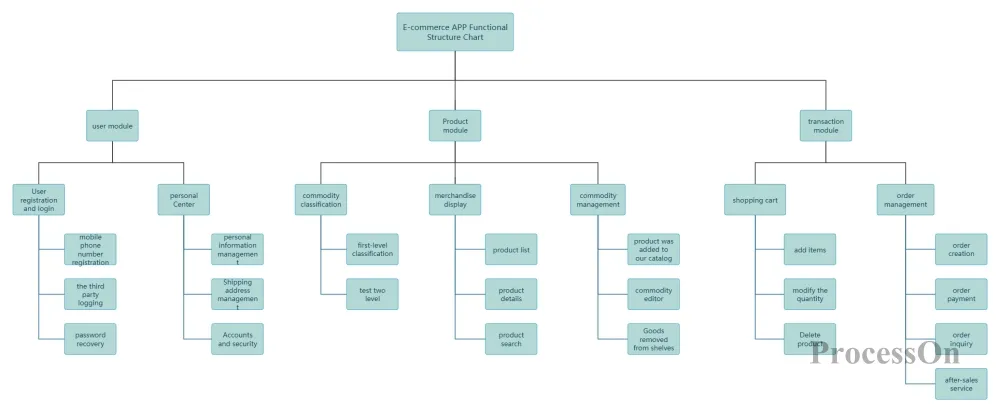
E-commerce APP Functional Structure Chart
The MECE principle states that functions at the same level must be mutually exclusive and exhaustively enumerated, without overlap or omission .
User perspective: The organizational structure should be based on user habits, not on the company's organizational structure .
Scalability: Reserve room for future feature expansion; don't make the design too rigid .
In ProcessOn , you can directly use the " Flowchart " or "Organization Chart" templates to draw functional structure diagrams .
The functional architecture diagram is complete, and the team knows "what we need to do." But one crucial question remains unresolved: "When to do it?"
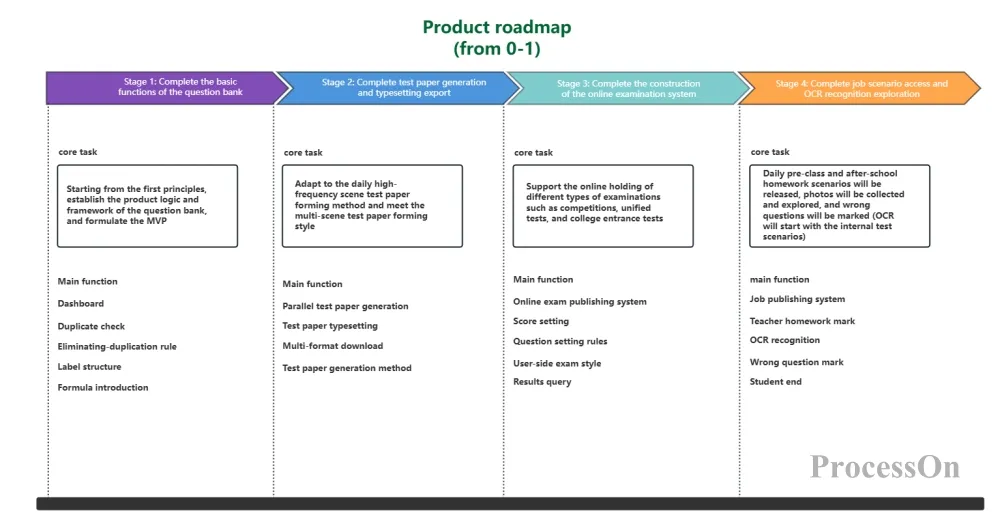
A product roadmap is the tool to answer this question. It shows the product's iteration plan and feature release schedule in the form of a timeline over a period of time.
Timeline: can be quarterly, bi-monthly, or monthly, depending on the product's schedule .
Functional modules: The core functions to be released at each time point .
Objectives: What problems will each version solve and what business goals will it achieve ?
Internal roadmap: granular, including specific features and development schedules, for internal use by the team .
External roadmap: coarse-grained, only stating "which direction we are going" for customers and the market to understand .
Strategic Roadmap: A higher-level perspective that showcases the product vision and annual strategic direction .
Step 1: Determine the time scale
First, clarify the time frame covered by the roadmap (e.g., six months or one year) and the smallest time unit (quarter or month).
Step 2: Function Grouping
After prioritizing the requirements list, allocate them to different time periods. The basic principle is: address basic requirements first, then anticipated requirements, and intersperse exciting requirements as surprise elements in the process.
Step 3: Version Naming
Give each version a meaningful name, such as V2.0 "Basic Trading Edition" and V2.1 "Marketing Enhanced Edition". The name itself summarizes the version's goals.
Step 4: Mark the target
Below each time point, summarize the core objective of this version in one sentence. For example, "Launch group buying feature to increase new user conversion rate by 20%".
Step 5: Visual Presentation
Visualize the above information using a Gantt chart or timeline. The horizontal axis represents time, the vertical axis represents functional modules, and different colors represent different priorities or states.
Do not commit to specific dates: especially for external roadmaps, using "Q2" is safer than "April 15" .
Allow for a buffer period: There will always be unexpected events during development, so the timeline should have some leeway .
Dynamic adjustment: The roadmap is not carved in stone; it is reviewed monthly and adjusted as needed .
Related goals: Each version should clearly explain "why it is done", not just "what it is done" .
The essence of a product manager's job is to transform the "vague" into the "clear." Requirements analysis can turn a jumble of voices into a list with clear priorities; a functional structure diagram can turn the functional points on the list into a logically clear product architecture; and a product roadmap can turn a static architecture into a dynamic implementation schedule.
Once these three diagrams are clear, you'll have a common language to communicate with developers, designers, testers, and operations. The team will know where we're going, why we're going, and when we'll arrive.
In ProcessOn , we've prepared dedicated feature templates for product managers: requirement analysis sheets, feature structure diagram templates, and product roadmap templates. You can create them with a single click and quickly begin your product planning work. Try it now!
 Following the tutorial to try
Free to use ProcessOn
Following the tutorial to try
Free to use ProcessOn