Process Type
Graphical expression
Mind Type
Structured expression
Note Type
Efficient expression
Treemap
Bracket Diagram
Default Mode


In the field of software development, it is crucial to clearly communicate architectural design. The C4 Model (Context, Containers, Components, and Code) is a system architecture diagram method tailored for development architects. It provides a simple, clear and easy-to-understand way to express different levels of architectural information of the system, thereby helping developers, architects and stakeholders to better understand and communicate architectural decisions.
The C4 Model was first proposed by Simon Brown in his book "Software Architecture for Developers". It aims to show the architecture of the software system through a series of diagrams. These diagrams are divided according to different levels of the system, including system context diagrams, container diagrams, component diagrams, and code diagrams. The C4 model does not require the use of specific graphics or modeling languages, so users can produce architecture diagrams very flexibly.
The system context diagram is at the top level of the C4 model and is the starting point for the software system architecture diagram. It shows the overall picture of the system, including the system boundaries, system-related users, other supporting systems, and interactions with the system. This diagram is very suitable for non-technical stakeholders because it is simple and clear without involving technical details.
Main elements: software system to be described, users, external dependent systems, etc.
Target audience: Everyone inside and outside of software development teams, both technical and non-technical.
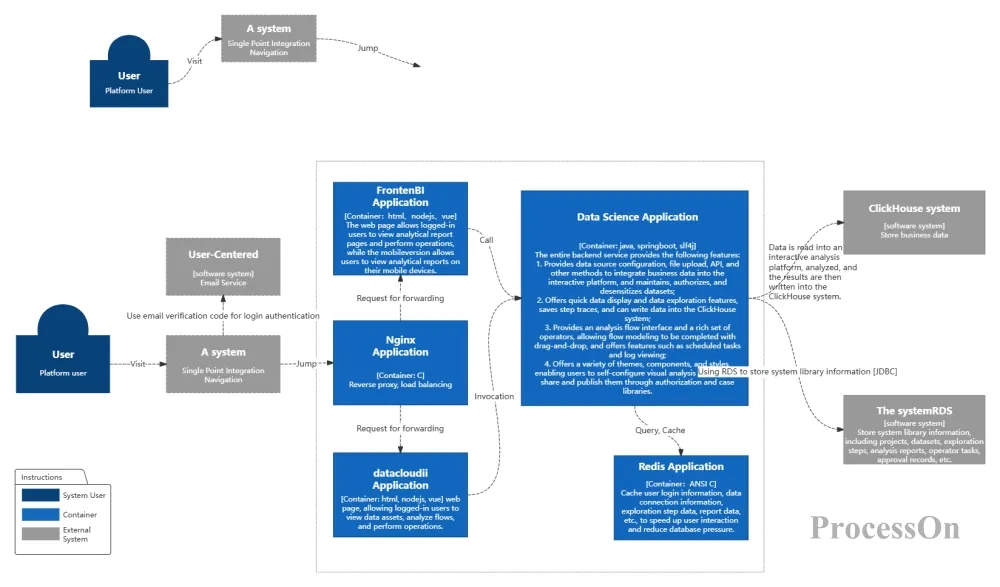
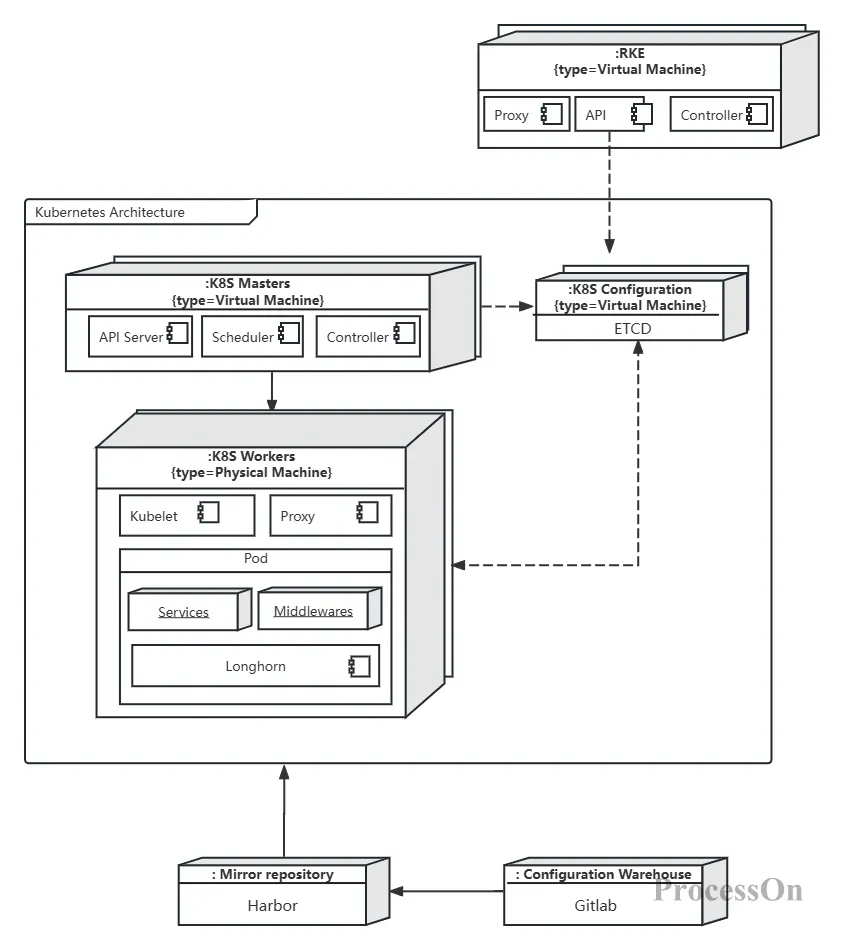
The container diagram is an enlargement and supplement to the system context diagram, showing the physical structure of the system. Each container represents a separately runnable/deployable unit, such as a web server, application server, database server, etc. The container diagram also shows the main technology selection of the system and the communication and interaction between containers.
Main elements: containers within the scope of the software system, such as Spring Boot packaged applications, MySQL databases, Redis, etc.
Target audience: Technical people within and outside of software development teams, including software architects, developers, and operations/support staff.
The component diagram goes deep into the container, showing the components it contains and the relationships between them. Components usually represent the main business functions of the system, such as user interface, business logic, data processing, etc. This type of diagram is very important for developers and architects because it provides a detailed view of the internal structure of the system.
Main elements: components within the container, such as Dubbo interface, REST interface, Service, etc.
Target audience: Software architects and developers.
C4 container component diagram
Code diagrams show the classes and interactions within a component, and are the most detailed level. This type of diagram is usually used to show the implementation details of a single component, including classes, their properties, methods, and relationships. However, in today's agile development world, it is generally not recommended to produce code diagrams, unless it is a very important component that has not yet been coded.
Main elements: code elements within a component, such as classes, interfaces, objects, functions, database tables, etc.
Target audience: Software architects and developers.
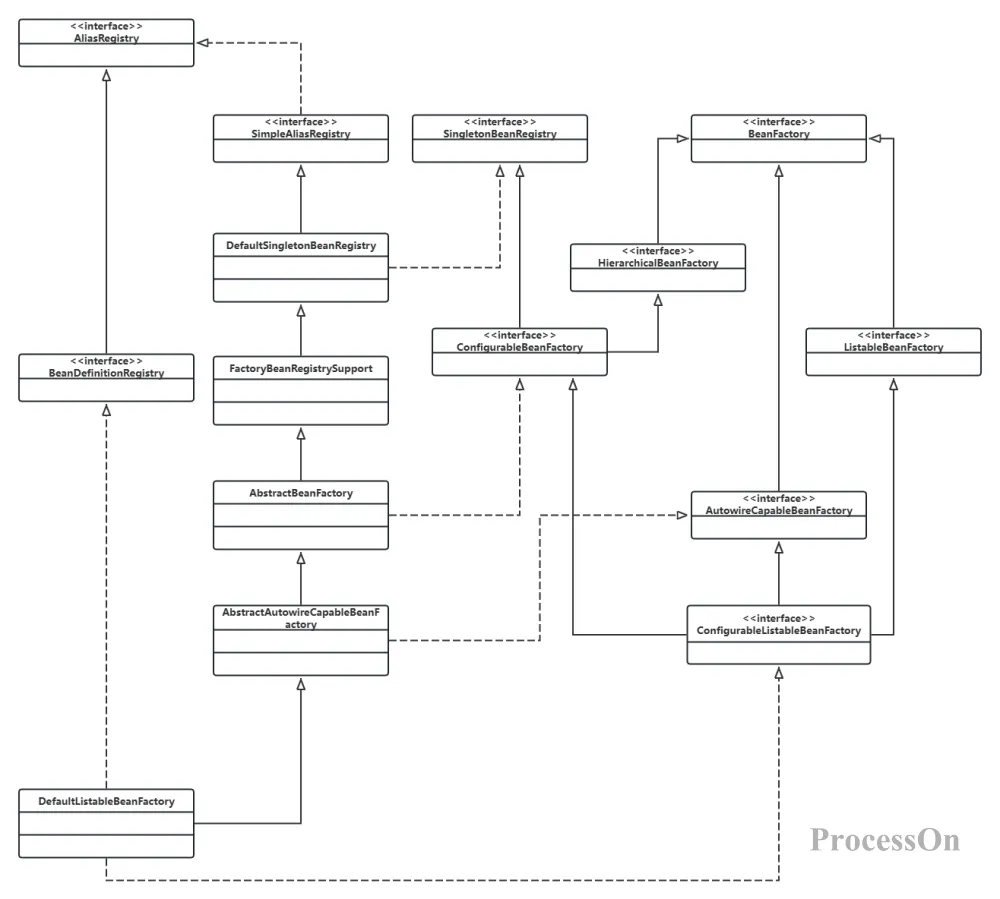
C4 code diagram - container loading related class diagram
In addition, the C4 model also includes extended views such as system landscape diagrams, dynamic diagrams, and deployment diagrams to describe the combination and collaboration of software systems at different levels and scenarios.
There are many tools for drawing C4 charts, common tools include draw.io, Plantuml, ProcessOn, etc. Users can choose the appropriate chart tool according to their needs. For beginners, it is recommended to use ProcessOn , which is a professional flowchart tool that supports online drawing of C4 charts and provides a wealth of spider chart templates.
1. logging into ProcessOn , click the "New File" button. Select "Flowchart" in the pop-up options .
2. ProcessOn provides a variety of templates. You can choose a suitable C4 chart template as a starting point when creating a new file, which can save a lot of time in setting up and layout.
If you choose to start from a blank page, you can skip this step.
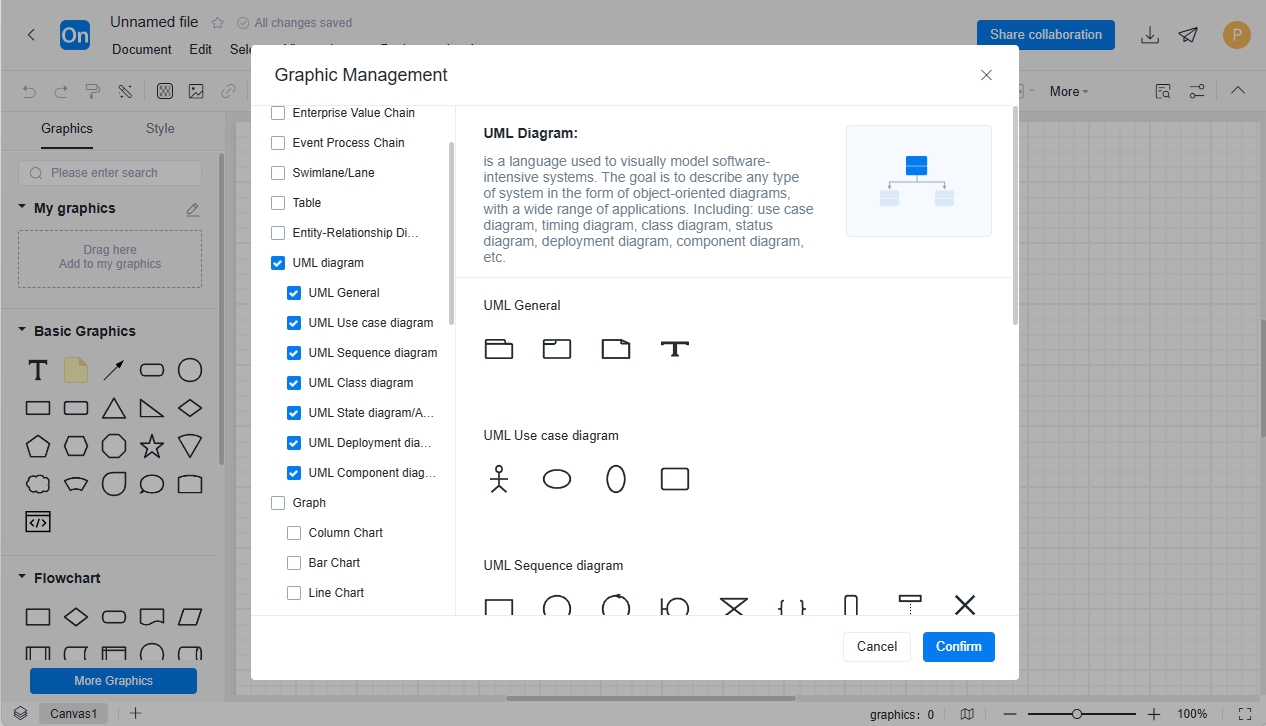
3. Click "More Graphics" under the graphics library on the left, select the type of C4 chart you want to create, and click "OK".
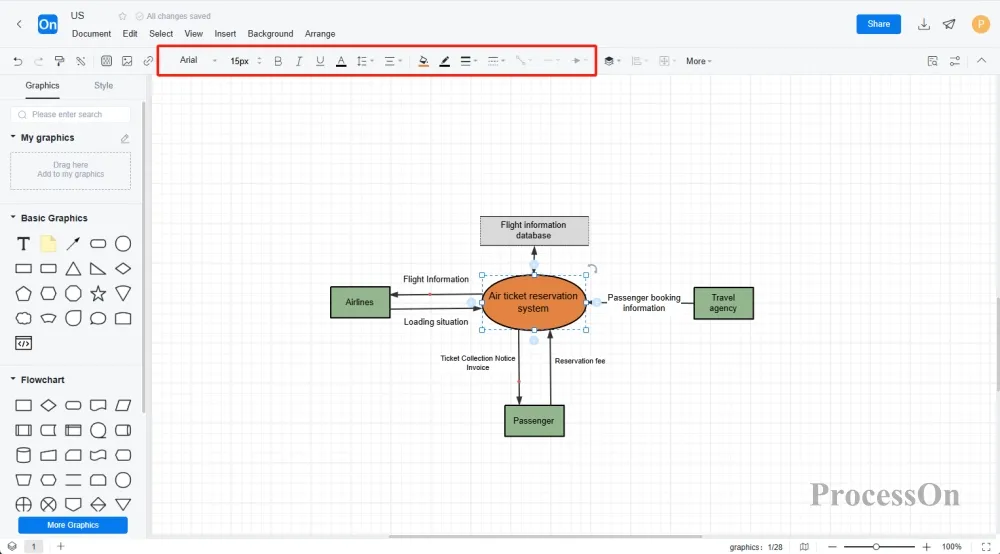
4. Select the appropriate element from the graphics library on the left and drag it onto the canvas, adjust the size and position, select the graphic, and click "+" to create a connection to other graphics. Select the graphic or connection, and the top toolbar can set the color, border, font and other properties of the graphic or connection.
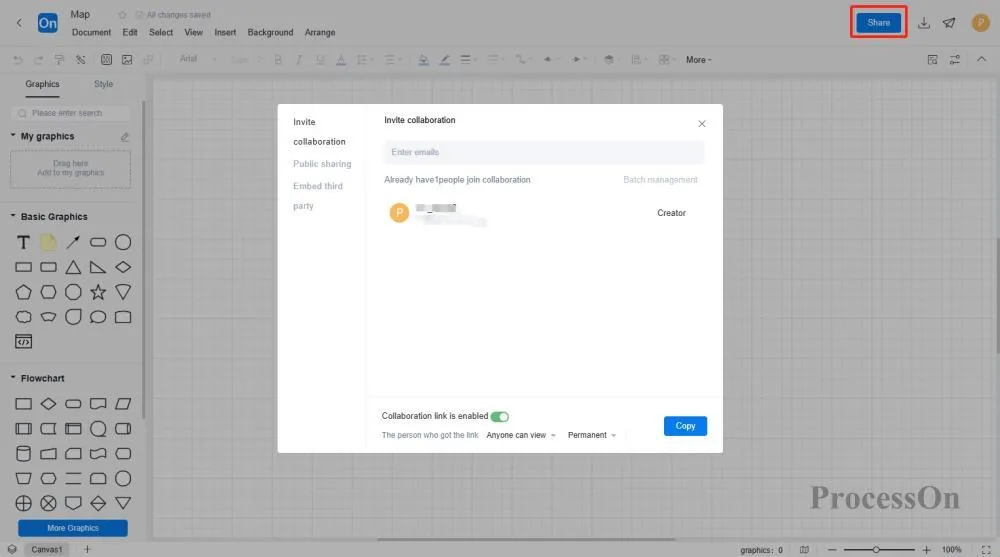
5. and collaboration function provided by ProcessOn to share the C4 diagram with team members or stakeholders for viewing or editing . You can also export the C4 diagram to images or PDF formats for use in other occasions.
The following is a C4 model of an Internet banking system:
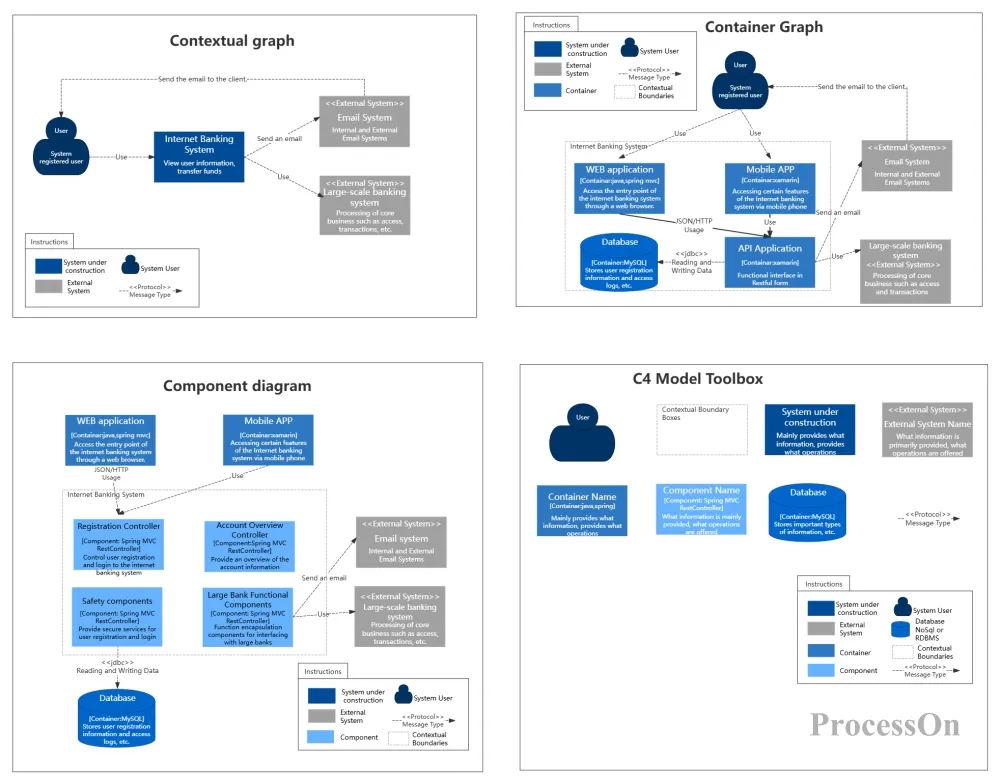
Architecture Design - C4 Diagram
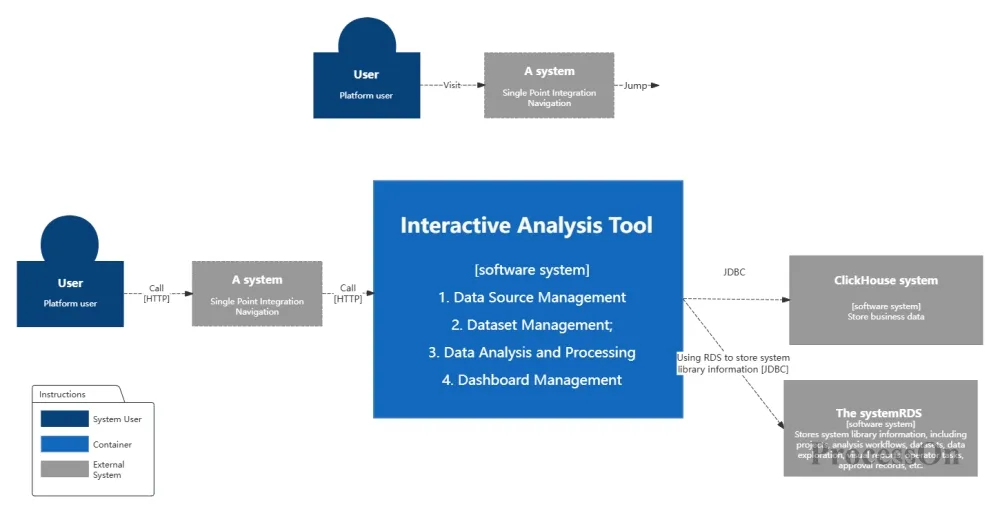
The following is a C4 model of a data production and release module of a software system:
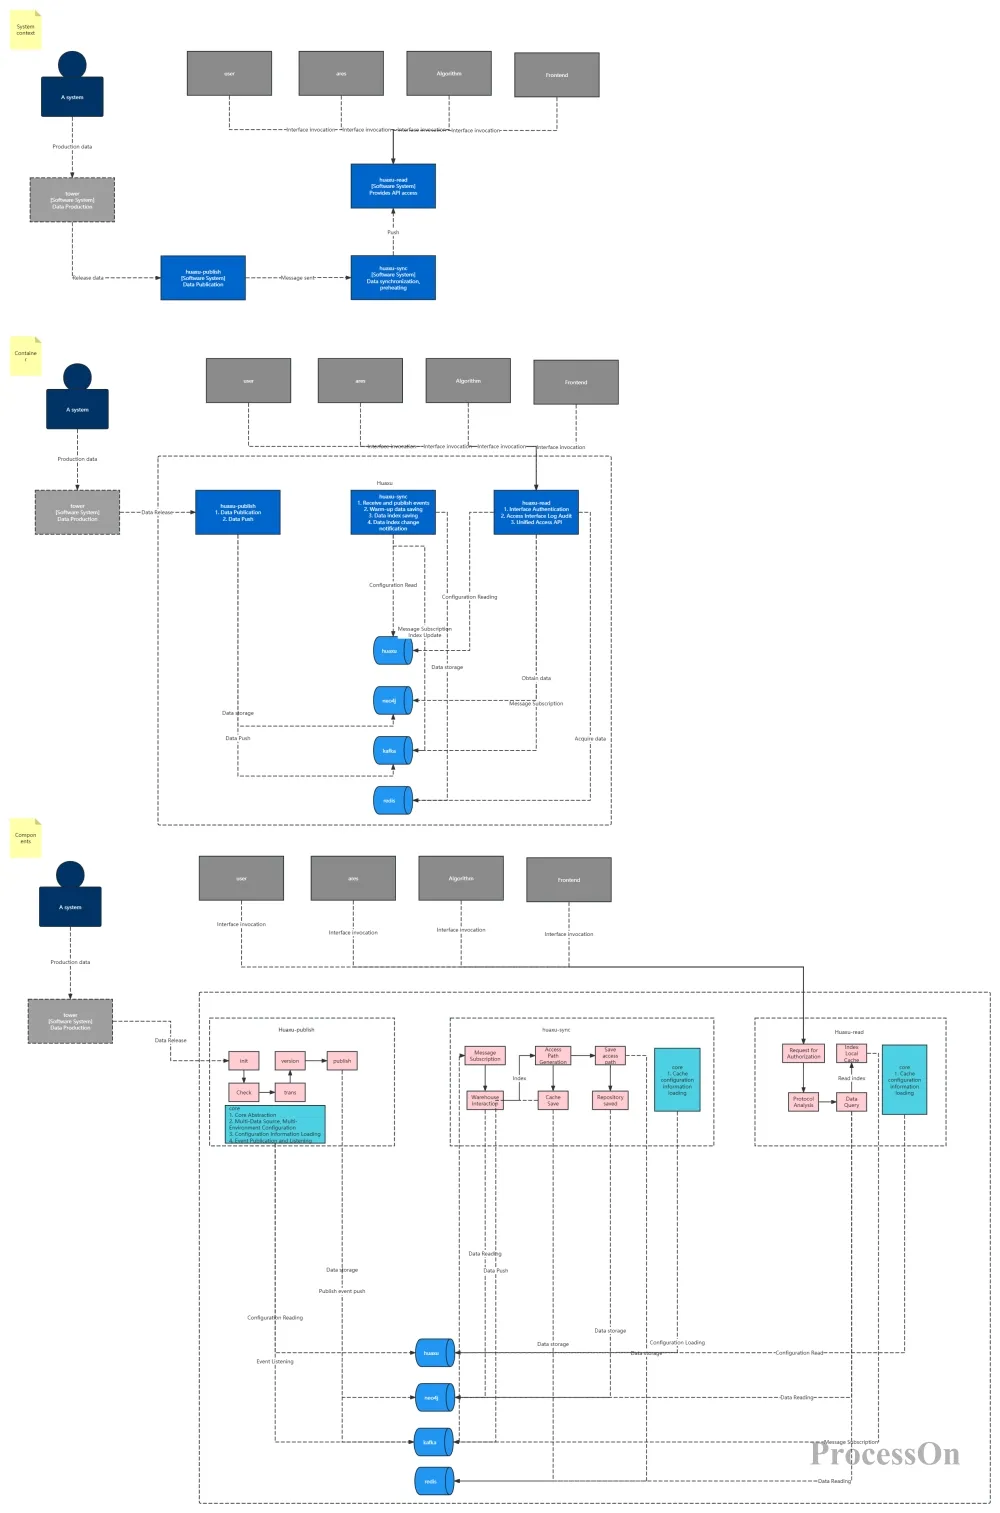
C4 diagram of a software system
The above templates are all from the ProcessOn template community. You can refer to the ideas of architecture design or clone them for use.
The C4 Model is a powerful tool that helps development architects understand and communicate software architecture in a consistent and clear way. By using C4 diagrams in your projects, you can improve communication efficiency, reduce the risk of misunderstandings, and ensure that architectural decisions are properly documented and understood. Whether you are a senior architect or a novice developer, C4 diagrams are an indispensable part of the architectural toolbox.
Related reading:
What is a System Context Diagram? Concepts, tutorials, examples
What is a system architecture diagram? Drawing tutorial and application examples