
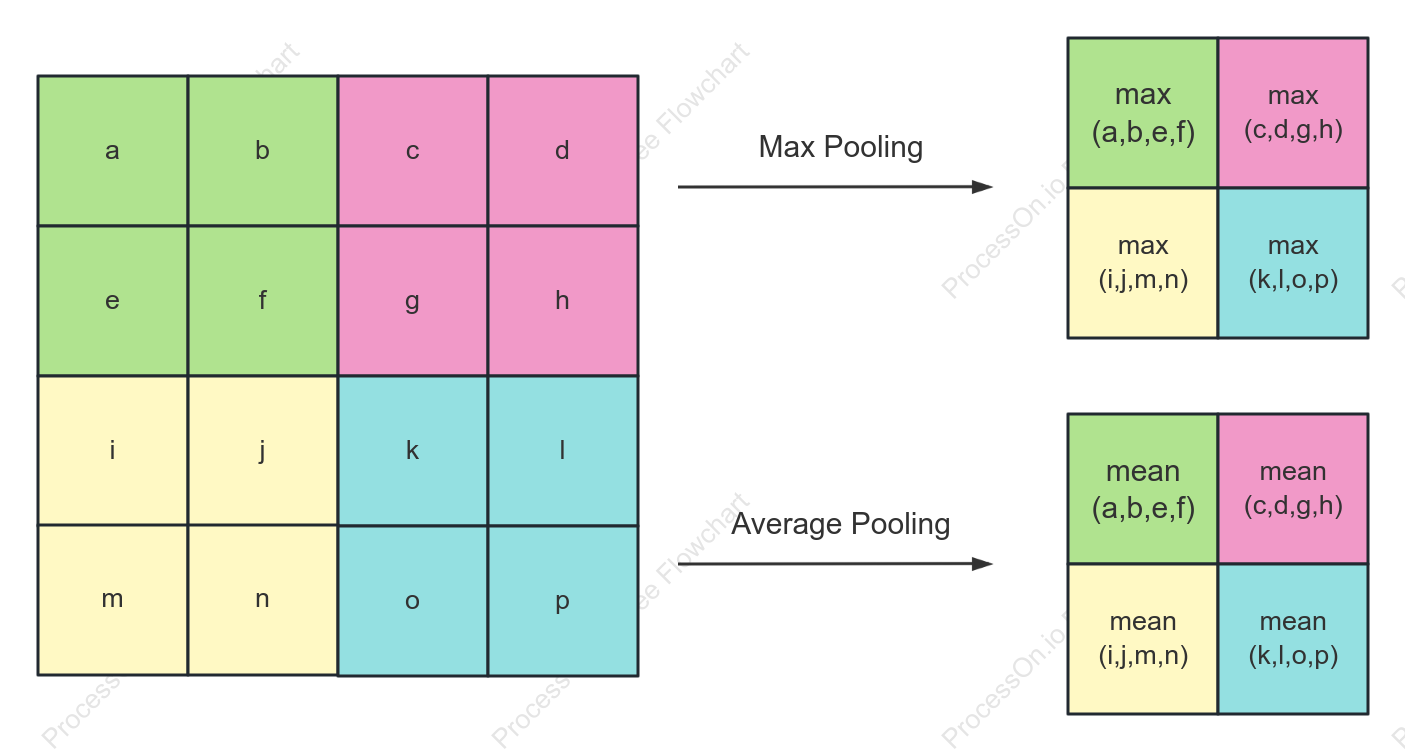

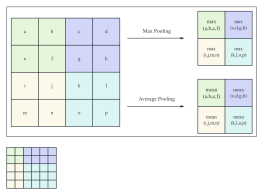
Diagram of the pooling operation in a CNN
0 Report
This figure illustrates how pooling layers spatially downsample the convolutional output feature map. A sliding window sequentially scans the feature plane, extracting key response values within the window using either max pooling or average pooling strategies. The window slides with a specified stride until it covers the entire spatial region, ultimately outputting a feature map with reduced resolution but unchanged channel depth. This operation effectively reduces data size while preserving significant semantic information, decreasing the number of parameters and computational burden in subsequent layers, and improving the model's robustness to local translations and deformations.
Related Recommendations
Other works by the author
Outline/Content
See more
输出特征图
Max Pooling
f
n
e
c
i
o
b
a
h
Average Pooling
j
k
p
g
l
m
Output
d
Collect
Collect
Collect
Collect
Collect
Collect

Collect

0 Comments
Next Page